
EB Daily Market Report - Thursday, February 17, 2022
Executive Market Summary
- Futures were weak right out of the gate and there's been very little buying interest throughout the session
- Growth stocks are once again the primary target of sellers, with small caps ($DJUSGS, -2.86%) hit slightly harder than large caps ($DJUSGL, -2.52%)
- Gold ($GOLD, +1.66%) closed above $1870 yesterday for the first time since June and that's triggered more technical buying today; GOLD is currently just above $1900 per ounce
- Cryptocurrencies are all down significantly today as etherium ($ETHUSD) drops more than 8%
- Crude oil ($WTIC, -2.31%) remains very volatile, today falling back to $91.50 per barrel
- The 10-year treasury yield ($TNX) is down 7 basis points to 1.98%, nearing its recent breakout level
- The sector leaderboard is reflected below, but it's been a very rough day for aggressive sectors
- Albemarle Corp (ALB, -18.22%) is the worst S&P 500 performer today after releasing quarterly results
Market Outlook
I don't need a long dissertation on what's going on in the market today. I will show you the sector leaderboard and then my favorite ratio chart - consumer discretionary vs. consumer staples (XLY:XLP):
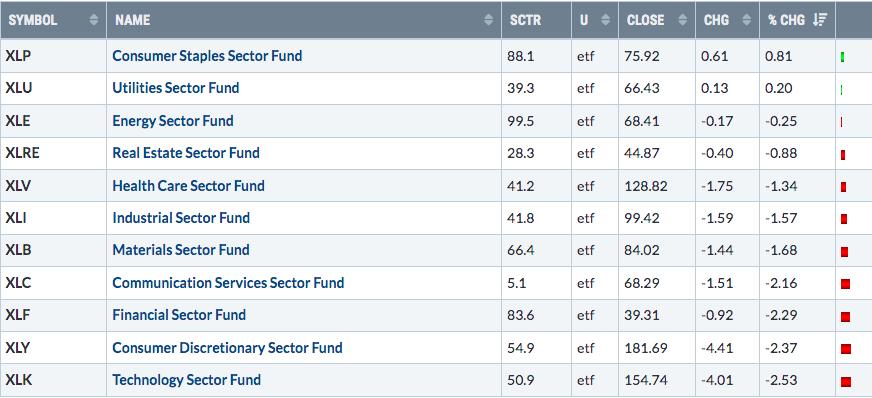
The XLP is our best-performing sector and the XLY is down at the bottom of the heap with technology (XLK). Check out the XLY:XLP ratio on this chart:
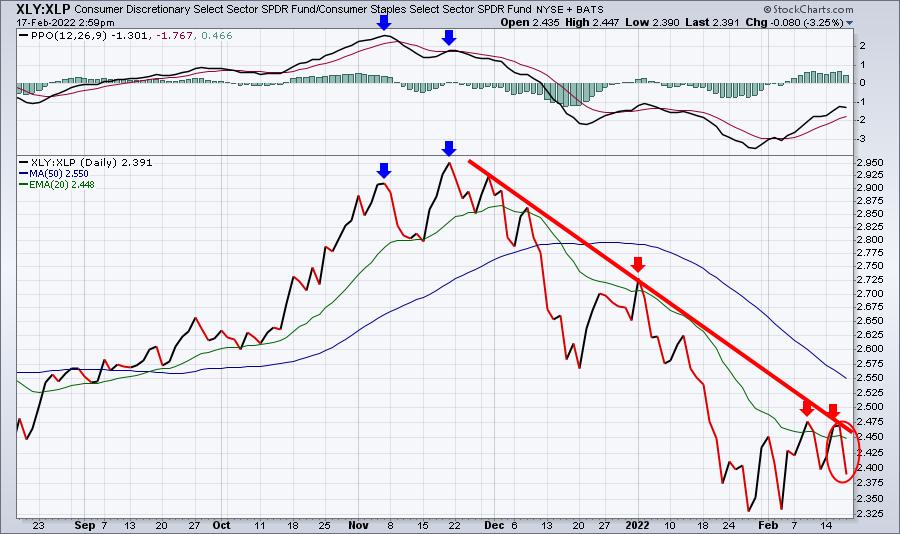
I don't know what the next couple days holds in store, but this chart is screaming to me that the selling isn't over. We could see impulsive selling return. The key will be short-term neckline support at 4300. If that doesn't hold, I see the selling really accelerate and fear completely engulf the market.
Continue to be very careful.
Sector/Industry Focus
The Volatility Index ($VIX) is jumping again today as we see another 12% pop (at last check). The higher the VIX goes, the more volatility we should expect. It could very well be violent in both directions, although the primary trend is likely to be lower. This is a unique chart to review:
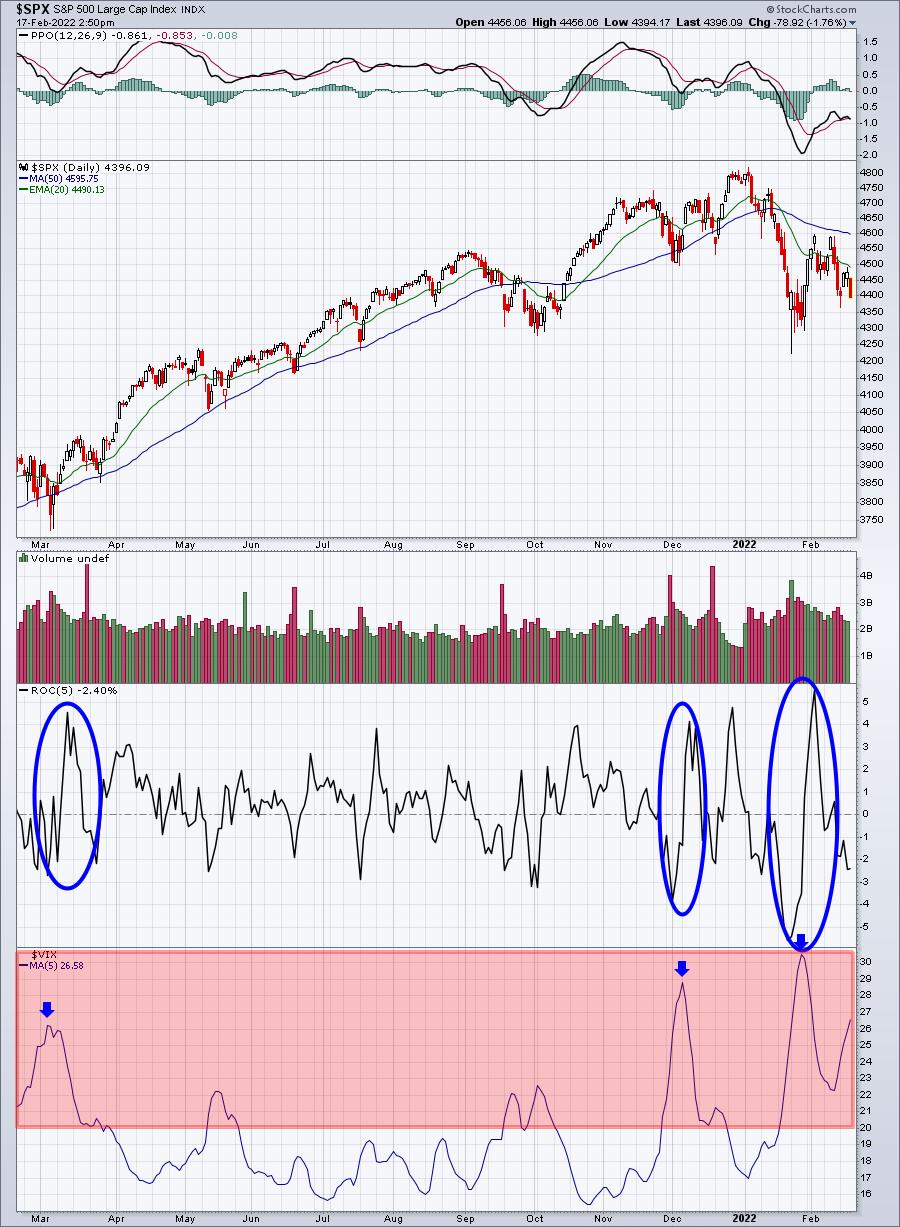
It's a daily chart of the S&P 500 with a 5 period (day) rate of change (ROC) just beneath. Finally, the bottom panel is the 5-day moving average of the VIX. Notice that as the moves in the VIX move higher, so too do the ROCs - and in both directions!
This is what makes trading so treacherous in the near-term when the VIX is so elevated.
ChartLists/Strategies
Given the backdrop of net in-the-money put premium, I certainly would've expected a bit more rally this week. We still have one more day and absolutely anything could happen. But today's action really underscores why being confident on the long side is almost impossible. My signals continue to point to more downside action ahead.
I'm remaining safely in cash (and the GLD). I had hoped for more strength into tomorrow to initiate short positions, but the market isn't cooperating. The VIX near 27 makes it really difficult to trade.
I'd rather sit on my hands in this market.
Earnings Reports
Here are the key earnings reports for the next two days, featuring stocks with market caps of more than $10 billion. I also include a few select companies with market caps below $10 billion. Finally, any portfolio stocks that will be reporting results are highlighted in BOLD. If you decide to hold a stock into earnings, please understand the significant short-term risk that you are taking. Please be sure to check for earnings dates for any companies you own or are considering owning.
Thursday, February 17:
WMT, SO, BAX, DLR, KEYS, ED, WST, PLTR, EPAM, AEE, ROKU, VTR, GPC, POOL, OWL, NICE, LKQ, LBTYA, LNT, CGNX, RGEN, GLOB, RS, DBX, SEE, SYNH, USFD, ATR, RCM, AN, RBA, YETI, SWAV, AMN, AL, RUN, IRDM, POR, AUY, APPN, QDEL, LTHM, MATX, TSEM, SHAK, RDFN, FVRR, VC, TPH, TDS, AAWW, SWI, LGND, HIMX, SKT
Friday, February 18:
DE, PPL, DKNG, ARNC, ABR, B, BLMN
Economic Reports
Initial jobless claims: 248,000 (actual) vs. 224,000 (estimate)
January housing starts: 1,638,000 (actual) vs. 1,708,000 (estimate)
January building permits: 1,899,000 (actual) vs. 1,760,000 (estimate)
February Philadelphia Manufacturing Index: 16.0 (actual) vs. 19.7 (estimate)
Happy trading!
Tom