
EB Daily Market Report - Friday, February 18, 2022
ChartLists Updated
We are in the process of updating several ChartLists. Thus far, I've updated the following ChartLists and they should be available for review/download on our website (or will be shortly):
- Strong Earnings ChartList (SECL)
- Strong Future Earnings ChartList (SFECL)
I am hoping to have the following updated over the weekend:
- Raised Guidance ChartList (RGCL)
- Short Squeeze ChartList (SSCL)
- Strong AD ChartList (SADCL)
- Earnings AD ChartList (EADCL)
- Bullish Trifecta ChartList (BTCL)
Two Events This Weekend
I'll be hosting the third of our February Educational Series tomorrow, February 19th, at 10:00am ET. It's "The Most Overlooked Growth Stocks", where I'll discuss a large number of stocks that I'll have on my radar as this cyclical bear market plays out. If I'm right about the direction of the stock market, I believe we will have a tremendous opportunity later in 2022 to enter strong growth stocks at ridiculously low levels.
On Monday, February 21st (Presidents Day - Market Closed), I'll be hosting our Top 10 Stocks event, where the 10 equal-weighted stocks to be included in each portfolio will be revealed.
I hope you can make both events, but they'll be recorded in the event you can't make it live.
Executive Market Summary
- Futures were weak initially, strengthened overnight, then turned negative just before the open
- Our major indices showed early strength, but then selling kicked in again; the good news is buyers stepped in just before key neckline support levels were lost - see more below
- Commodities are mixed today - silver ($SILVER) and copper ($COPPER) are fractionally higher, while gold ($GOLD) and crude oil ($WTIC) are fractionally lower
- The 10-year treasury yield ($TNX) is down 4 basis points to 1.93%, nearing its rising 20-day EMA; expect a bounce off this key moving average
- Risk off areas are doing much better than risk on areas
- Consumer staples (XLP, +0.12%) is today's best performing sector, while energy (XLE,-0.77%) and technology (XLK, -0.70%) are taking the biggest hits
- Renewable energy ($DWCREE, -2.55%) is leading the XLK lower, although it's well off its intraday low
- Intel (INTC, -5.05%) is breaking down to a fresh 52-week low after Barclays lowered its price target to 45 today
Market Outlook
As I pointed out yesterday, the selling has continued, but we also are seeing buyers return just as a MAJOR neckline support test approaches. Here are the two major charts that I'm watching, with the key neckline support on each:
S&P 500:
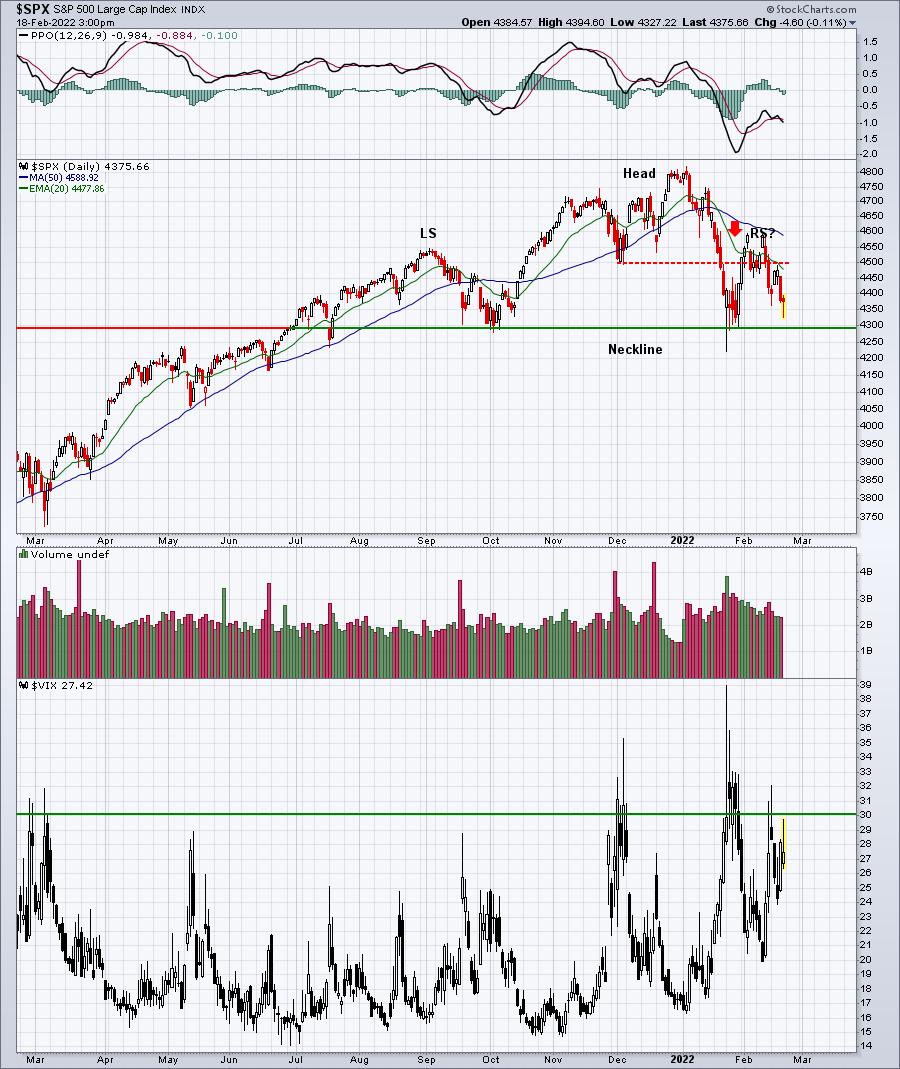
We stopped just shy of 4300 neckline support, which is a very good thing short-term. But I believe it's just a matter of time before this neckline support is lost. Note that the Volatility Index ($VIX) nearly hit 30 today. There's a lot of fear in the streets already, so if major support is lost, look out below!
Dow Jones U.S. Large-Cap Growth Index:
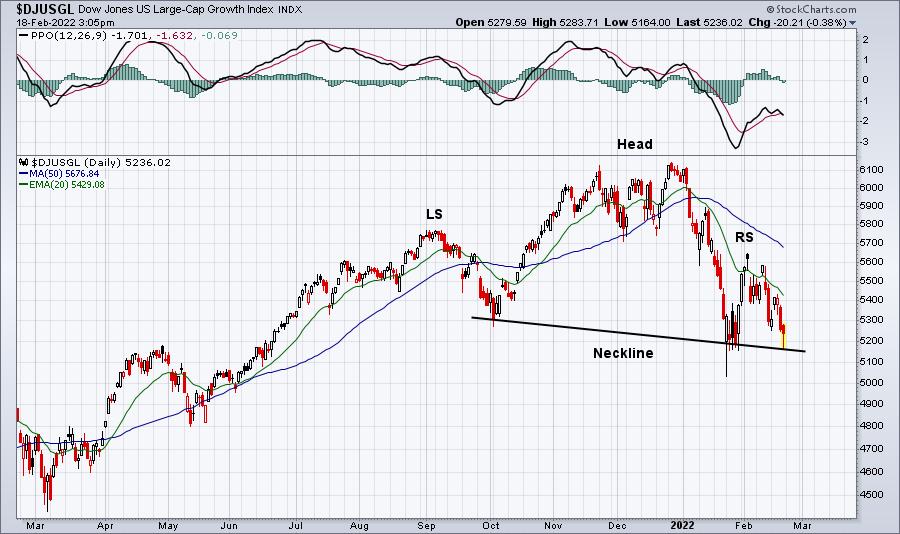
The day's not over, so keep a very close eye on this chart. Large cap growth names hold the cards on the S&P 500's performance ahead. I believe this area of the market has been weakening and setting up for a much more substantial decline. If I'm right, it will all start with a breakdown beneath this neckline support.
Sector/Industry Focus
While I'm very cautious about 2022, particularly the next couple months, there are areas of the market that appear to be much safer to me. Insurance brokers ($DJUSIB) broke out in October 2021 and appear to be consolidating in a bullish wedge:
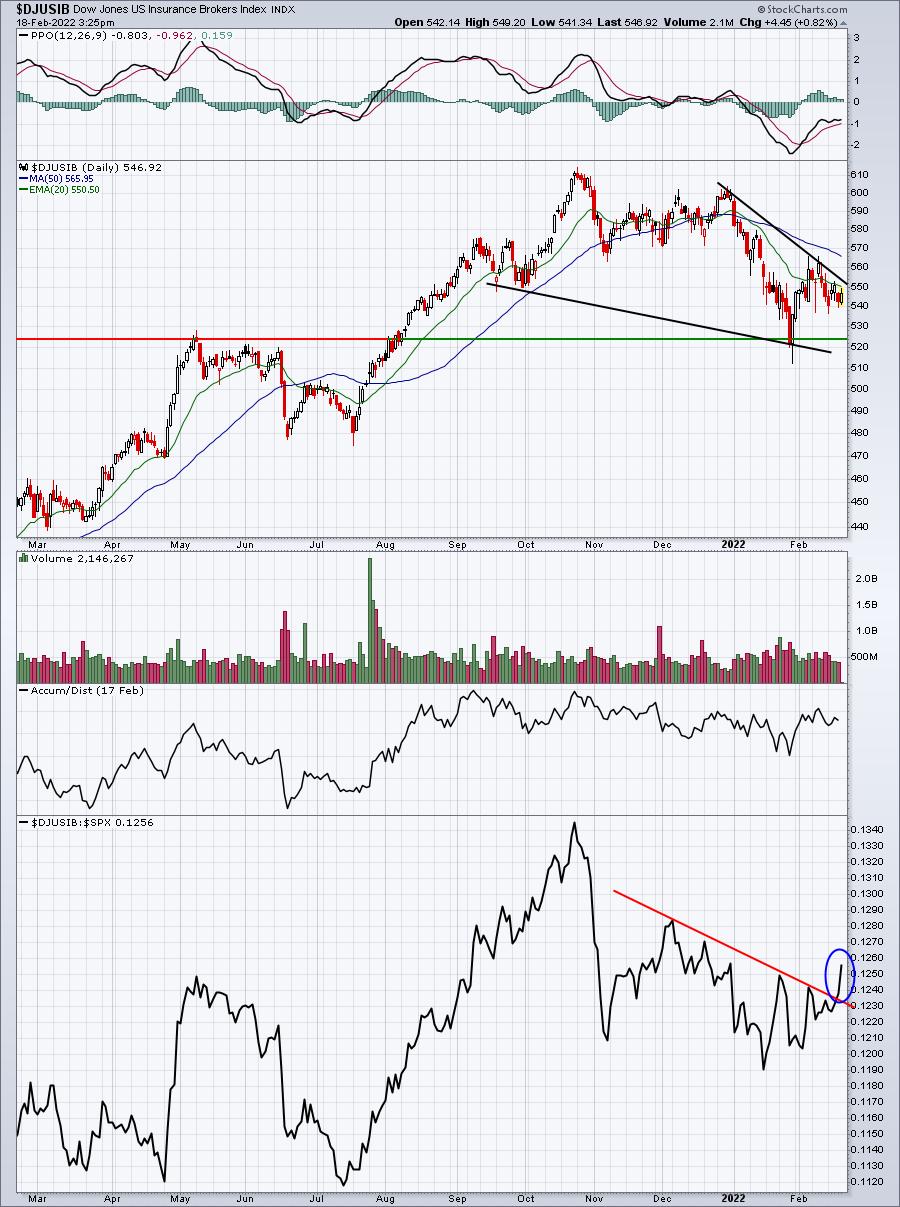
The wedge isn't perfect, but I still like the overall pattern here, so long as the late-January low holds as support. If that fails, then all bets are off. In the bottom panel, it appears as though the DJUSIB is also picking up relative momentum as well.
ChartLists/Strategies
Working off the insurance broker weakness, I looked on our updated Strong Earnings ChartList (SECL) and found two insurance brokers. They are EQH and MMC. The former just recently broke out, but has pulled back quite a bit. I think the chart looks interesting and buying into further weakness may provide a great trading opportunity:
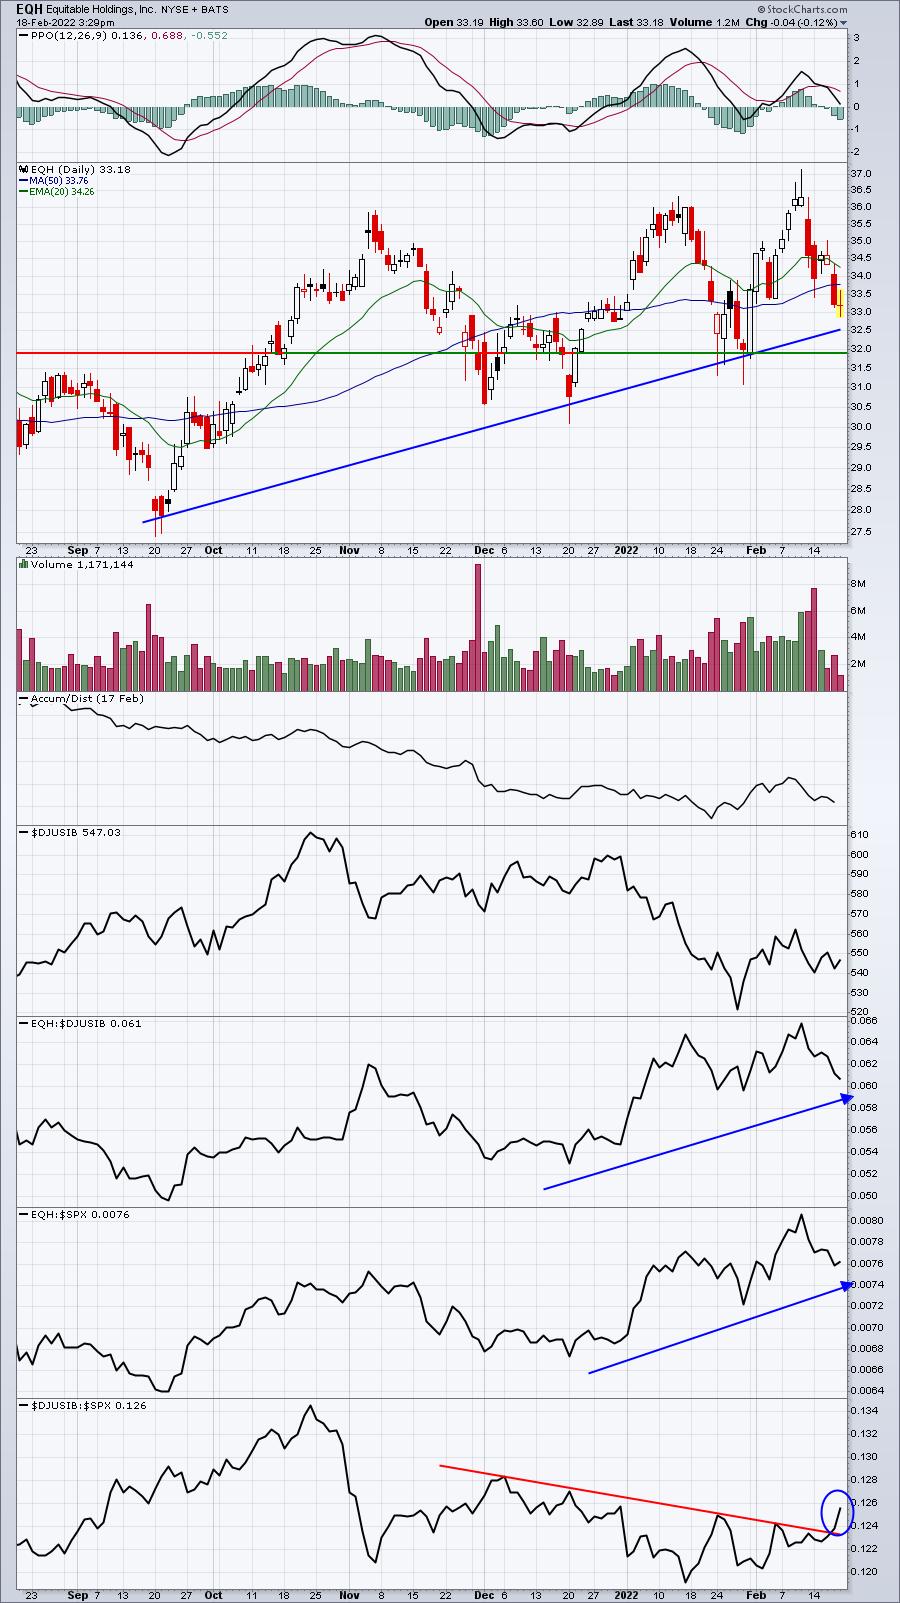
Trendline support is rapidly approaching and it looks like the 32.00-32.50 area represents solid reward-to-risk entry. A return trip to its recent highs above 36 would yield more than a 10% return. It's simply another type of trade to consider, while the growth stocks reprice.
Earnings Reports
Here are the key earnings reports for the next two days, featuring stocks with market caps of more than $10 billion. I also include a few select companies with market caps below $10 billion. Finally, any portfolio stocks that will be reporting results are highlighted in BOLD. If you decide to hold a stock into earnings, please understand the significant short-term risk that you are taking. Please be sure to check for earnings dates for any companies you own or are considering owning.
Friday, February 18:
DE, PPL, DKNG, ARNC, ABR, B, BLMN
Monday, February 21:
WMB, SUI, ICLR, APA
Tuesday, February 22:
HD, MDT, PSA, PANW, NU, A, CDNS, VRSK, O, CSGP, FANG, TRU, CZR, EXPD, MOS, AGR, CNP, RNG, WLK, NDSN, EXAS, TDOC, MIDD, M, BLD, TPX, TNDM, NXST, TOL, CFX, TXRH, KBR, LPX, ESI, WK, MTDR, SPT, FLR, HL, RXT, GKOS, SPCE, RIG, KTOS
Economic Reports
January existing home sales: 6,500,000 (actual) vs. 6,088,000 (estimate)
January leading indicators: -0.3% (actual) vs. +0.3% (estimate)
Happy trading!
Tom