
EB Daily Market Report - Tuesday, February 22, 2022
ChartList Update
We'll be adding several charts/spreadsheets to our website later today. The spreadsheets, because they involve a great deal of time on our part, will be available to annual members. If you're a trial member or a monthly member and would like to upgrade to an annual membership (and save a TON of $$$), simply contact us at "[email protected]" and we'll get that taken care of for you.
Executive Market Summary
- Futures opened last night significantly lower, then worked their way back near the flat line this morning
- After an initial push higher this morning, the sellers are back with relative weakness on the NASDAQ
- The Volatility Index ($VIX) is up 9% and is now above 30 - keep in mind when the VIX moves into the 30s, the movement in both directions can be extreme!
- Consumer discretionary (XLY, -2.59%) is taking another big hit, led lower by furnishings ($DJUSFH, -8.66%) and home improvement retailers ($DJUSHI, -7.16%)
- Home Depot (HD, -8.92%) is wearing on the Dow Jones today after reporting its latest quarterly results
- Most commodities are higher as crude oil ($WTIC, +2.12%) and gold ($GOLD, +0.28%) both rise; silver ($SILVER, +1.22%) is up nicely too
- All eyes are on (or should be on) the neckline support on many key indices; a close below 4300 on the S&P 500 would be very bearish, especially with the VIX so elevated
Market Outlook
There is one very bullish short-term indication here today and one very bearish short-term indication. Which one will win out? I believe today holds the cards as to whether we'll have a chance to bounce a bit or if the bulls give up and throw in the towel. Let's start with the bullish argument on the NASDAQ 100 (QQQ is the ETF that tracks this index):
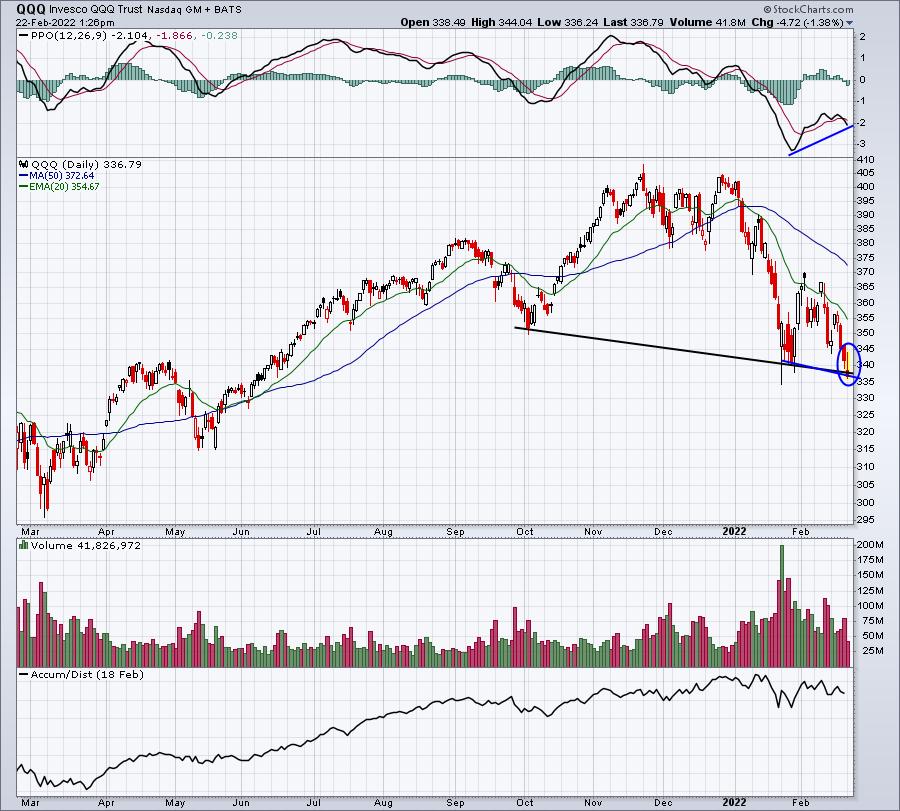
If we rally into the close and print a reversing candle (think piercing or engulfing candles), the positive divergence could signal at least a short-term rally. Also, if we do reverse later and you decide to trade on the long side, a stop should then be considered beneath today's low.
Now for the bad news. In addition to being in what I believe is a cyclical bear market, we've also just entered the dreaded 19th through the 25th period of the calendar month that will last through week's end. There is definitely a historical tendency to see weakness this time of the calendar month. For all calendar months on the NASDAQ, here are the annualized returns by calendar day (of all months, not just February):
- 19th: -29.86%
- 20th: -31.10%
- 21st: +15.78%
- 22nd: -3.29%
- 23rd: -5.20%
- 24th: +0.47%
- 25th: +7.01%
Only the 21st produces an annualized return that's greater than the average annual return on the NASDAQ. And because the 19th, 20th, and 21st fell over a holiday weekend this month, we certainly have to wonder if this period of weakness will be felt starting today.
Also, don't forget that the VIX is over 30 right now. If the overall market breaks down from a head & shoulders top with the VIX already in the 30s, we could see intense and impulsive selling later today. This will be a very interesting day indeed.
Who wins, the bulls or the bears?
Sector/Industry Focus
Travel & tourism ($DJUSTT) is a very interesting industry group to watch. We haven't yet broken out on a relative basis, but we've certainly improved quite a bit off of recent relative lows. From an absolute price perspective, we continue to hold key price support. So I still like the group, but here's the chart and the technical levels to watch:
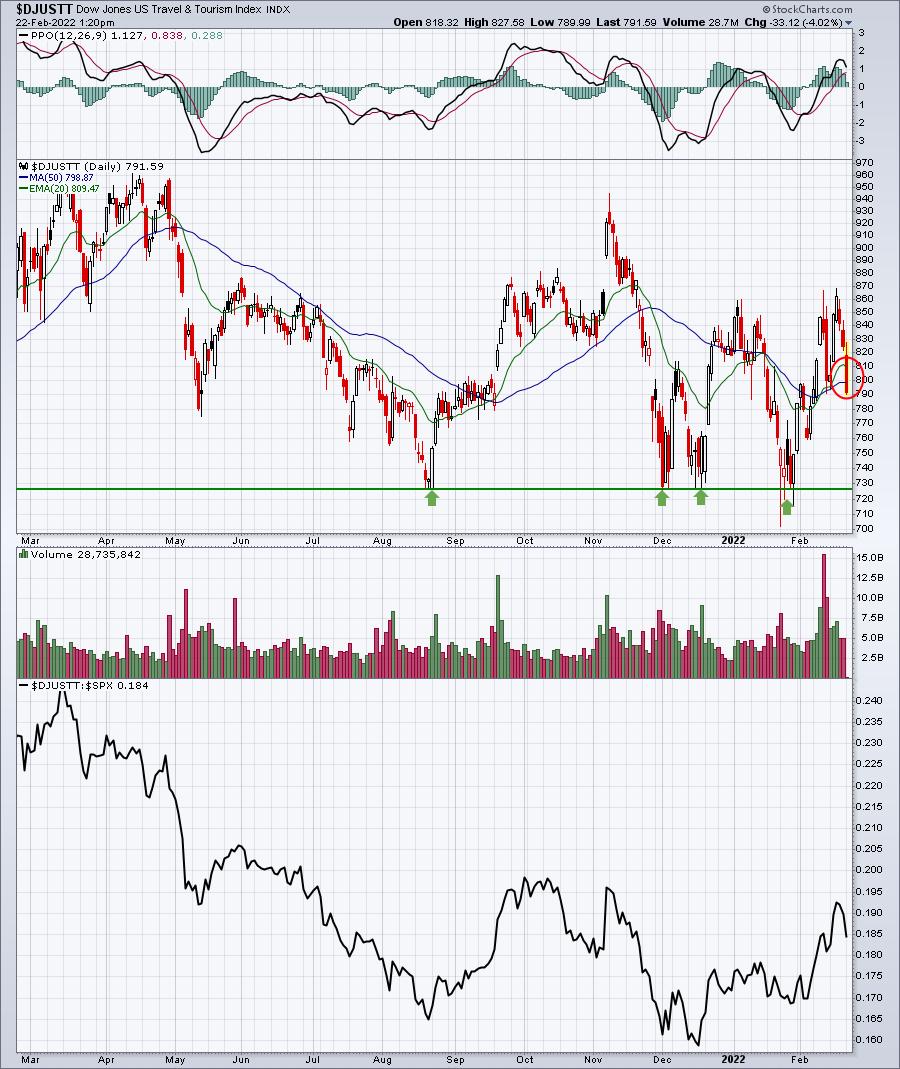
The DJUSTT is having a rough day today and currently trades beneath both its 20-day EMA and 50-day SMA. A rally this afternoon to hold both of these key moving averages would be short-term bullish. However, failure to hold could lead to another test of MAJOR price support just below 730. Meanwhile, on the relative chart, the group needs to break above the relative high in October.
ChartLists/Strategies
Today is a HUGE day for the stock market. I'd be very careful on either side of the trade. We could see a significant kick save and brief rally.....or we could see all-out selling this afternoon, spurred by a very fearful market (high VIX).
I'm sitting it out.
Earnings Reports
Here are the key earnings reports for the next two days, featuring stocks with market caps of more than $10 billion. I also include a few select companies with market caps below $10 billion. Finally, any portfolio stocks that will be reporting results are highlighted in BOLD. If you decide to hold a stock into earnings, please understand the significant short-term risk that you are taking. Please be sure to check for earnings dates for any companies you own or are considering owning.
Tuesday, February 22:
HD, MDT, PSA, PANW, NU, A, CDNS, VRSK, O, CSGP, FANG, TRU, CZR, EXPD, MOS, AGR, CNP, RNG, WLK, NDSN, EXAS, TDOC, MIDD, M, BLD, TPX, TNDM, NXST, TOL, CFX, TXRH, KBR, LPX, ESI, WK, MTDR, SPT, FLR, HL, RXT, GKOS, SPCE, RIG, KTOS
Wednesday, February 23:
LOW, BKNG, TJX, STLA, EBAY, LYV, ANSS, EXR, IR, ETR, NTAP, HEI, CTRA, VICI, PODD, BMRN, FNF, AEM, BBWI, WTRG, NI, WES, TAP, HTZ, BHC, FIVN, CHK, GIL, VIPS, OLED, GH, HFC, IART, CLH, PAAS, HLF, AMED, OPCH, SUM, FLS, RVLV, LIVN, OUT, BCO, IRTC, STAA, OMI, NUVA, WLL, NEO, UCTT, WWW, EVH, HBM, FLGT, JACK, OSTK, LMND, SKLZ, SNBR, IAG, MGNI, SSYS, BAND, FUBO, IMAX, PLAB, RSKD
Economic Reports
December Case-Shiller home price index: +1.3% (actual) vs. +1.1% (estimate)
December FHFA house price index: +1.2% (actual) vs. +1.0% (estimate)
February PMI composite: 56.0 (actual) vs. 51.9 (estimate)
Happy trading!
Tom