
EB Daily Market Report - Wednesday, February 23, 2022
Upcoming Earnings - Relative Strength ChartList
I just want to make sure that everyone is aware that I was able to complete this ChartList last night and it's been updated on our website. So if you want to see how stocks that report earnings this week have been performing on a relative basis heading into that earnings report, this ChartList is for you!
If you have any questions, send us an email to "[email protected]" and we'll be happy to respond.
Executive Market Summary
- Futures were modestly higher overnight after the S&P 500 avoided a very bearish head & shoulders (H&S) breakdown on Tuesday
- After initial strength this morning, however, sellers have returned and that same H&S breakdown is a very real possibility today
- Cryptocurrencies are mostly higher today as etherium ($ETHUSD, +1.97%) rises for a second consecutive day after a brutal 6-day losing streak
- Gold ($GOLD) is rising slightly, benefiting from further stock weakness and increasing fear
- The Volatility Index ($VIX, +1.01%) was back over 30 earlier today, but so far has resisted setting a new recent daily high
- Energy (XLE, +1.25%) and health care (XLV, +0.24%) are the only 2 sectors in positive territory
- Consumer discretionary (XLY, -1.83%) is under intense selling pressure again today after being the worst performing sector on Tuesday as well
- Technology (XLK, -1.11%) is also struggling as all 8 of its industries are lower
- Moderna (MRNA, -5.61%) will report its quarterly earnings tomorrow; it's today's worst S&P 500 performer, followed by Tesla (TSLA, -4.70%), which broke below $800 today
Market Outlook
If Wall Street is secretly expecting to see a massive reversal and not telling anyone, well the charts are not confirming that. In fact, it's quite the opposite. My favorite sustainability ratio is consumer discretionary vs. consumer staples (XLY:XLP) and that ratio has moved to a new low - beneath yesterday's low, despite the S&P 500 NOT moving to a new low. In other words, Wall Street continues to sell consumer discretionary stocks hand over fist. Check out this 5-day 10-minute chart of the S&P 500, with the XLY:XLP ratio plotted beneath:
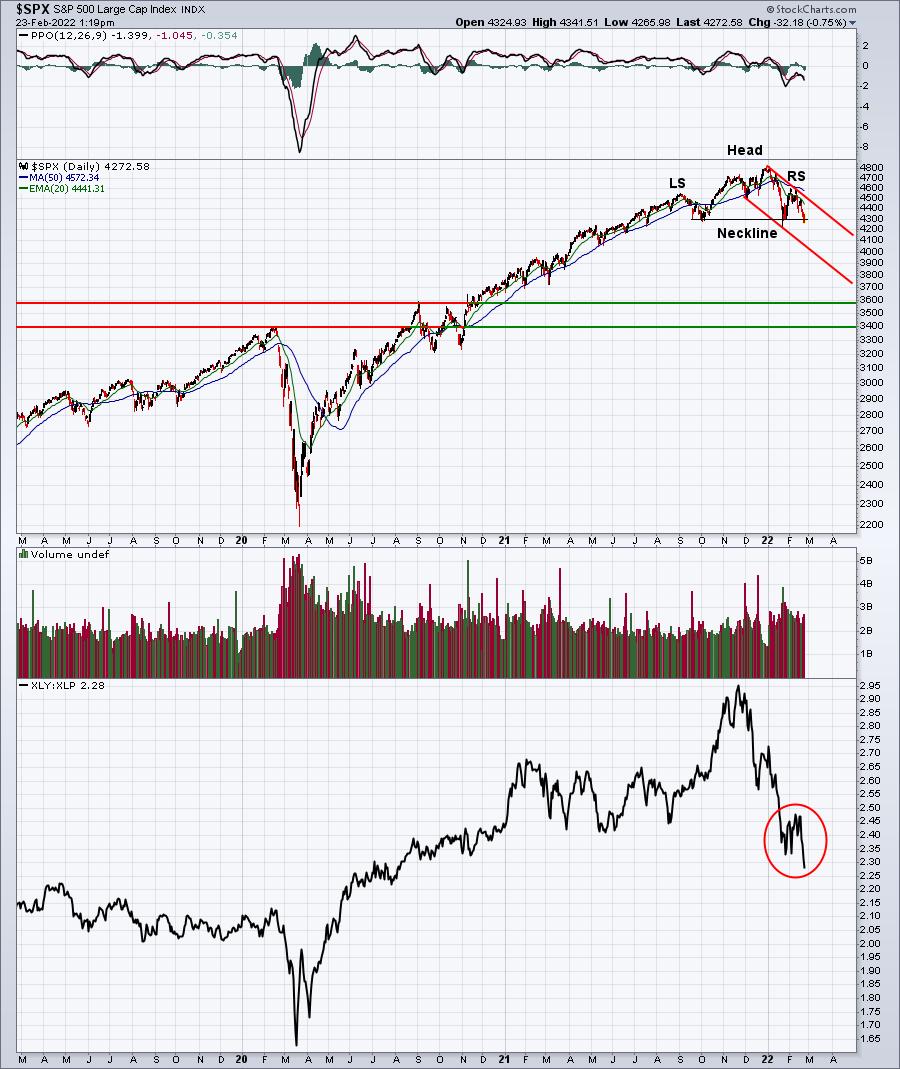
For the second straight day, the bulls are under intense pressure to hold onto neckline support. Yesterday, they were successful. Perhaps they'll be successful again this afternoon. However, the XLY:XLP ratio is breaking down once again. That's not good. The channel that I provided a few weeks back on an intraday basis is shown on this daily chart to show how quickly things could deteriorate if we return to the bottom of the channel. And if the VIX shoots back into the upper 30s or even into the 40s, the channel could break. Trading is NOT rational when the VIX is at extreme levels. We will have to wait until there's capitulation.....wherever that might be.
Sector/Industry Focus
While the stock market has clearly been under incredible pressure, the defensive consumer staples (XLP) group is enjoying a nice uptrend and the XLP is in a bullish continuation pattern - symmetrical triangle. While the absolute chart remains bullish, the relative chart (bottom panel) has been spectacular:
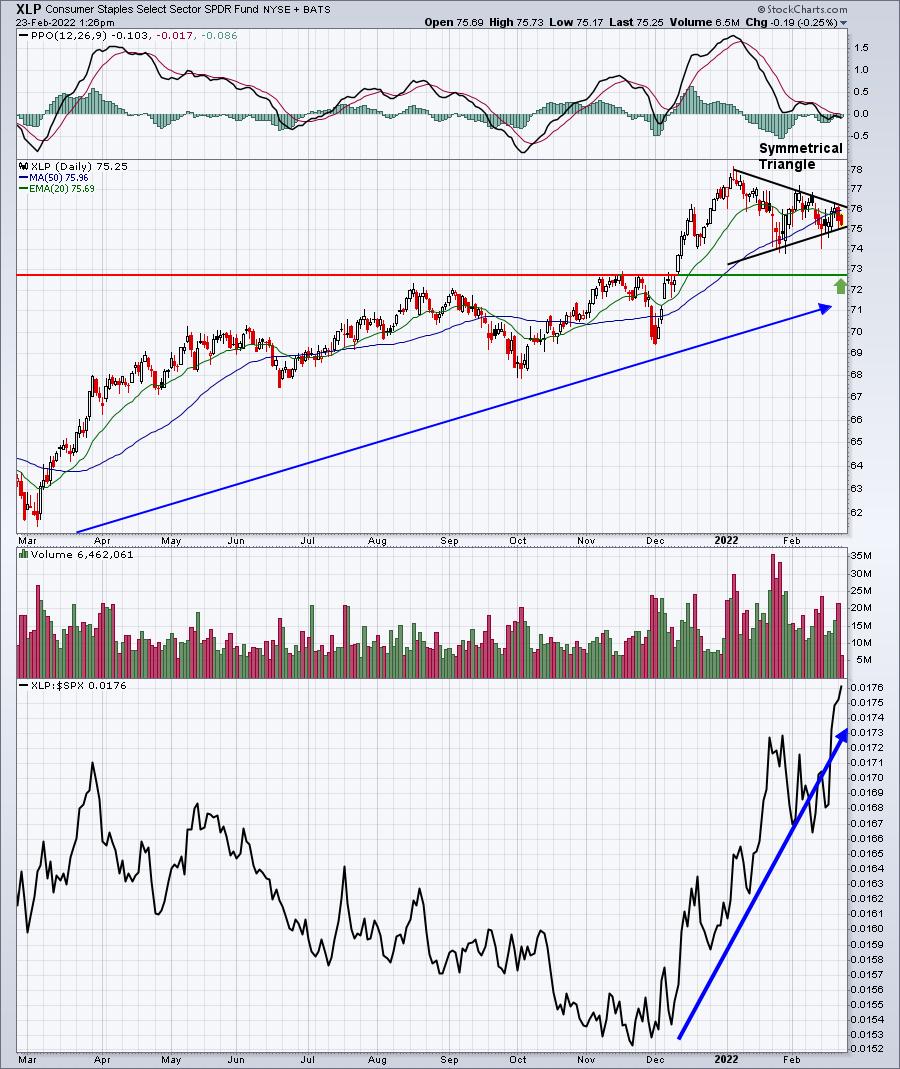
Defensive stocks tend to show significant outperformance during bear markets and that's what we're seeing here. Drawing triangle support and resistance lines are somewhat subjective, but the point here is that it's a bullish pattern. Nonetheless, if the stock market begins to sell off impulsively (rapidly), it's likely that we'll see ALL sectors hit to the downside. The XLP has excellent price support just beneath 73. In a free-falling market, the XLP could easily test this support level.
ChartLists/Strategies
Neckline Support 2.0. That's what today is. As I mentioned yesterday, a major kick save or a major breakdown look quite different. My guess is that today the bulls give way in late-afternoon trading, but it's an educated guess only. If we see another recovery and the S&P 500 closes above 4300, a short-term rally could be in order. But if we breakdown, I see the VIX expanding rapidly and prices absolutely getting crushed near-term. So please please be careful and take necessary precautions - whatever that means to everyone.
Earnings Reports
Here are the key earnings reports for the next two days, featuring stocks with market caps of more than $10 billion. I also include a few select companies with market caps below $10 billion. Finally, any portfolio stocks that will be reporting results are highlighted in BOLD. If you decide to hold a stock into earnings, please understand the significant short-term risk that you are taking. Please be sure to check for earnings dates for any companies you own or are considering owning.
Wednesday, February 23:
LOW, BKNG, TJX, STLA, EBAY, LYV, ANSS, EXR, IR, ETR, NTAP, HEI, CTRA, VICI, PODD, BMRN, FNF, AEM, BBWI, WTRG, NI, WES, TAP, HTZ, BHC, FIVN, CHK, GIL, VIPS, OLED, GH, HFC, IART, CLH, PAAS, HLF, AMED, OPCH, SUM, FLS, RVLV, LIVN, OUT, BCO, IRTC, STAA, OMI, NUVA, WLL, NEO, UCTT, WWW, EVH, HBM, FLGT, JACK, OSTK, LMND, SKLZ, SNBR, IAG, MGNI, SSYS, BAND, FUBO, IMAX, PLAB, RSKD
Thursday, February 24:
BABA, RY, INTU, AMT, NTES, EOG, MRNA, KDP, NEM, VMW, ADSK, SQ, DELL, AEP, MNST, COIN, OXY, ZS, CBRE, PEG, LNG, RKT, EIX, CVNA, TECK, PBA, ETSY, DISH, DISCA, TFX, PWR, TRGP, AES, W, AMH, IRM, ELAN, UHS, GLPI, CUBE, OVV, FND, LSI, NRG, UTHR, AXON, WSC, PLNT, NVCR, NCLH, COLD, MP, CHE, OGE, AZUL, MTZ, OPEN, NTLA, NTRA, SWCH, FTCH, DOCN, SRCL, SEAS, SWN, NOMD, GTLS, SM, PZZA, CARG, VIR, SIX, ATHM, ALRM, SHOO, BYND, SFM, NKLA, EVTC, FTDR, ERF, MDRX, AXNX, EBS, OPK, NVTA, ATSG, MYGN, CDNA, EGO, LNTH, CENX, EVBG, GDOT, LPSN, VCEL, GLNG, OII, PLYA, ACMR, HSC, TVTY, CARS, RUTH
Economic Reports
None
Happy trading!
Tom