
EB Daily Market Report - Thursday, February 24, 2022
Executive Market Summary
- Futures were annihilated overnight with the Dow Jones down by more than 800 points
- We opened with significant gaps lower, but our major indices have rallied since
- While the Dow Jones remains down 500 points, the NASDAQ has climbed into positive territory
- The disparity could well be linked to the big drop in the 10-year treasury yield this morning, which was down 12 basis point earlier; it's rebounded back to 1.94%, down just 4 basis points
- Meanwhile, the Volatility Index ($VIX) initially opened at 37.50, but is now 33.95, still up 9.5% today
- High volatility means CRAZY trading - likely in both directions
- Moderna (MRNA, +12.96%) is today's best performing S&P 500 stock after reporting quarterly results
- Technology (XLK, +0.37%) is the lone positive sector today, with consumer staples (XLP, -2.90%) the primary laggard
- Financials (XLF, -2.63%) are also having a rough day with the TNX tumbling earlier
Market Outlook
The Volatility Index ($VIX) opened at 37.50 today and our last significant market bottom on January 24th occurred with a VIX near 39. These are VIX levels when we look for possible reversals. The problem is that occasionally we move into the 40s. And if you're off by a day or two in this kind of extreme volatility, you could be down 5% very quickly. My point is that I expect to see anything OTHER THAN a flat market. I believe we're going to see a BIG move, but I'm not sure which way. Below is the S&P 500 with the new WIDE trading range to watch:
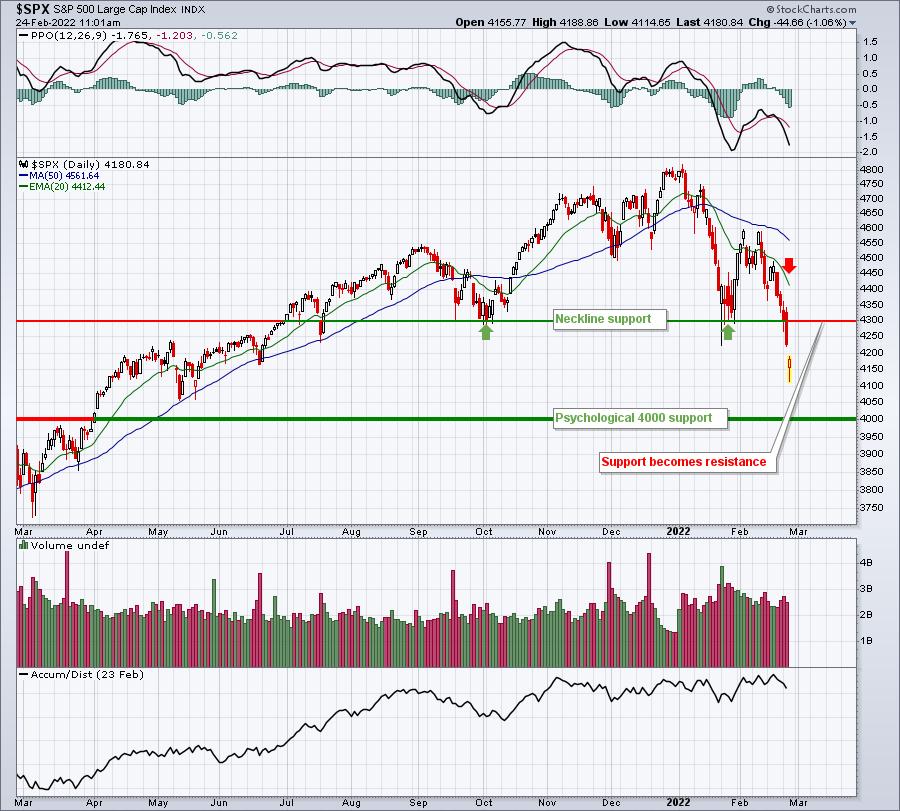
I've been around the block a few times and I've seen neckline support fail to hold as resistance temporarily, but I would definitely expect the now-declining 20-day EMA to serve as key resistance if the bulls are able to negotiate that 4300 level in time.
To the downside, I would expect to see 4000 serve as at least initial psychological support.
Sector/Industry Focus
It's been awhile, but since the opening bell, there's been a tremendous shift back towards consumer discretionary and away from consumer staples. This XLY:XLP ratio has climbed all morning, suggesting that perhaps Wall Street is preparing for a short-term advance. Again, no guarantee, but a move on the S&P 500 back to test the neckline breakdown at 4300 shouldn't be ruled out. Here's the XLY:XLP intraday chart to see the rotation thus far:
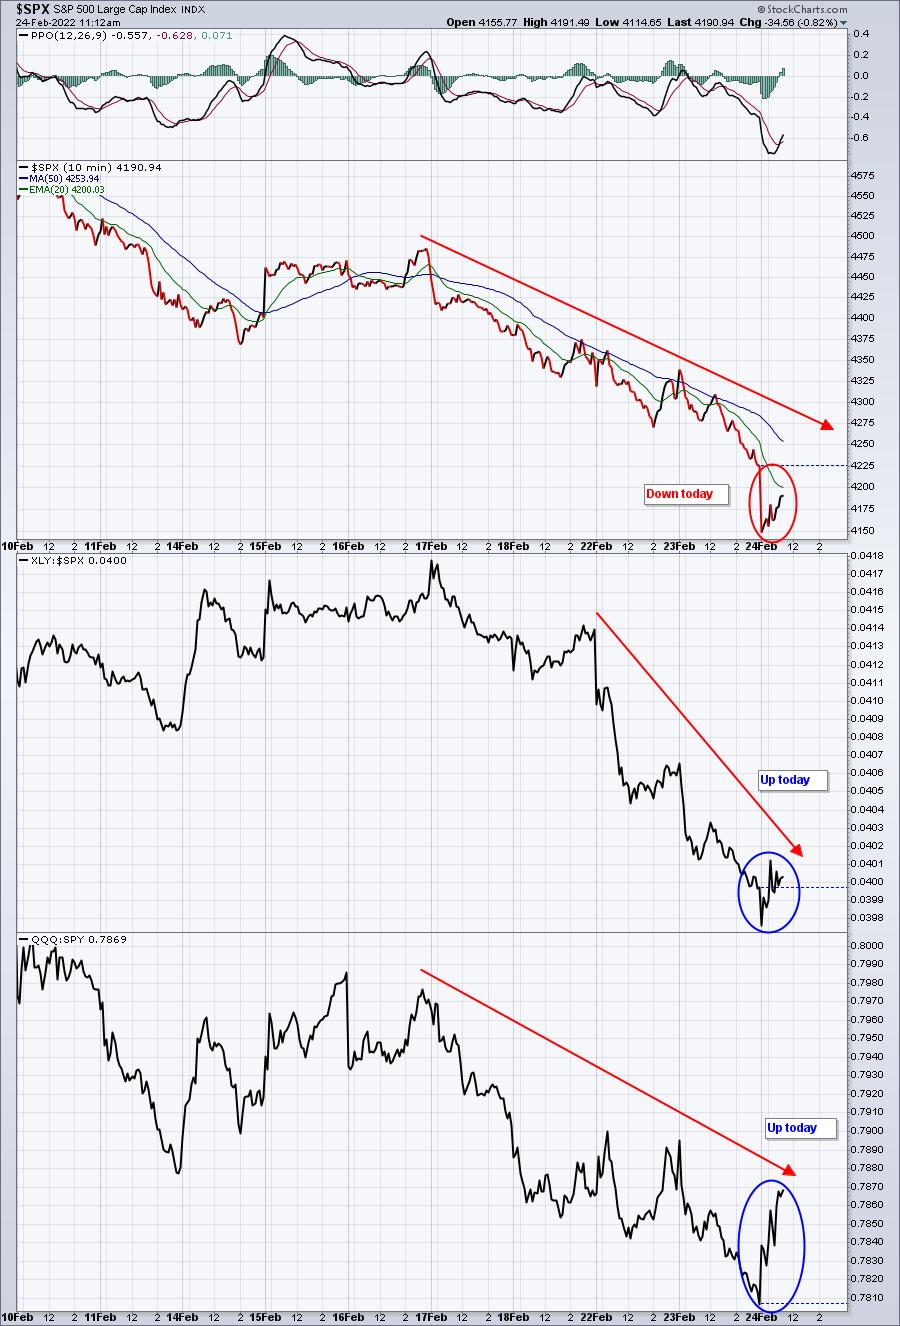
Since the opening bell, the XLY:XLP ratio has outpaced the S&P 500, a good sign. But it's also begun to roll back over while the S&P 500 keeps rebounding. Clearly, the signal is mixed, but to truly sustain this near-term rally off today's low, I'd want to see this XLY:XLP ratio turn higher again.
It's also worth noting that the QQQ:SPY ratio has been climbing all day. The QQQ is much more aggressive than its SPY counterpart, so it tells us that the bulls are at least dipping their toes in the water. They've got to start somewhere. We know, however, that the morning is "amateur hour" and many times we see much different stories in the afternoon. Is this a short-term bottom? I believe it depends on how we trade this afternoon and where we close.
ChartLists/Strategies
Yesterday, I said I believed we'd break down, the VIX would spike, and the stock market would get crushed. At 2:00pm ET on Wednesday, the S&P 500 was roughly 4270. Shortly after the opening bell today, the S&P 500 was at 4114. That was close to 4% in less than 24 hours. These are the types of moves we can see when the VIX expands - and these moves can be in either direction. At last check, the S&P 500 had gained close to 2% from this morning's low to the intraday high established near 10:15am ET.
Expect a very wild ride. Trade with caution and with fewer shares. That's what I'll do if I trade individual stocks. Right now, the only individual trade I am in is the GLD. And that's volatile too!
I'm not suggesting trade candidates, because it's simply too risky. I believe in protecting capital. I will say this, however. There's no guarantee how low we'll go in this cyclical bear market - or even that we go lower at all. I believe we will and perhaps another 10-15% below this morning's S&P 500 low is what I'm expecting. If you're interested in buying high quality growth stocks for the long-term, though, buying them in increments during weakness is probably not a bad strategy at all. Companies like Apple (AAPL), Microsoft (MSFT), and Tesla (TSLA) immediately come to mind. You may have your own favorites.
Earnings Reports
Here are the key earnings reports for the next two days, featuring stocks with market caps of more than $10 billion. I also include a few select companies with market caps below $10 billion. Finally, any portfolio stocks that will be reporting results are highlighted in BOLD. If you decide to hold a stock into earnings, please understand the significant short-term risk that you are taking. Please be sure to check for earnings dates for any companies you own or are considering owning.
Thursday, February 24:
BABA, RY, INTU, AMT, NTES, EOG, MRNA, KDP, NEM, VMW, ADSK, SQ, DELL, AEP, MNST, COIN, OXY, ZS, CBRE, PEG, LNG, RKT, EIX, CVNA, TECK, PBA, ETSY, DISH, DISCA, TFX, PWR, TRGP, AES, W, AMH, IRM, ELAN, UHS, GLPI, CUBE, OVV, FND, LSI, NRG, UTHR, AXON, WSC, PLNT, NVCR, NCLH, COLD, MP, CHE, OGE, AZUL, MTZ, OPEN, NTLA, NTRA, SWCH, FTCH, DOCN, SRCL, SEAS, SWN, NOMD, GTLS, SM, PZZA, CARG, VIR, SIX, ATHM, ALRM, SHOO, BYND, SFM, NKLA, EVTC, FTDR, ERF, MDRX, AXNX, EBS, OPK, NVTA, ATSG, MYGN, CDNA, EGO, LNTH, CENX, EVBG, GDOT, LPSN, VCEL, GLNG, OII, PLYA, ACMR, HSC, TVTY, CARS, RUTH
Friday, February 25:
CM, SRE, LI, IEP, EVRG, LAMR, VST, FL, CRI, GTN, SSP, GVA, NOG, TREE, IMGN
Economic Reports
Q4 GDP (2nd Estimate): 7.0% (actual) vs. 7.0% (estimate)
Initial jobless claims: 232,000 (actual) vs. 231,000 (estimate)
January new home sales: 801,000 (actual) vs. 804,000 (estimate)
Happy trading!
Tom