
EB Daily Market Report - Friday, February 25, 2022
This Special Report is in lieu of today's Daily Market Report as I'll be out most of the day.
The Bulls' Argument
I believe this cyclical bear market still has much work to do. But it's not likely to be a straight line lower. They rarely are. You have bouts of impulsive selling, followed by crazy rallies. And then we see "rinse and repeat", until the final bottom is carved out. There are no guarantees of further selling, just as there are no guarantees yesterday's panicked open marks the bottom. It's all about the risk you're willing to take and we are in an incredibly risky environment. Both sides can probably agree on that. I really believe we need more bearishness to truly set things up for a sustainable rally later this year. But if I was on a debate team and I had to give my best-case argument for the bottom being in and a big rally ahead, this is what I'd say:
- More bearish readings on the equity only put call ratio ($CPCE) have marked a bottom
- Yesterday saw HUGE volume to confirm reversing candlesticks (bullish piercing/engulfing)
- Positive divergence in play on the daily charts
- Head & shoulders breakdown did not confirm with appropriate volume, negating the measurement to 3800
- Another VIX reading in the upper 30s, where major bottoms typically form
- Time of the calendar month - Monday is Feb 28 and Tuesday is Mar 1; the 26th to 6th is the best time historically for U.S. stocks (based on S&P 500 performance since 1950)
- Fundamentally, still very low rates historically and earnings have been relatively strong
- Growth stocks have been pulverized and are in need of a big relief rally
Here are the two charts to point out the (1) positive divergence and reversing candle, and (2) the rising 5-day moving average of the $CPCE.
S&P 500:
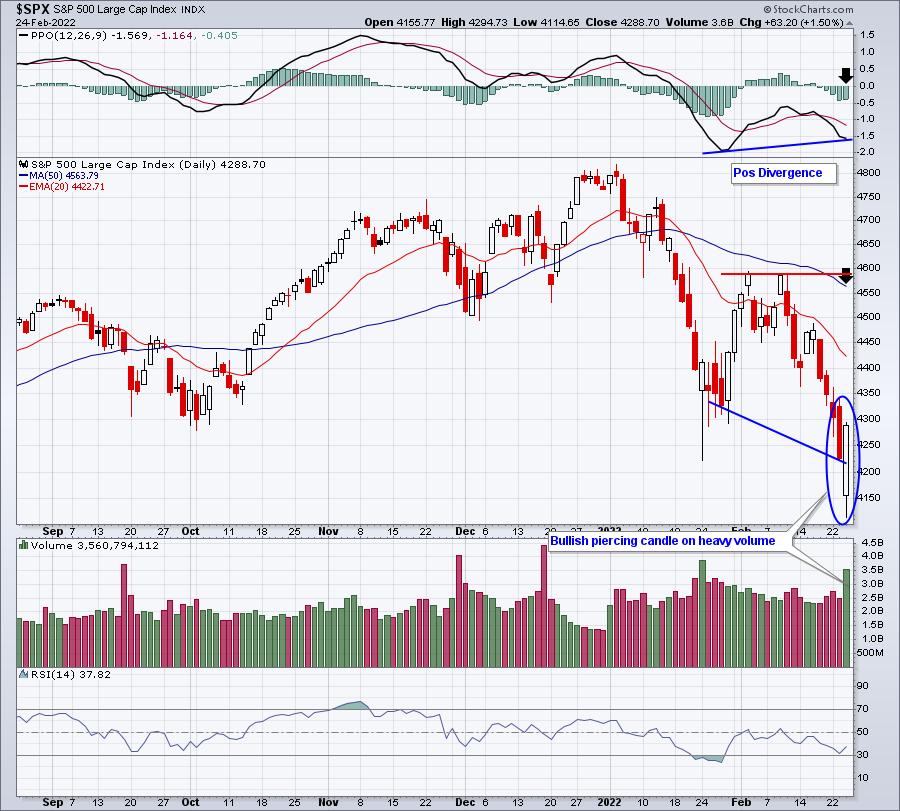
Technical evidence definitely points to a continuation of yesterday's rally. But how far will it go? A technical argument can be made that this rally goes all the way back to the 50-day SMA to reset the PPO at its centerline, while potentially seeing that 50-day SMA test (black arrows).
CPCE:
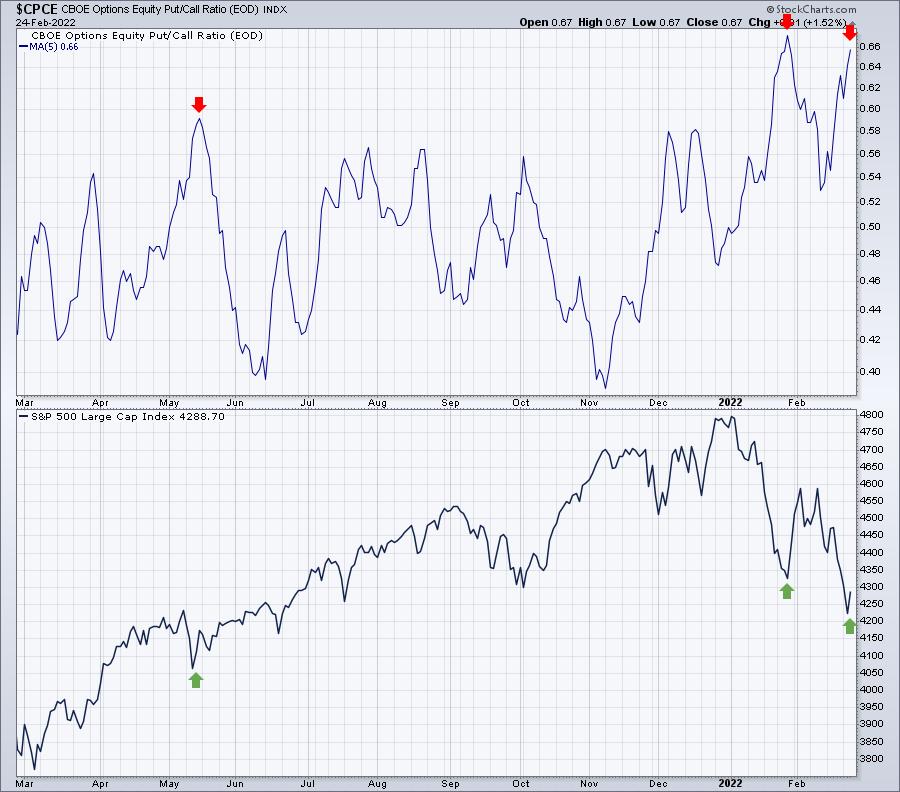
In the current secular bull market, 5-day SMA readings of the CPCE well above .60 suggests extreme bearishness, where rallies typically begin.
The Bears' Rebuttal
Now I'll handle the bears' response:
The action on Thursday, while extremely bullish, does not change the cyclical bear market one bit. The bulls have a lot more work to do to convince me that the bottom is in. They have now put two key checkmarks in their column - the first was the head & shoulders breakdown on moderate volume (rather than heavy volume). The second was the massive and stunning recovery after the large gap lower on Thursday morning. The opening level on our key indices now becomes critical short-term price support, while neckline resistance and declining 20-day EMAs will become resistance.
Let me reiterate that when the Volatility Index ($VIX) reaches the mid- to upper-30s, wild action is almost certain to take place. And I have stressed that this crazy market action is likely to occur in both directions. The huge reversal on January 24th occurred with the VIX above 39. Thursday's huge reversal occurred with the VIX approaching 38. I've said in the past that the stock market is like a rubber band that is stretched beyond belief when the VIX reaches these heights. It typically snaps back hard and that's what we've seen twice now in the past month. Here's a quick look at it:
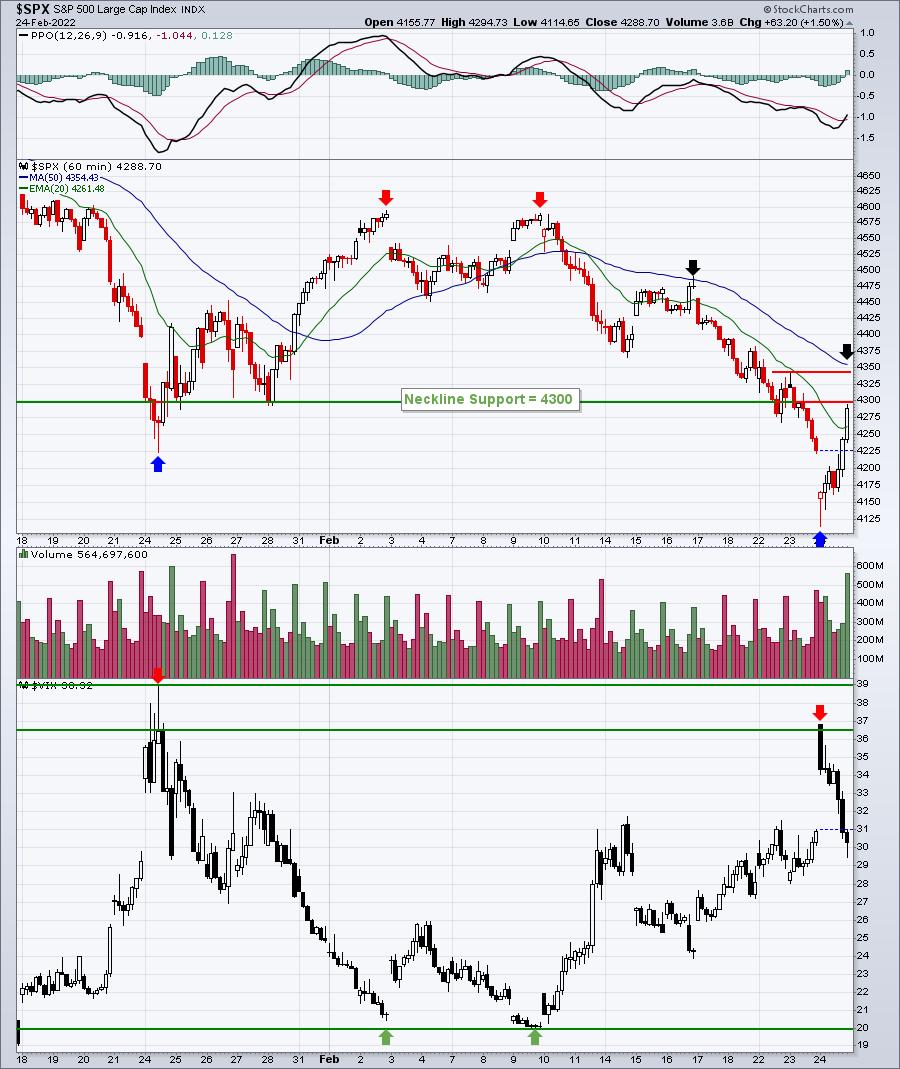
The VIX in the upper 30s has been marking S&P 500 bottoms, while the VIX near 20 has been marking S&P 500 tops. From my experience, we should "expect the unexpected" when the VIX is this elevated.
History of Bear Market Snap-Back Rallies
Let's look at history to further enhance the bearish argument.
In our "Anatomy of a Cyclical Bear Market" webinar on Saturday, February 12th, I highlighted what a cyclical bear market looks like on a 10-year weekly chart. If you recall, I broke down the S&P 500 by decade and highlighted the cyclical bear market declines in each decade.
Today I'm going to zero in on the daily chart of each of the key cyclical bear markets since 1950 with a brief commentary on each. Be sure to check out the "snap-back" rallies that can occur multiple times throughout cyclical bear markets.
1962 Bear Market:
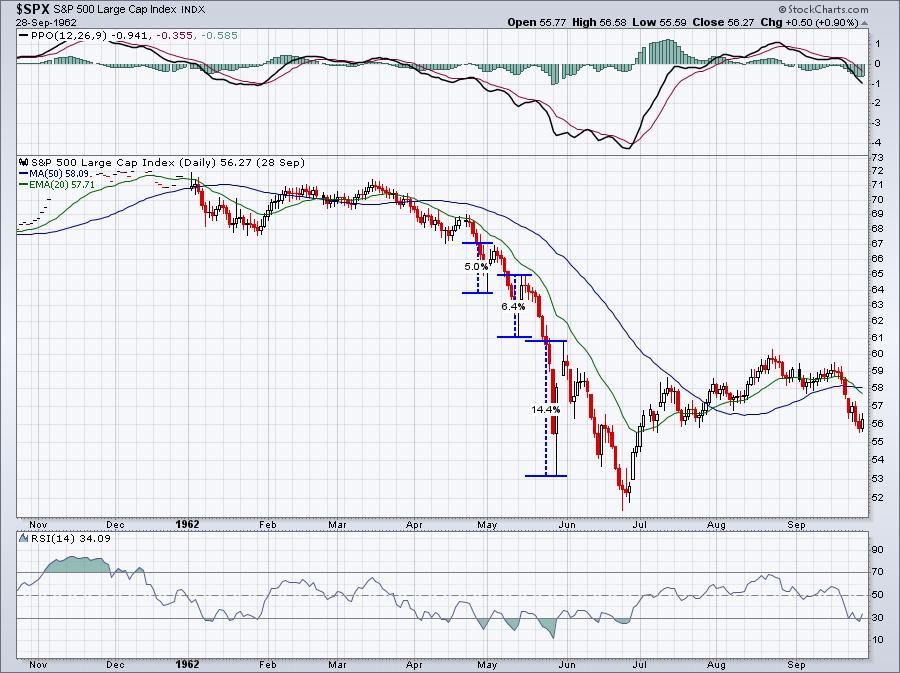
In particular, check out the rally in late May. Look familiar? A little bit like yesterday's bullish piercing candle? It had one more day of glory before reality set back in with another 15% or so decline over the next 3-4 weeks.
1966 Bear Market:
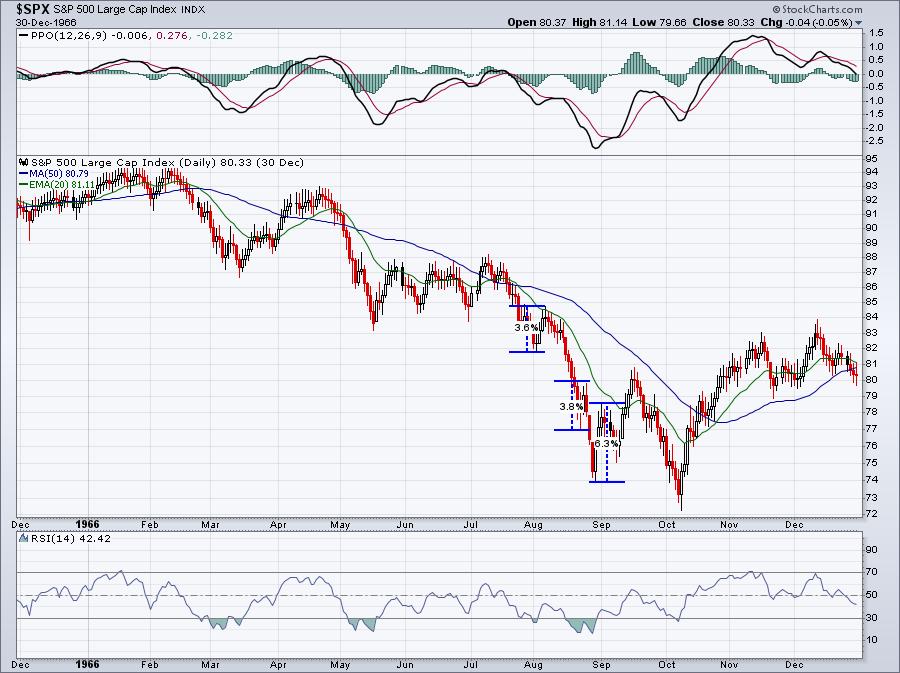
Short-term rallies from 4-6% very typical.
1987 Bear Market:
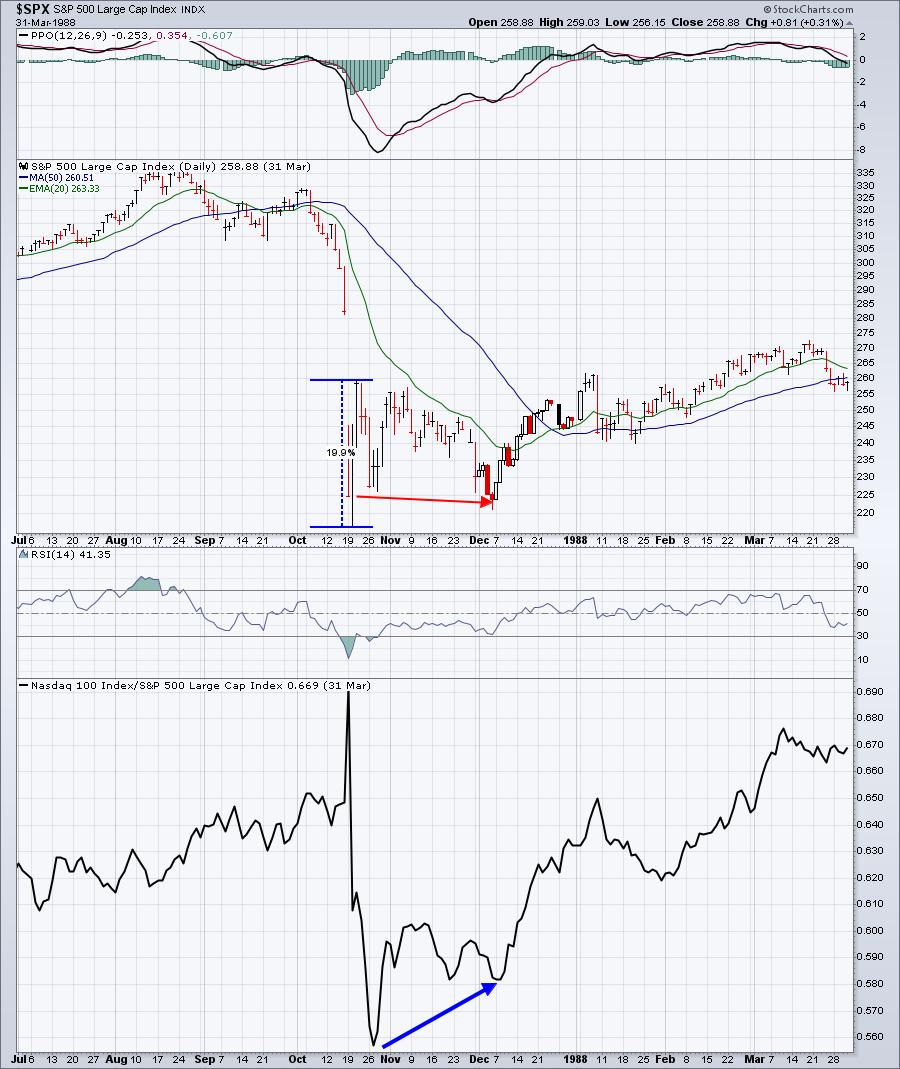
The 1987 cyclical bear market was very swift and didn't really go down in stages. But you can clearly see one massive initial bounce after crazy, impulsive selling took place. I also added a bottom panel to the rest of the charts I'm going to show you, tracking the more aggressive index (NASDAQ) vs. the more defensive index (S&P 500). Note that in printing a double bottom, money rotated into the more aggressive stocks, a bullish development that ultimately helped to mark the bottom.
1990 Bear Market
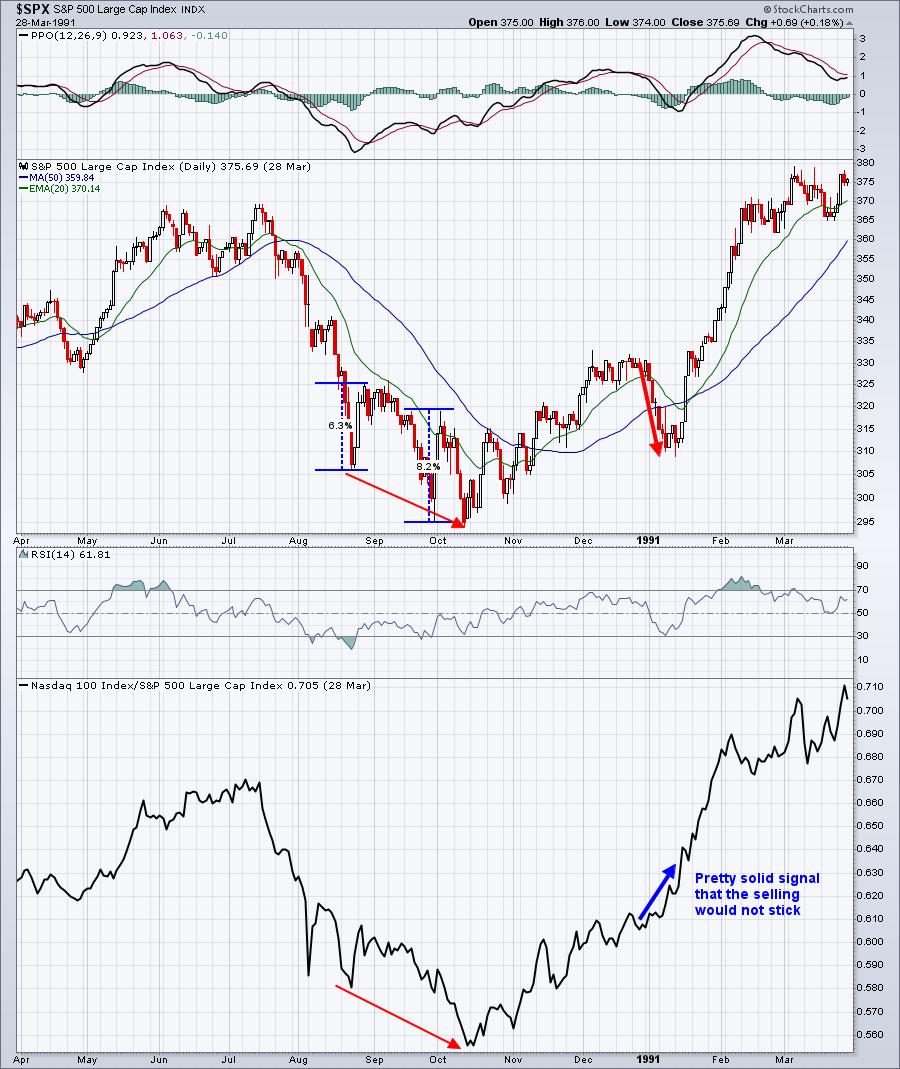
1990 saw two significant rallies to follow bouts of impulsive selling. 6-8% rallies over just a few days is something to be aware of and even expect during cyclical bear markets. The elevated VIX readings mark the short-term bottoms and then rallies happen. Trying to figure out which one is the last one is the difficult part.
1998 Bear Market
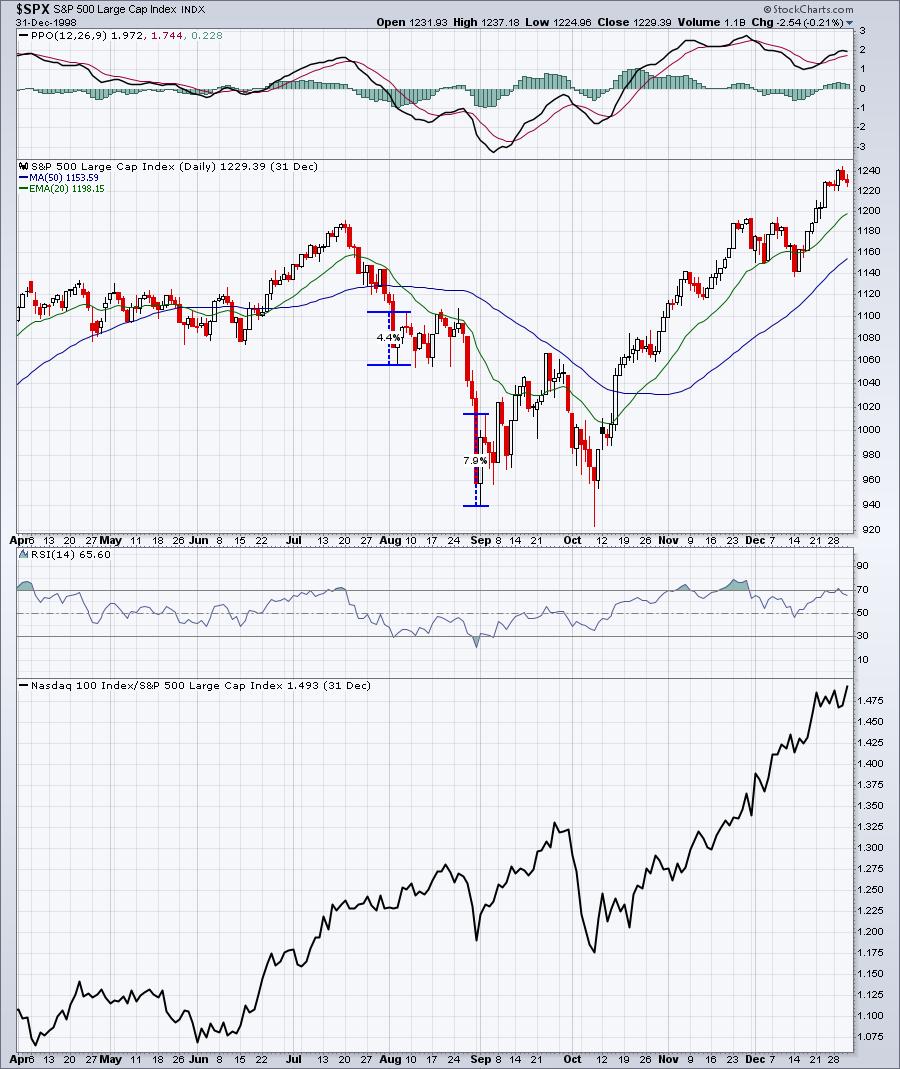
Again, we saw a nearly 8% rally in just two days before we ran into a lot of choppiness. The bottom NASDAQ:S&P 500 ratio did continue to print higher relative highs throughout this cyclical bear market, but the selloffs were terrifying among those high growth stocks.
2018 Bear Market
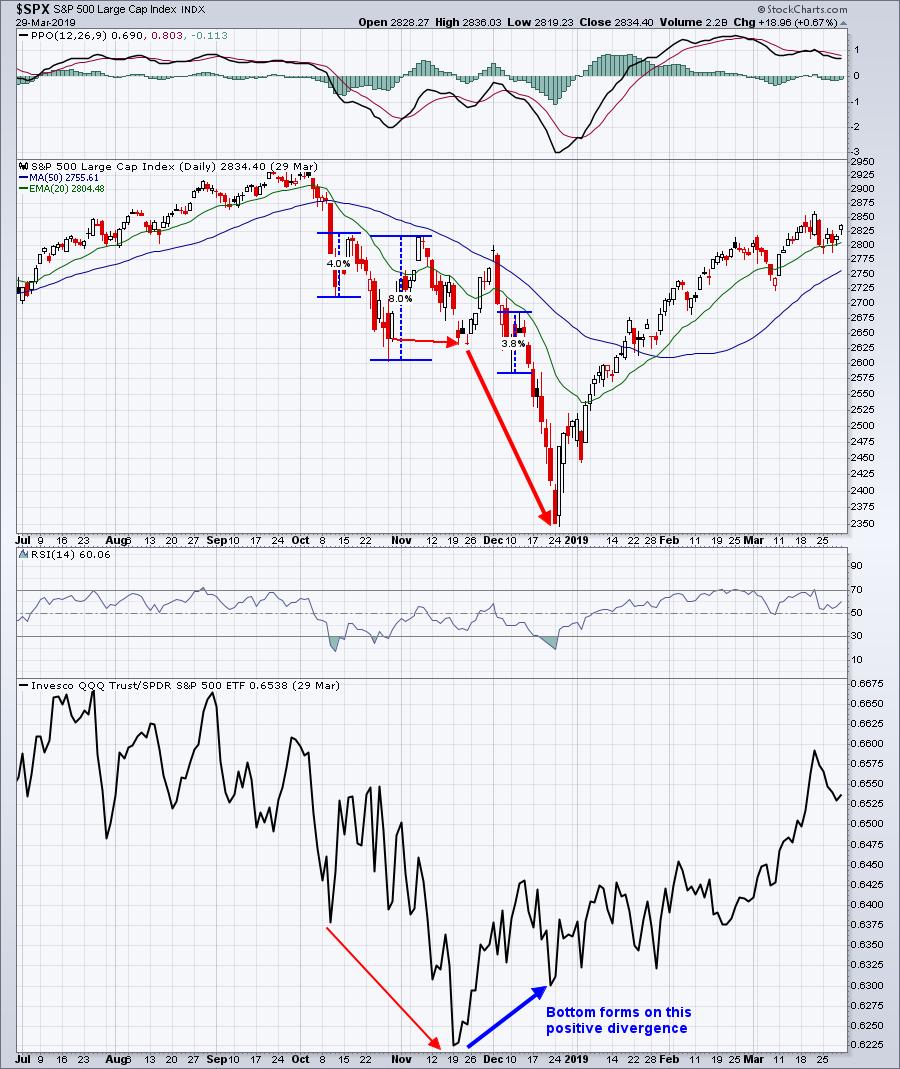
Again, multiple rallies in the 4-8% range, but all within the defined downtrend. The bottom here was quite interesting, however, as the QQQ:SPY ratio bottomed before the price action. This is the type of signal I'd LOVE to see in 2022. I have no idea if it will happen, but it's something I'll be looking for.
2022 Bear Market
So that brings us to today, Friday, February 25th, 2022. What has history taught us as we look at the current cyclical bear market (at least that's what I believe we're in):
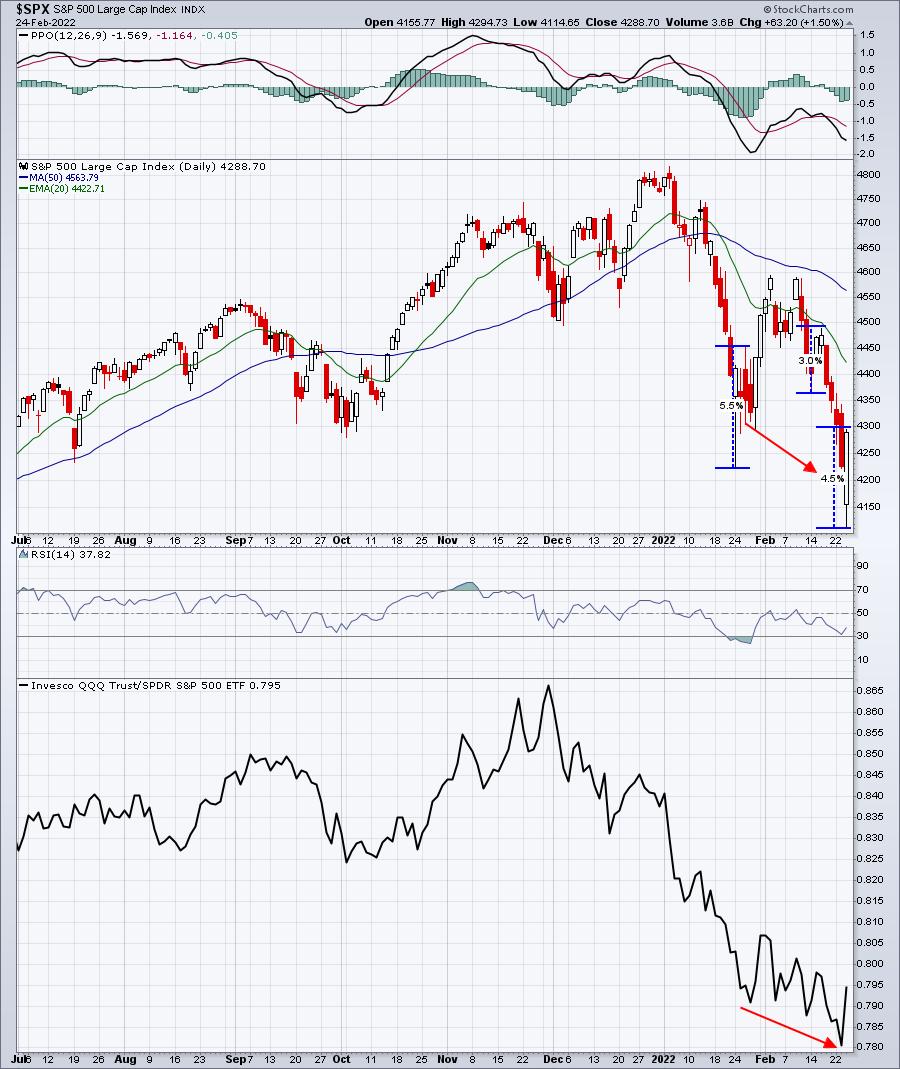
I know yesterday felt so very bullish. But as you look at the chart and consider what other cyclical bear markets have looked like, is this anything different. Our rally yesterday off the low was roughly 4.5%. Do we perhaps see 7-8%? Sure, it could happen. But don't you feel a little different now about the odds of this rally continuing? Positive divergences are nice and reversing candles definitely confirm them, but is this a guarantee of a continuing rally that takes us back to all-time highs?
I don't think so. But I wanted to provide all of you with this information, so that you can make informed decisions about what you want to do with your money. I would be very careful about reacting to yesterday's action, because history tells us that we can see plenty of head fakes along the way. If I'm right about a cyclical bear market - and I may not be - then this rally will end almost as soon as it began.
Please continue to exercise an abundance of caution right now. If you're building positions for the long-term, I honestly can't blame you with many companies on sale right now. But prices could get cheaper in a hurry. From a trading perspective, I HATE the whipsaw action. My plan is to slowly build inverse ETF positions like the QID (double the inverse of the NASDAQ) and/or SDS (double the inverse of the S&P 500) on further strength, but that may not be appropriate for others.
I hope all of this helps, though it may simply muddy the waters further.
Happy trading!
Tom