
EB Daily Market Report - Tuesday, March 1, 2022
ChartList Updated
The Short Squeeze ChartList (SSCL) has been updated, though it may be later today before it's updated on our website. I'm in the process of updating a few other ChartLists such as the:
- Strong Earnings ChartList (SECL)
- Strong Future Earnings ChartList (SFECL)
- Raised Guidance ChartList (RGCL)
Once these are completed, I'll let you know right here in the DMR.
Executive Market Summary
- Futures were lower overnight, but our key indices did manage to move into positive territory early in the session
- Sellers regained control from there, however, and we've seen mostly negative action intraday
- The 10-year treasury yield ($TNX) tumbled 13 basis points to 1.71%, which has really pressured financials
- Financials (XLF, -3.50%) is the worst performing sector today, though 10 of 11 are negative
- Energy (XLE, +0.86%) is the only sector gaining ground after crude oil ($WTIC, +8.85%) surged to $104 per barrel
- Gold ($GOLD, +2.18%) also surged, looking to close at its 52-week high today
- Banks ($DJUSBK, -4.75%) are under tremendous selling pressure with the falling treasury yields
- Technology (XLK, -2.18%) is also struggling as semiconductors ($DJUSSC, -3.97%) come under big selling pressure as well
Market Outlook
When I first began studying the historical performance of the stock market, I expected that there'd be a bullish bias right at the beginning of calendar months. I believed this because of my days working in public accounting. When we would audit clients, I realized that most of our clients had payrolls that coincided with the beginning of the month and the middle of the month. Most clients has payrolls twice a month that typically had pay dates of the 31st and 15th or 1st and 15th, that type of thing. Of course, the popularity of 401(k) plans has grown a ton over the years. So I always wondered how all of that money flow coming from 401(k) plans impacted stock market performance. It was very interesting, to say the least. Check out the performance of the 31st, 1st, and 2nd days of every calendar month since 1950:
- 31st: +26.88%
- 1st: +45.96%
- 2nd: +39.21%
The 5th calendar day has produced the third best return at 31.54%. The 16th calendar day (think 2nd payroll) has produced the fourth best return at 30.44%. The 31st is then in fifth place. The money flows have a tremendous impact on performance, as I had suspected.
Now please don't misconstrue any of this. We don't see positive days on the 31st, 1st, 2nd, and 16th every month. But the tendency is greater, which is very meaningful to a short-term trader. The chance of the S&P 500 moving higher on any day since 1950 is roughly 53.5%. The chance of the S&P 500 moving higher on one of the calendar days mentioned above is as follows:
- 31st: 56.69% (6th highest of any calendar day - the 3rd and 5th have both gone higher a bit more frequently)
- 1st: 61.97% (highest of any calendar day)
- 2nd: 59.73% (2nd highest of any calendar day)
- 16th: 57.24% (3rd highest of any calendar day)
You're welcome to come to your own conclusions, but my conclusion is that money flow makes a very significant difference in performance throughout the calendar month.
Sector/Industry Focus
In my Trading Places LIVE show this morning at StockCharts.com, I may have sounded as though I'm wavering a bit regarding this current cyclical bear market. I AM wavering a bit. I was not expecting the 10-year treasury yield ($TNX) to fall like it has and that has given earlier life to growth stocks than I was expecting. I still believe we go lower, but I'm not convinced that growth stocks will lead on the way down like they did throughout much of January and February. And honestly, if we go down one more time and growth stocks are spared relative to their value stock counterparts, I'd view that as a very buyable bottom.
Here's an intraday chart of the S&P 500 with a couple of my favorite ratios on it. As the S&P 500 has rolled over, growth stocks have performed solidly on a relative basis:
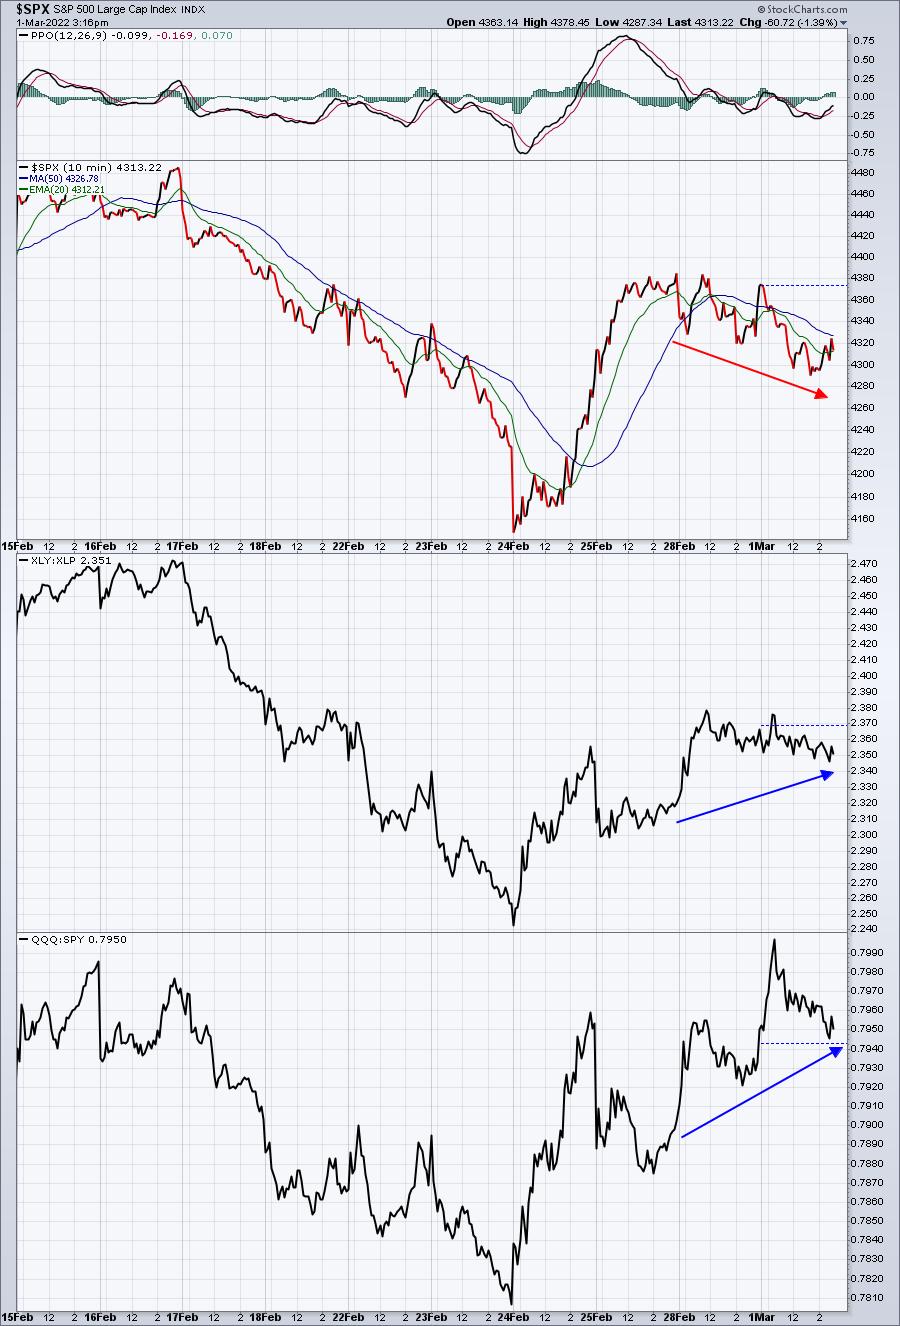
I don't want to point to one day's action and try to make a HUGE intermediate- to long-term call, but today's behavior is EXACTLY the type of behavior that we want to see when the S&P 500 prints its final bottom.
I really want to see this rotation continue, especially if we see a trip on the S&P 500 down to 3500-3800.
ChartLists/Strategies
The following charts represent what I'd be looking for in order to place trades on the short side, in hopes that they move lower:
SAGE:
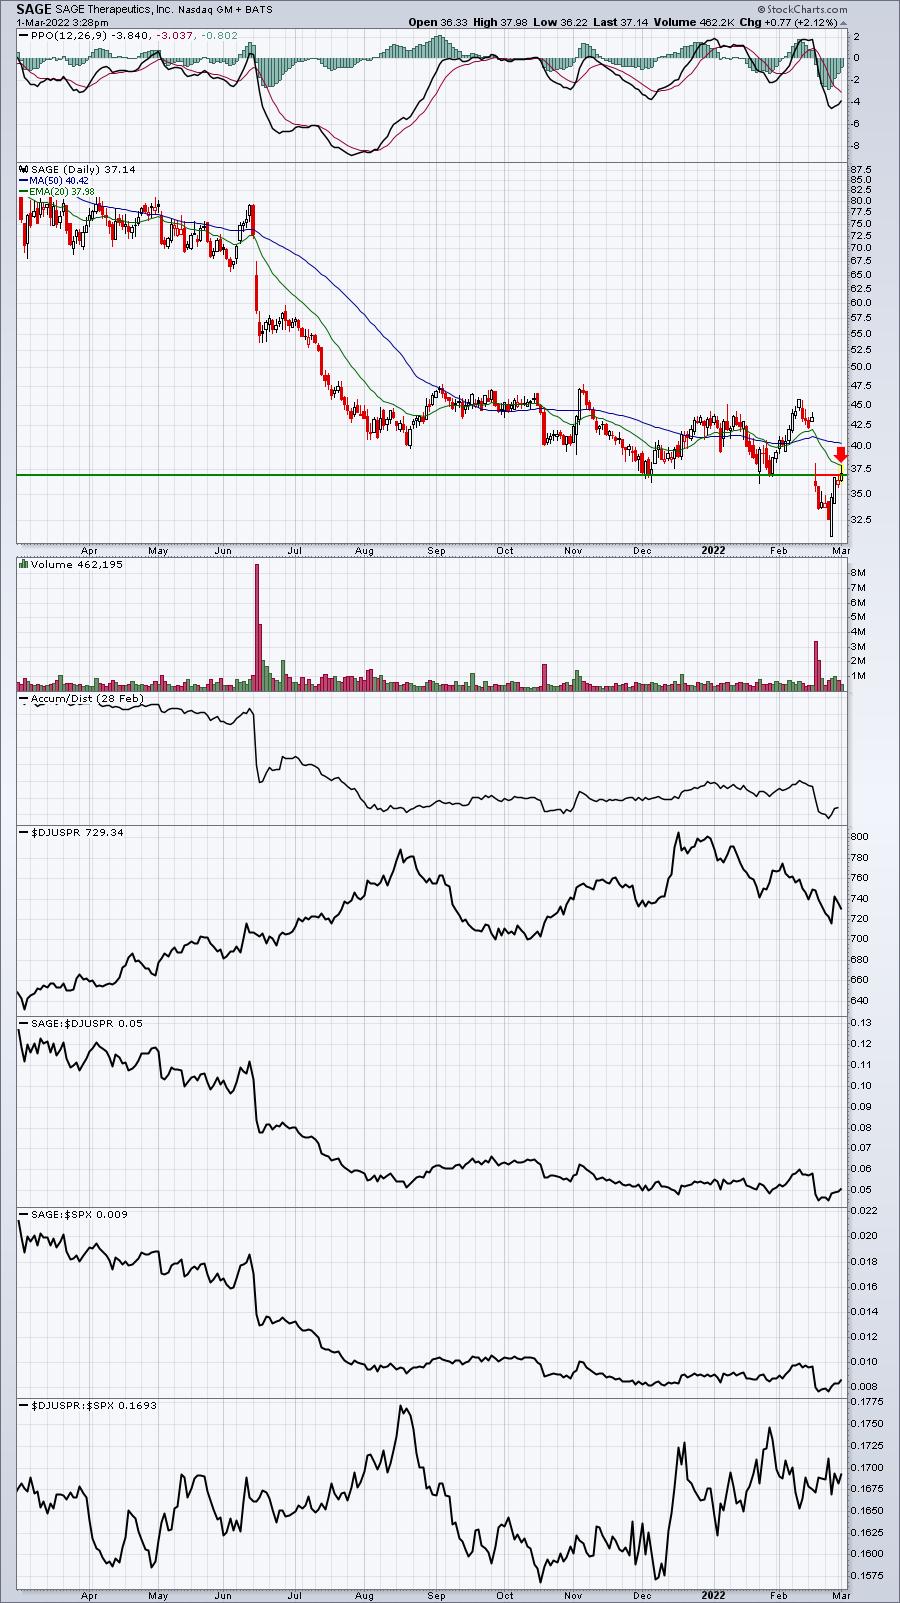
Key price resistance is currently being tested and there was an earlier failure at the 20-day EMA. I'd be sure to keep a fairly tight stop above that 20-day EMA, perhaps any intraday move above today's high.
Earnings Reports
Here are the key earnings reports for the next two days, featuring stocks with market caps of more than $10 billion. I also include a few select companies with market caps below $10 billion. Finally, any portfolio stocks that will be reporting results are highlighted in BOLD. If you decide to hold a stock into earnings, please understand the significant short-term risk that you are taking. Please be sure to check for earnings dates for any companies you own or are considering owning.
Tuesday, March 1:
CRM, TGT, BNS, BMO, SE, BIDU, AZO, ROST, EC, HRL, HPE, HZNP, DPZ, SJM, BLDR, BSY, CLVT, AMC, SOFI, KSS, FSLR, SRPT, IGT, HGV, ADT, SGMS, WEN, MLCO, PRGO, CELH, FOUR, JWN, IQ, TWNK, KTB, URBN, ZIP, REGI, EVERI, XHR, CDLX, NSTG, AVID, TGTX, AMRN
Wednesday, March 2:
SNOW, CPNG, VEEV, DLTR, OKTA, SPLK, PSTG, DCI, NTNX, VSCO, BOX, AEO, PDCO, AI, ANF, ZUO
Economic Reports
February PMI manufacturing: 57.3 (actual) vs. 57.5 (estimate)
February ISM manufacturing: 58.6 (actual) vs. 58.0 (estimate)
January construction spending: +1.3% (actual) vs. -0.2% (estimate)
Happy trading!
Tom