
EB Daily Market Report - Wednesday, March 2, 2022
ChartLists Updated
The following ChartLists have been updated today and either have been updated on the website or will be later today:
- Strong Earnings ChartList (SECL)
- Strong Future Earnings ChartList (SFECL)
I should have the Raised Guidance ChartList (RGCL) updated on Friday.
Executive Market Summary
- Futures were mostly higher overnight, but we did see back and forth action
- The NASDAQ 100 has underperformed all day, but it has rallied on a relative basis since about 11:00am ET; it's important to continue this - more on this ratio below
- The big story continues to be the surge in crude oil prices ($WTIC, +8.26%), up another $8.50 today to $112 per barrel
- Other commodities are mixed, though copper ($COPPER) is higher by 1.58%
- The 10-year treasury yield ($TNX) has rebounded strongly, jumping 15 basis points to 1.86% after a strong jobs report
- The February ADP Employment Report came in at 475,000, nearly 50% higher than the expected 320,000
- All 11 sectors are higher today, led by energy (XLE, +2.97%) and financials (XLF, +2.75%)
- Financials are seeing relief from the rise in treasury yields; insurance and banks are performing well
Market Outlook
I show the relative performance of the NASDAQ 100 ($NDX), or QQQ, vs. the benchmark S&P 500 ($SPX), or SPY, quite often, because it's a measure of whether the stock market is in a "risk-on" or "risk-off" mode. When the QQQ:SPY ratio is rising, it's typically a pretty good sign that traders have an appetite for risk and it's this appetite that drives equity prices higher. That's why I refer to it as a "sustainability" ratio. I prefer a rising market with a rising QQQ:SPY ratio. Secular bull markets, historically, have seen the more aggressive NASDAQ double the return of the S&P 500. Here's the current longer-term view of this ratio, followed by the short-term:
5-year weekly chart:
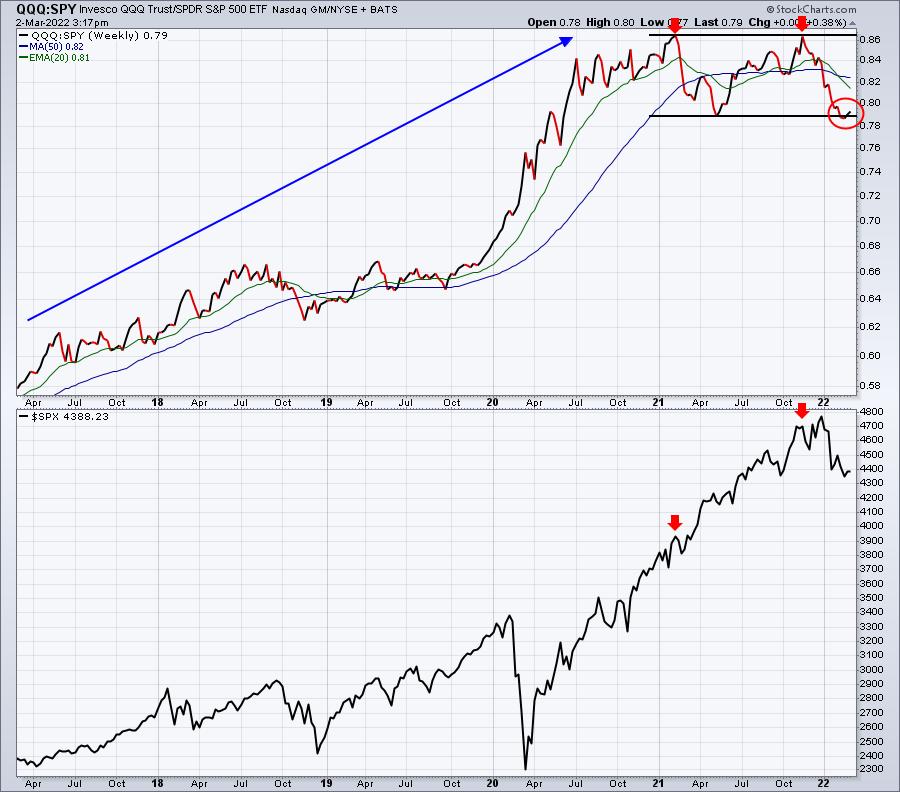
The red arrows highlight the S&P 500 going much, much higher, but with the QQQ:SPY ratio failing to break out to confirm that the rally was sustainable. More recently, the QQQ:SPY ratio appeared to have failed to hold key support, but only briefly. Another move lower in this ratio would be very bearish for equities short-term.
3-month hourly chart:
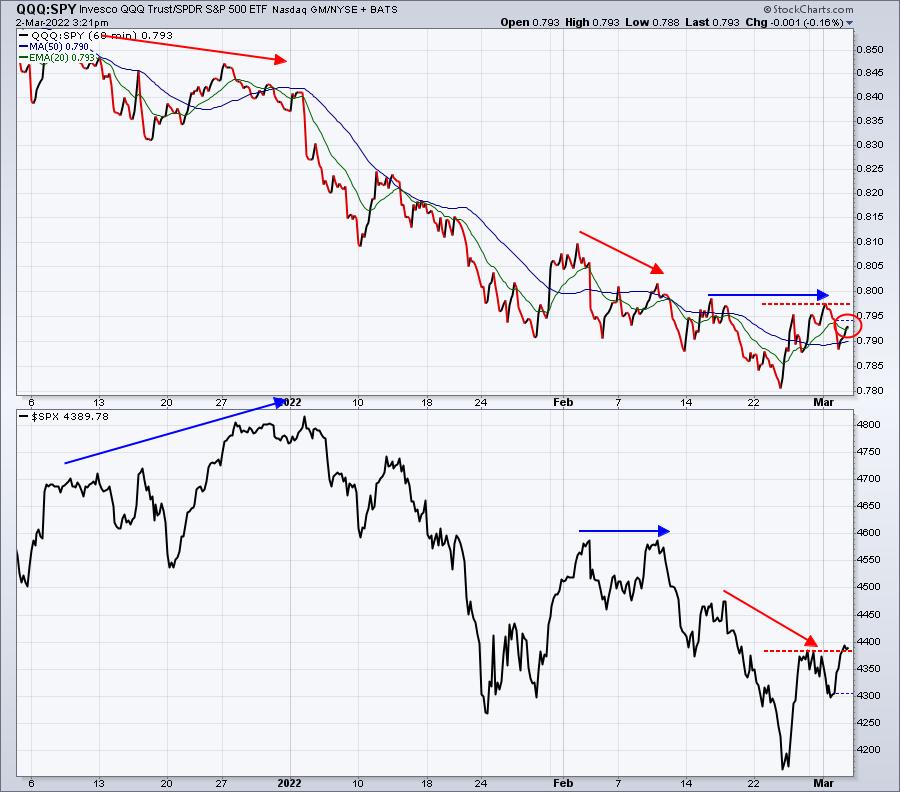
I think when you look at this chart, you can see the problems that the S&P 500 had on rally attempts. The red directional lines show the QQQ:SPY ratio declining, while the blue directional lines show the S&P 500 rising. That's a big problem. Currently, we're seeing mixed signals. I like the latest relative rally on the QQQ:SPY ratio while the S&P 500 was declining. However, on this latest push higher on the S&P 500, the QQQ:SPY ratio has been unable to set a new high. So while we could see a further push higher in the very near-term, I believe we'll need to see a much stronger QQQ:SPY relative line to confirm that recent strength is sustainable.
Sector/Industry Focus
The relative strength or weakness of utilities (XLU) can give us a very general sense of the stock market's attitude. Any time we run into troubles in the stock market, money typically rotates into the XLU, because of its safety. Over time, it is not a very good performer at all - especially in a secular bull market. But when fear escalates and the S&P 500 chops or declines, we usually see money rotating into the XLU. This relative ratio (XLU:$SPX) has been climbing since November and another breakout would not be a great signal for U.S. equities:
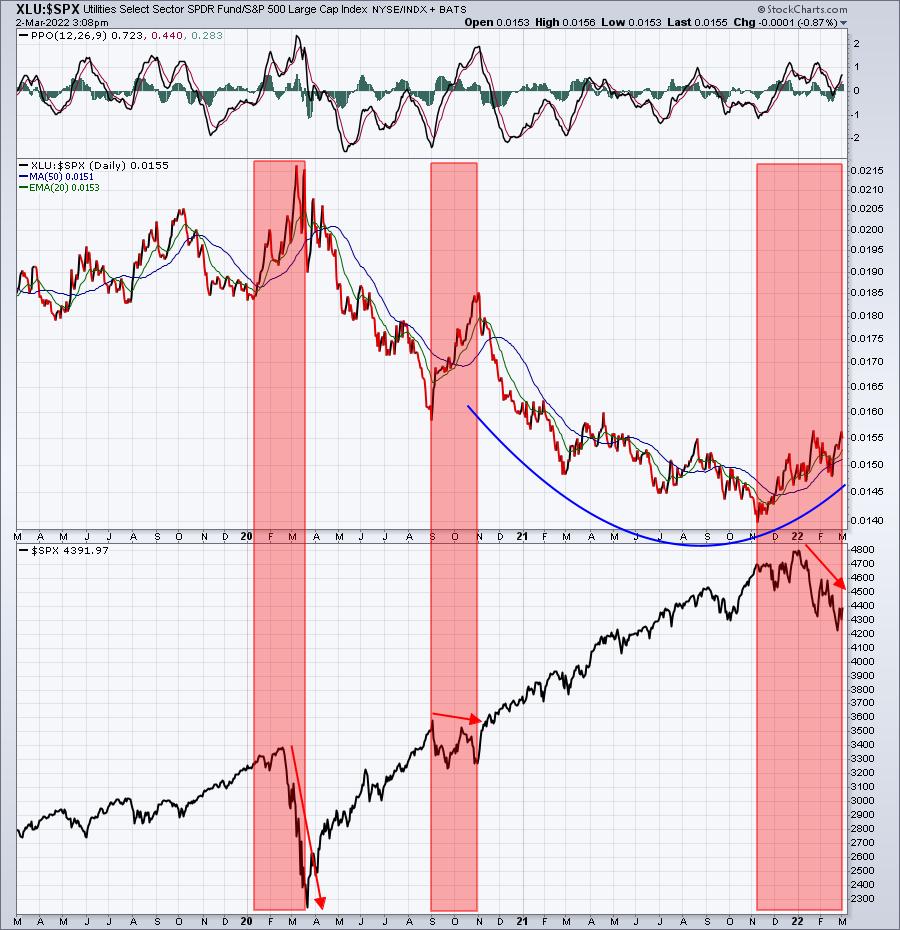
Again, it's just one signal, but the relative PPO is positive for the first time since the early stages of the COVID pandemic. While I rarely invest in utilities, I do like to keep this ratio on my radar and check it out from time to time.
ChartLists/Strategies
I think most everyone can agree that Apple (AAPL) is quite significant to the overall market, so let's break this chart down to see the levels that we most need to keep a close eye on:
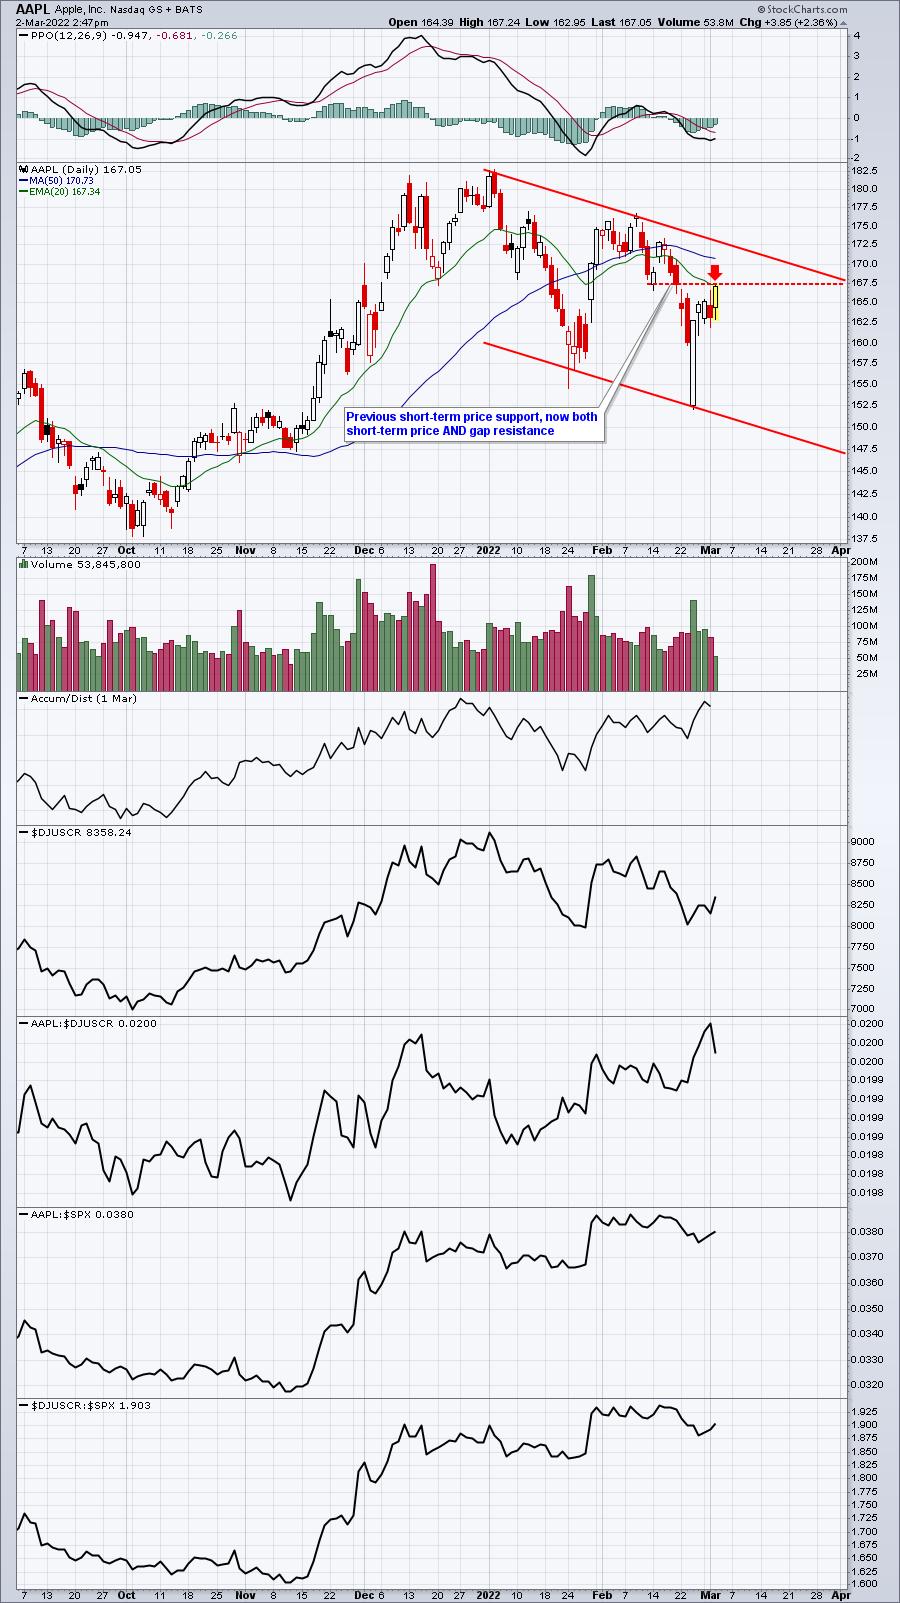
AAPL remains quite strong vs. its peers and vs. the benchmark S&P 500. It has single-handedly been helping to keep the S&P 500 afloat and a close back above its declining 20-day EMA would aid the benchmark even further. Therefore, today's close is important from a short-term perspective. If the 20-day EMA is cleared, then I'd be looking for a possible trip to test the upper downtrend line in its current channel. Potentially, that could be another 2-3%.
Earnings Reports
Here are the key earnings reports for the next two days, featuring stocks with market caps of more than $10 billion. I also include a few select companies with market caps below $10 billion. Finally, any portfolio stocks that will be reporting results are highlighted in BOLD. If you decide to hold a stock into earnings, please understand the significant short-term risk that you are taking. Please be sure to check for earnings dates for any companies you own or are considering owning.
Wednesday, March 2:
SNOW, CPNG, VEEV, DLTR, OKTA, SPLK, PSTG, DCI, NTNX, VSCO, BOX, AEO, PDCO, AI, ANF, ZUO
Thursday, March 3:
AVGO, COST, TD, CNQ, MRVL, KR, BF/B, BBY, GRAB, COO, BURL, ARGX, BILI, TTC, BJ, ESTC, WB, GPS, UTZ, AVAV, MEI, GOGO, MTLS, BIG, TGLS
Economic Reports
February ADP employment report: 475,000 (actual) vs. 320,000 (estimate)
Beige book released at 2:00pm ET
Happy trading!
Tom