
EB Daily Market Report - Friday, March 4, 2022
Executive Market Summary
- Futures were down overnight with reports of a Russian attack on a Ukrainian nuclear plant
- Despite a very strong nonfarm payrolls report this morning, down futures accelerated and traders have been in a bearish mood all morning thus far
- The bond market reaction to that strong jobs report has been to BUY bonds, resulting in another huge 13-basis point drop in treasury yields ($TNX) to 1.71%
- The market behavior certainly smells like the "R" word I've been talking about (Recession); the bond and stock markets "predict" recessions, they don't wait to see them
- Financials (XLF, -2.56%), consumer discretionary (XLY, -2.45%), and technology (XLK, -2.28%) are being hit the hardest today
- Meanwhile, energy (XLE, +1.17%) and utilities (XLU, +0.81%) are the only 2 sectors in positive territory today
- Banks ($DJUSBK, -3.97%) are very weak given the big drop in the TNX; crude oil ($WTIC, +3.63%) is up to $112 per barrel, lifting energy stocks
- Gold ($GOLD, +1.28%) is jumping again as fear elevates; the VIX is back above 34 and up 12.60% today
- All 29 industry groups in technology and consumer discretionary are lower, led by continuing weakness in software ($DJUSSW, -2.55%) and semiconductors ($DJUSSC, -2.54%)
Market Outlook
The bond market is SCREAMING RECESSION ahead. The February nonfarm payrolls were released this morning and jobs blew away estimates. After Wednesday's strong ADP employment report and the HUGE revision higher to its January jobs number, the government report this morning added to the bullish economic news. That almost always leads to selling of treasuries and higher yields. After all, if the economic conditions are improving, wouldn't you sell bonds and buy stocks to benefit from those higher corporate earnings? On this "great" economic news this morning, we see Wall Street selling stocks and buying bonds - exactly the opposite of what we should expect!
Instead, bond traders realize a couple things. First, the Federal Reserve is about to screw up policy, which they'll later correct. But near-term, their rate-hiking and hawkish policy is targeted at inflation, without regard to the upcoming recession. (NEWS FLASH: Recessions mean lower demand, which will help to take care of inflation). The Fed will figure this all out after the damage is done in equities and investors' portfolios. This also helps to explain why AD lines (accumulation/distribution lines) are rising and on the verge of breaking to new 52-week highs. Wall Street is once again taking advantage of individual investors, playing along with this "horrific" news theme, all the while buying everyone's shares on the cheap. Anyone surprised? This is what they do.
The emotion of it all is what leads to individuals buying and selling at all the wrong times. Wall Street is in charge of this emotional cycle, which is always on "rinse and repeat". Check out this chart of the SPY that clearly shows the rising AD line, despite the bearish headlines:
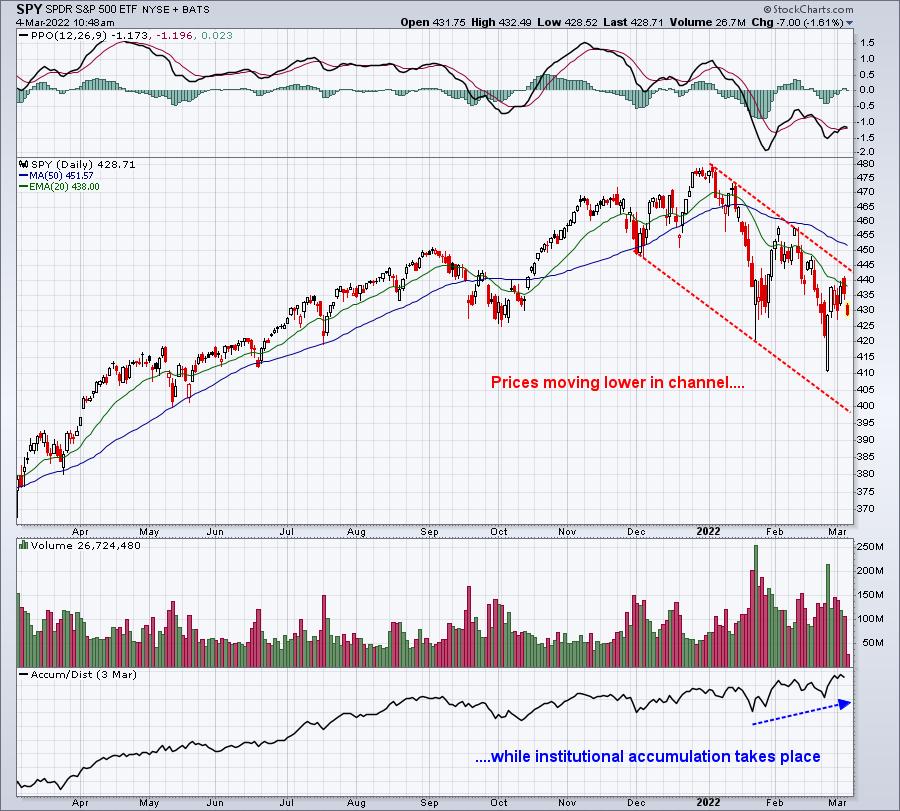
While the news on the surface is awful and we're seeing investor attitudes changing in favor of bearishness right before our eyes, Wall Street is buying. Isn't this game great? When investors give up hope (remember that rising 1-year moving average of the equity only put call ratio), that's when we'll see the market bottom. It's possible that it already did, but I still believe we have one more leg down.
Remember the QQQ:SPY chart that I showed here two days ago? Check it out today:
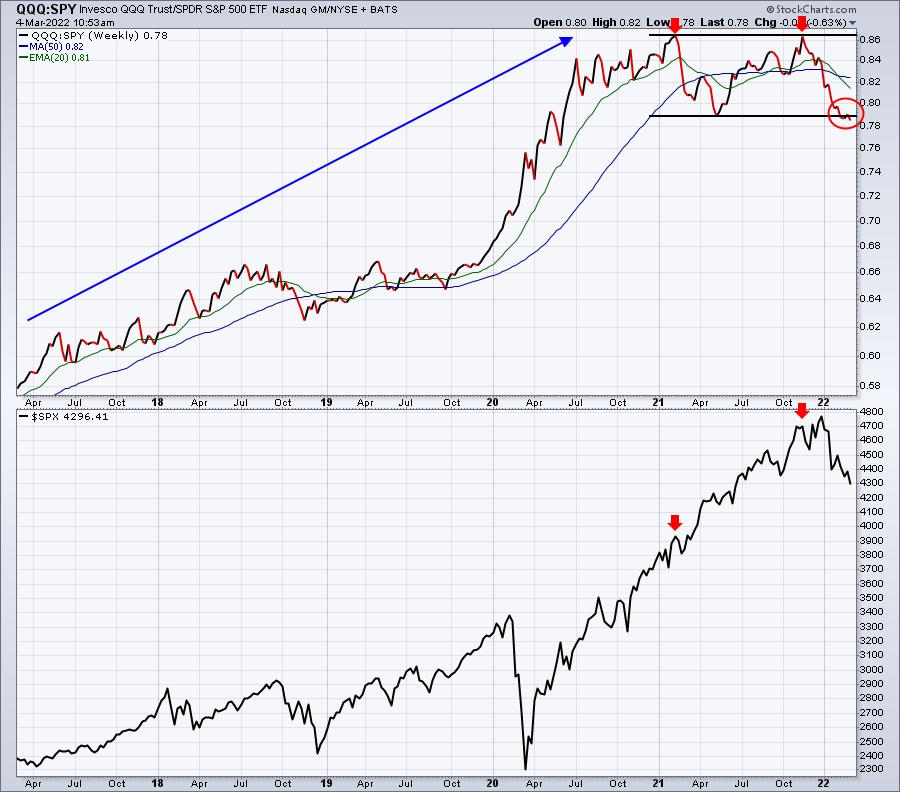
We're rolling over and looks like MAJOR relative support is giving way. While the VIX suggests we could see a rally, we also could be in for a selloff that rivals some of the biggest selloffs we've seen. High VIX means "market makers on vacation" during extreme selling. I still believe the short side is the right side, but you must be prepared for whipsaw action with the VIX this high.
And while I didn't highlight it here today with a chart, many of my "sustainability" ratios are declining today too, suggesting that this down leg could be underway.
Oh....and one final thought. The 5-day moving average of the equity only put call ratio ($CPCE) has reached 0.54 - among the lowest readings of the year. This is a VERY BEARISH development.
PLEASE BE CAREFUL.
Sector/Industry Focus
Gold ($GOLD) continues to benefit from the Russia-Ukraine conflict and all the general unrest right now regarding inflation, economic risks, the Fed, etc. The Volatility Index ($VIX) was back into the mid-30s today, which is very interesting. We normally do not see another leg down begin with such high VIX readings. If we truly are heading lower from here, it could be extremely swift and painful, given the very high VIX reading. I would typically view this elevated VIX reading as a check mark in the bulls' column. So perhaps we see a significant short-term rally and break out of the current down channel? As you can see, I'm a bit perplexed by the current market environment and behavior. I was establishing a short position via the QID (ETF that tracks 2x the inverse performance of the NASDAQ 100) as we hit major channel resistance yesterday. But I'm being prudent to slowly sell this position as the market drops to lock in profits. The VIX at 34-35 could mean literally anything and the moves could be intense, so just be prepared - have a plan in place. Don't worry about trying to pick the perfect spots for a reversal. I will just be vigilant in taking profits. I don't have to be the hero that catches every top and bottom perfectly. That type of greed will generally get you in lots of trouble in a very emotional market.
I've also used strength in gold ($GOLD) to begin unwinding my position. Again, I don't need to exit on the exact top. I believe gold could be in for a substantial rally to $2,000 initially, but possibly $2,500 later this year. I don't make a living trying to trade gold, however. It benefits from market uncertainty and investor fear. It will perform best when the VIX is rising, so being vigilant to cash in profits on VIX advances makes sense to me. Here's the current look at the GLD (ETF that tracks Gold):
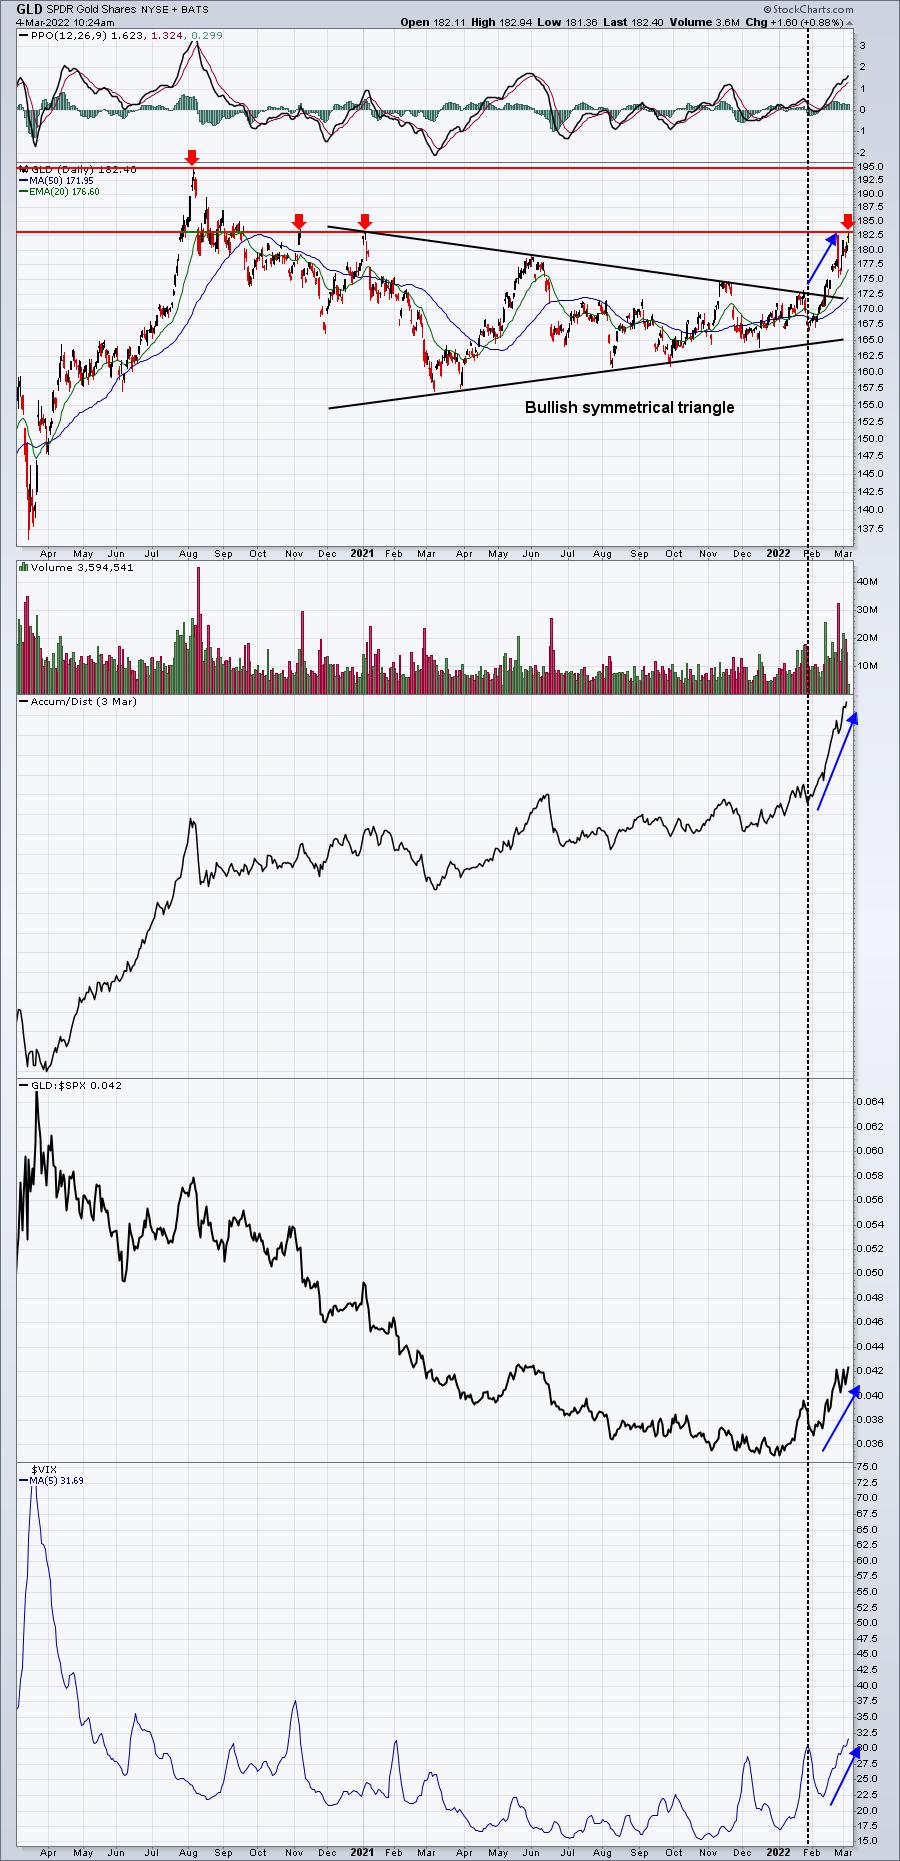
I previously discussed my reasoning for owning gold. I expected cyclical bear market conditions, which results in increased fear (rising VIX). Historically, that's when gold nearly always outperforms the S&P 500. You can see this playing out right now. The bottom panel is the 5-day moving average of the VIX, which is now at its highest level in more than a year. While I do expect that the GLD moves higher, what's wrong with using this VIX advance and rising fear to book some profits? If the VIX subsides and we see a temporary pullback in the GLD, we can always decide later to build our position back up. In the meantime, the profits are booked with no further risk.
ChartLists/Strategies
Remember, cash is a position and a very good one for traders in these market conditions. I typically short by using leveraged or "juiced" ETFs. That way, I only need to worry about market direction, not the performance of individual stocks. The same can be said for long positions as well, but I'm much more comfortable trading individual stocks on the long side, because the stock market goes up more often than it goes down. Therefore, I don't feel the same risk trading individual stocks on the long side. There is NOTHING worse, in my view, than shorting an individual stock that rallies quickly. During the last rally, the S&P 500 moved higher by maybe 7%. Tesla (TSLA), on the other hand, rallied 25%. One loss is manageable, the other is devastating.
Just food for thought.
Earnings Reports
Here are the key earnings reports for the next two days, featuring stocks with market caps of more than $10 billion. I also include a few select companies with market caps below $10 billion. Finally, any portfolio stocks that will be reporting results are highlighted in BOLD. If you decide to hold a stock into earnings, please understand the significant short-term risk that you are taking. Please be sure to check for earnings dates for any companies you own or are considering owning.
Friday, March 4:
None
Monday, March 7:
CIEN
Economic Reports
February nonfarm payrolls: 678,000 (actual) vs. 390,000 (estimate)
February private payrolls: 654,000 (actual) vs. 330,000 (estimate)
February unemployment rate: 3.8% (actual) vs. 3.9% (estimate)
February average hourly earnings: +0.0% (actual) vs. +0.5% (estimate)
Happy trading!
Tom