
EB Daily Market Report - Monday, March 7, 2022
Executive Market Summary
- Futures were down big overnight, but most of those potential losses had reversed by this morning's open
- Crude oil prices ($WTIC, +2.09%) were up 12% overnight, but that market has calmed down somewhat - more on what we might expect from soaring crude below
- Gold ($GOLD, +0.84%) is up another $16 per ounce, closing in on my $2,000 per ounce prediction for this quarter
- Other commodities are lower, however, including copper ($COPPER, -4.50%)
- The 10-year treasury yield ($TNX) is up 3 basis points to 1.75%, holding onto key yield support at 1.70% - at least for now
- Aggressive sectors are taking another hit with consumer discretionary (XLY, -3.26%) leading the way
- Tires ($DWCTIR, -8.16%) and gambling ($DJUSCA, -7.58%) are being hit the hardest within the XLY
- Financials (XLF, -2.47%) are down significantly, despite today's rise in the TNX
- Defense stocks ($DJUSDN, +2.46%) continue to perform well given the heightened tensions in Eastern Europe
Market Outlook
A few questions were sent in after my Friday DMR last week. I discussed Wall Street "selling both bonds and stocks" after the strong jobs report on Friday. I then later discussed how Wall Street was accumulating as prices declined. That triggered a few questions about this potential conflicting statement and I can see why.
Many times I'll use "Wall Street" as the entire stock market, including both institutional and retail traders. Other times, I'll use "Wall Street" as institutions only. But that's not the only confusing part. The stock market can be in a downtrend and still under accumulation. Rising AD lines result, in large part, from late-day buying. But if you've gapped down to start the day, we can have lower prices at session's end that effectively allowed institutions to accumulate. It's the reason why I pay much more attention to afternoon trading vs. morning trading. I refer to morning trading as "amateur hour" on occasion, because many retail traders are reacting to the headlines they're reading. Of course, EB.com members should know by now that trading based off of headlines alone will probably result in serious misinformation and losses.
The S&P 500 is currently in a downtrend that has spanned more than two months. That part is indisputable. But its AD line has been holding its own, which, in my humble opinion, likely represents market makers accumulating on behalf of their institutional clients. So therefore, Wall Street is selling off, but there's also accumulation taking place on the weakness. I don't know if this explanation is helping or hurting.
In the meantime, here's the S&P 500 chart that shows the rising AD line during the 2022 selling:
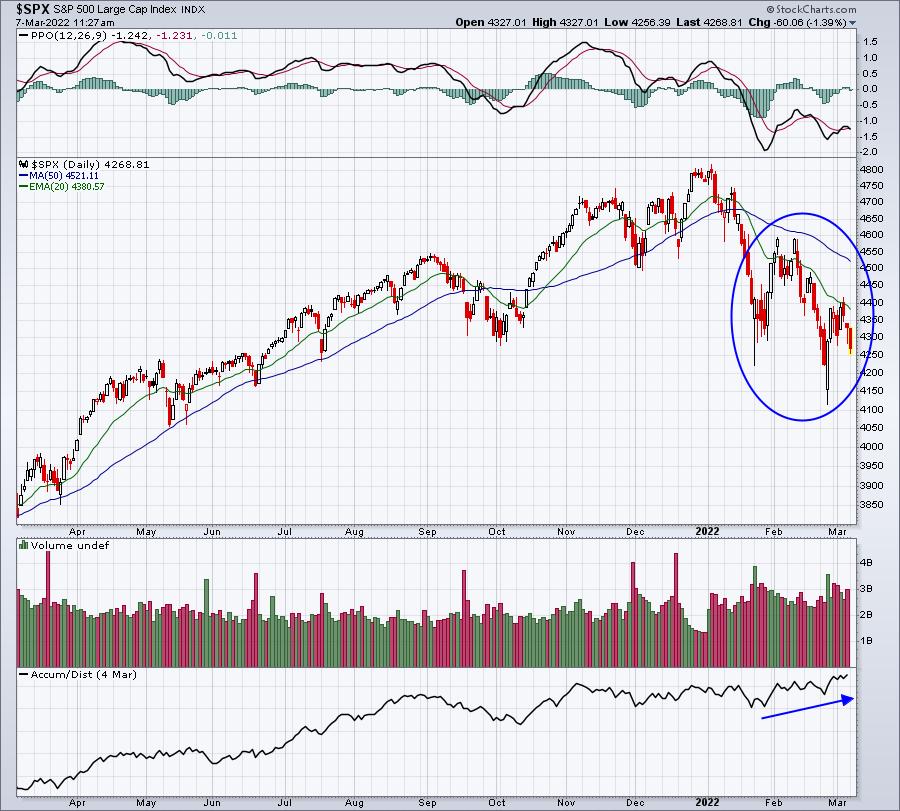
Does this guarantee us that this selling won't last? Of course not. There are no such guarantees. It's simply one signal that I use to help me manage risk. If you know how the formula for the AD line works, then it certainly makes sense that it could be used to help us spot institutional accumulation. But it doesn't guarantee it.
Also, please DO NOT CONFUSE the AD line (accumulation/distribution line) with the Advance-Decline line, also sometimes referred to as the AD line. The Advance-Decline line is a breadth indicator that compares the number of advancing stocks to the number of declining stocks. Many technicians use this as confirmation of the underlying index. I've personally not found it to be as useful as others have. Different indicators work for different folks.
Sector/Industry Focus
Crude oil ($WTIC) is soaring. Obviously, that's not breaking news. It's been surging throughout 2022. But as it keeps rising, I've been seeing more articles - some from technical analysts - discussing crazy levels that we might see. Let me be clear. The Russian-Ukraine is sending crude oil to unsustainable levels. When it reverses, many energy stocks will be hit hard. So just be sure to keep your stops in place. Feel free to ride the wave while it lasts, but on the first sign of weakness, you might want to make sure you book some/all of your profits.
There is precedence that we can review. The Persian Gulf War in the early 1990s provide us an example of what can happen during the conflict. The actual conflict began on August 2, 1990 and ended on February 28, 1991. On the following chart, you can see how the price of crude oil was impacted before, during, and after the war:
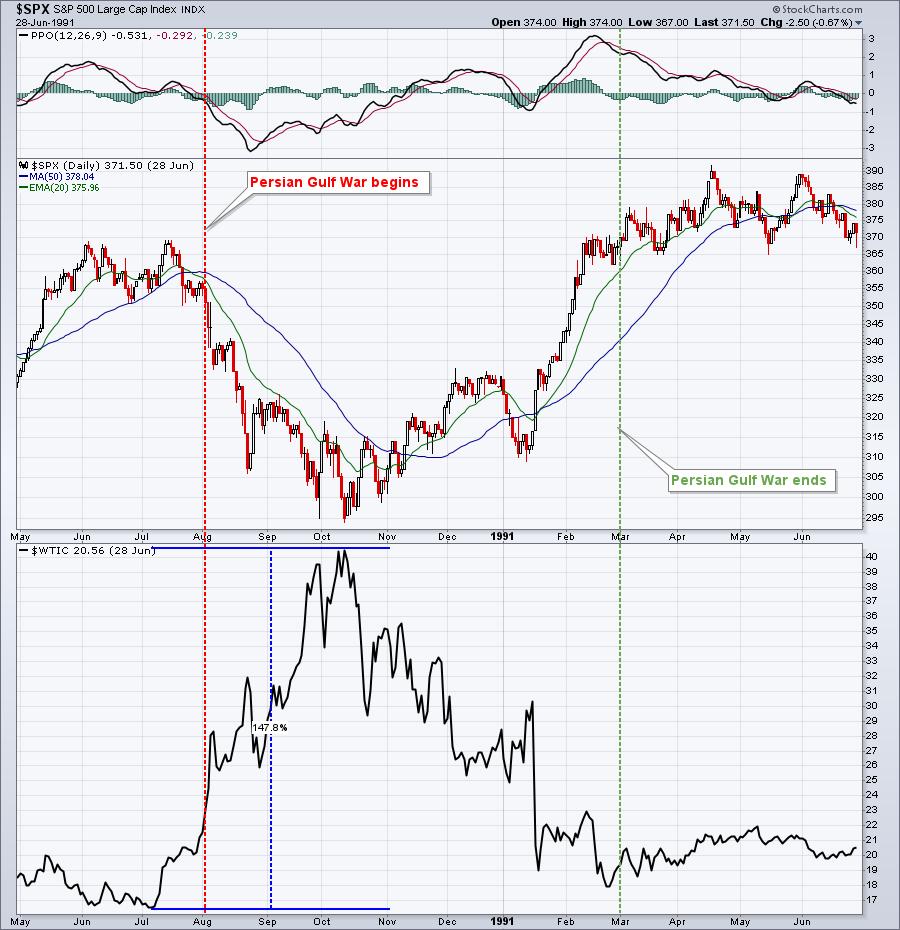
The war caused crude oil to spike close to 150%. But note that when crude oil finally peaked, the S&P 500 coincidentally bottomed at the exact same time. And both occurred MONTHS before the conflict was resolved. My point here is DO NOT PAY ATTENTION TO THE MEDIA. The stock market does not bottom according to the latest news headlines.
Soaring crude oil prices could result in a HUGE decline this month. If it does, however, it may be providing us the opportunity of a lifetime to enter U.S. equities while everyone else is panicking out. Here's the current look at the S&P 500 and crude oil prices:
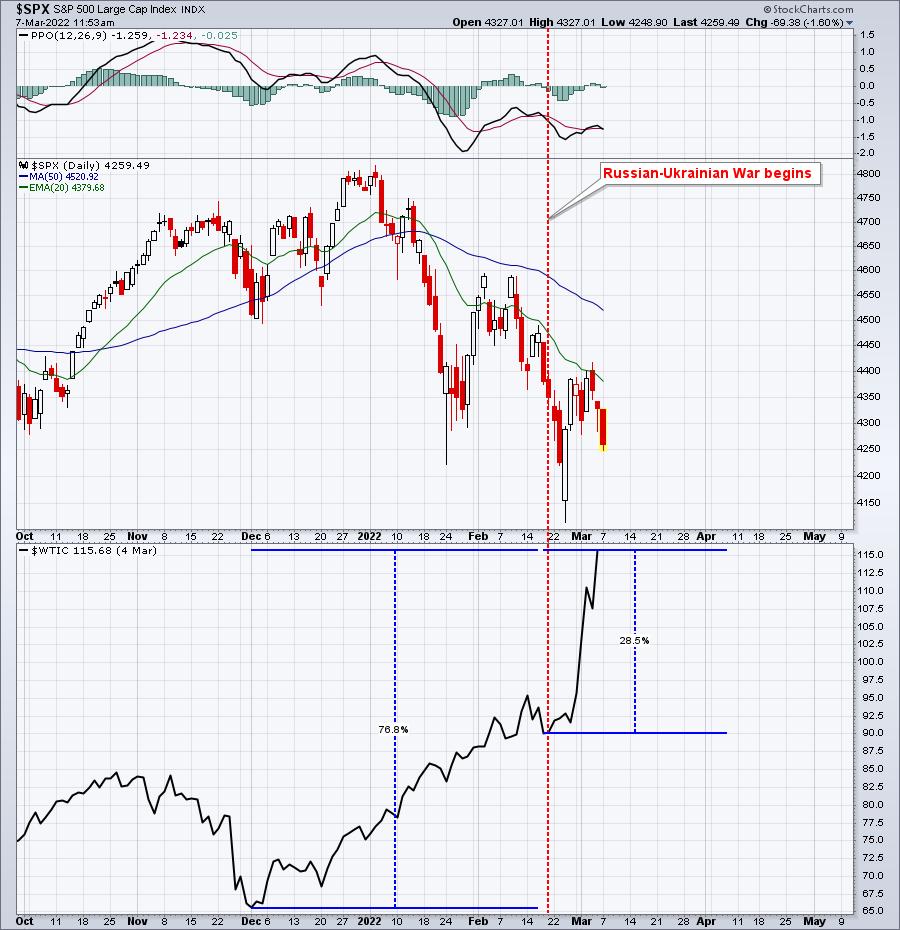
I wouldn't expect the changes to be exactly the same. We have completely different environments. One similarity, however, is that we're in about the same stage of a secular bull market. I believe 2022 will resolve itself back to the upside, just as 1991 did. But the timing, percentage drops, etc. are likely to be different. That's why trying to time the exact bottom is not necessary, in my opinion. Should the S&P 500 reach that 3800 measurement, I will begin looking for opportunities on the long side. I may begin building positions in index ETFs like the SPY, QQQ, etc. Or I might be looking at great companies that are on sale like Apple (AAPL), Tesla (TSLA), Starbucks (SBUX), etc. Or it may be some combination of the two. Let's don't miss out on the opportunity, because we're trying to get the exact bottom.
Short-term, things could really turn ugly. All of my sustainability ratios are pointing lower and making new lows. I'm seeing few signs, other than the elevated VIX, that we'll see a meaningful rally.
Be very careful.
ChartLists/Strategies
I was looking at this week's Upcoming Earnings Relative Strength ChartList and I saw a stock that will be very interesting to watch. ABM Industries (ABM) will report its quarterly results on Tuesday after the market closes and certainly appears as though it will report solid results. Check out its chart:
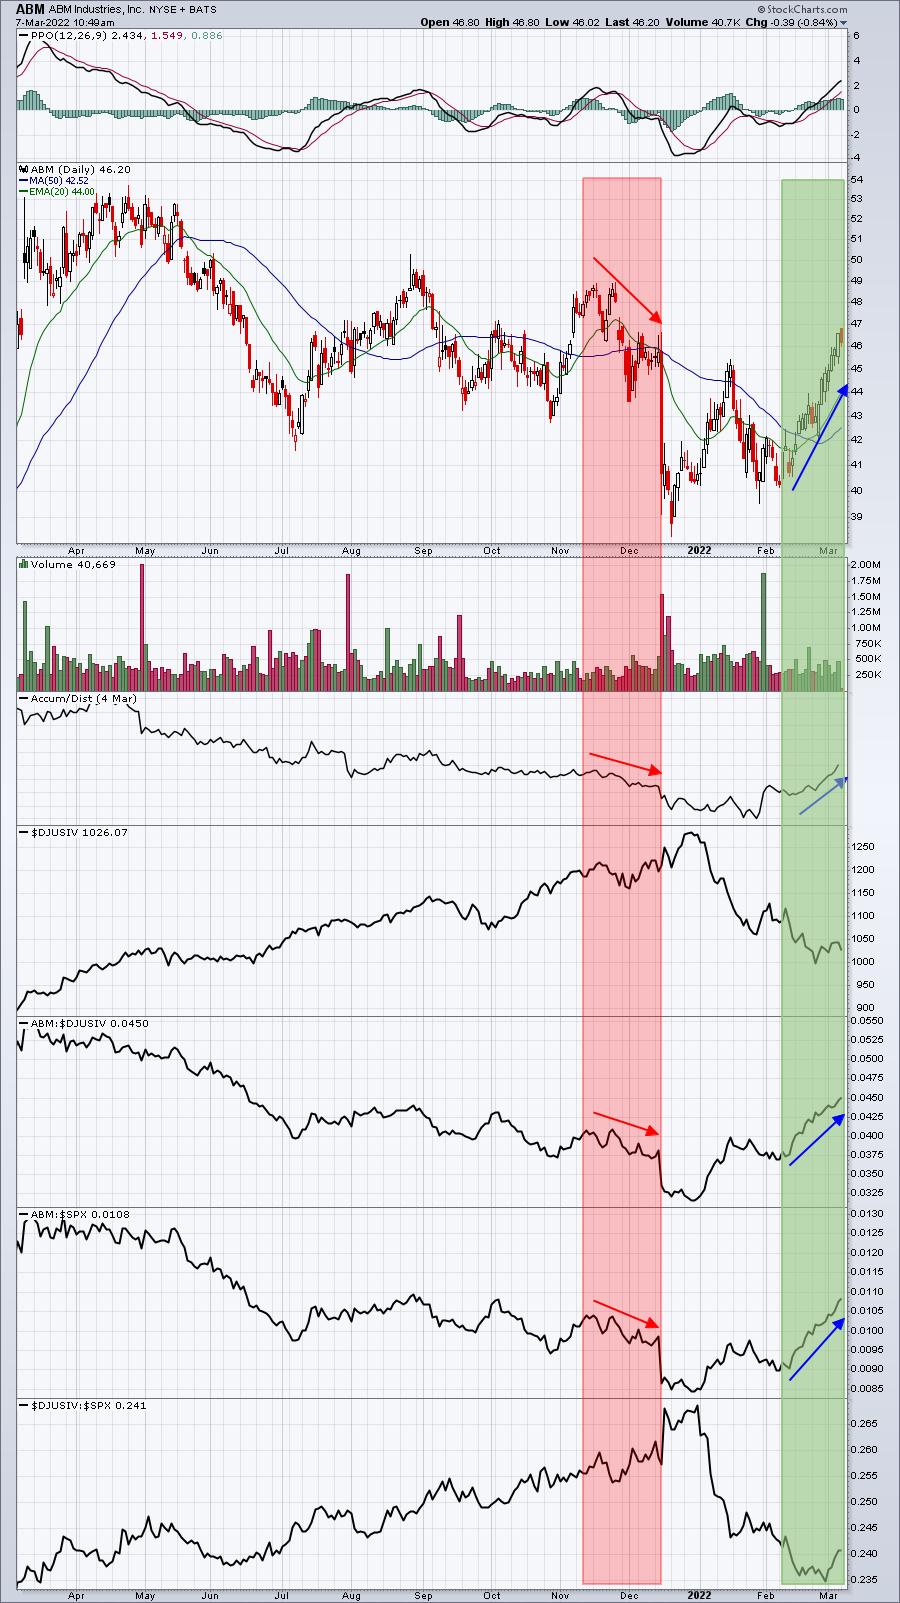
The red-shaded area represents the trading action of ABM just prior to its last quarterly earnings report. Wall Street was not impressed and didn't expect much from ABM's quarterly report. It turned out to be a very accurate indication of what management was likely to report. Despite beating both revenue and EPS estimates, ABM lowered its quarterly forecast and the stock was hammered. Prior to that report, however, notice that ABM was trading lower, its relative strength was weakening and its AD line was trending down?
Now focus on the green-shaded area, which represents the past month of ABM price action. Everything has reversed and now the stock is uptrending, gaining relative strength, and appears to be under accumulation (AD line rising). Expect a better report this quarter, and possibly a big move higher after earnings. It's always risky to hold any stock into its earnings report, so that's completely up to you. I'm simply pointing out that I believe Wall Street has much better expectations heading into this report vs. the last.
Earnings Reports
Here are the key earnings reports for the next two days, featuring stocks with market caps of more than $10 billion. I also include a few select companies with market caps below $10 billion. Finally, any portfolio stocks that will be reporting results are highlighted in BOLD. If you decide to hold a stock into earnings, please understand the significant short-term risk that you are taking. Please be sure to check for earnings dates for any companies you own or are considering owning.
Monday, March 7:
CIEN
Tuesday, March 8:
MDB, OLPX, DKS, GWRE, CASY, WOOF, ABM, BMBL, SUMO, SFIX
Economic Reports
None
Happy trading!
Tom