
EB Daily Market Report - Tuesday, March 8, 2022
Executive Market Summary
- Futures were mixed overnight, but we opened very close to the flat line
- After initial selling, we saw the biggest rebound that we've had since late February
- Energy (XLE, +2.12%) is again leading all sectors as crude oil ($WTIC, +5.76%) surges yet again, this time to $126 per barrel
- Consumer discretionary (XLY, +1.45%) is also bouncing after a very poor last few days
- Defensive sectors are taking a hit today as consumer staples (XLP, -1.62%) and health care (XLV, -1.25%) both drop more than 1%
- Gold ($GOLD, +3.00%) is soaring to $2055 per ounce, continuing its rally since breaking out of its symmetrical triangle
- The 10-year treasury yield ($TNX) is up 12 basis points to 1.87% as we approach the key February CPI report on Thursday morning
- Renewable energy ($DWCREE, +8.56%) is strong today as SolarEdge Tech (SEDG, +10.21%) and Enphase Energy (ENPH, +10.11%) are the two best performing S&P 500 stocks
Market Outlook
There has been no rotation back into growth stocks and that is keeping me very much on the bearish side. Yes, we saw a big rally earlier today, but this is exactly what we SHOULD expect. The Volatility Index ($VIX) is in the 30s, so big moves back and forth is the norm. I still haven't seen capitulation followed by afternoon buying. That's what typically marks short-term bottoms and, potentially, long-term bottoms. Instead, the QQQ:SPY ratio just set another fresh relative low. The market's best opportunity at a sustained short-term rally will occur with money rotating to more aggressive areas. Here's the latest QQQ:SPY chart:
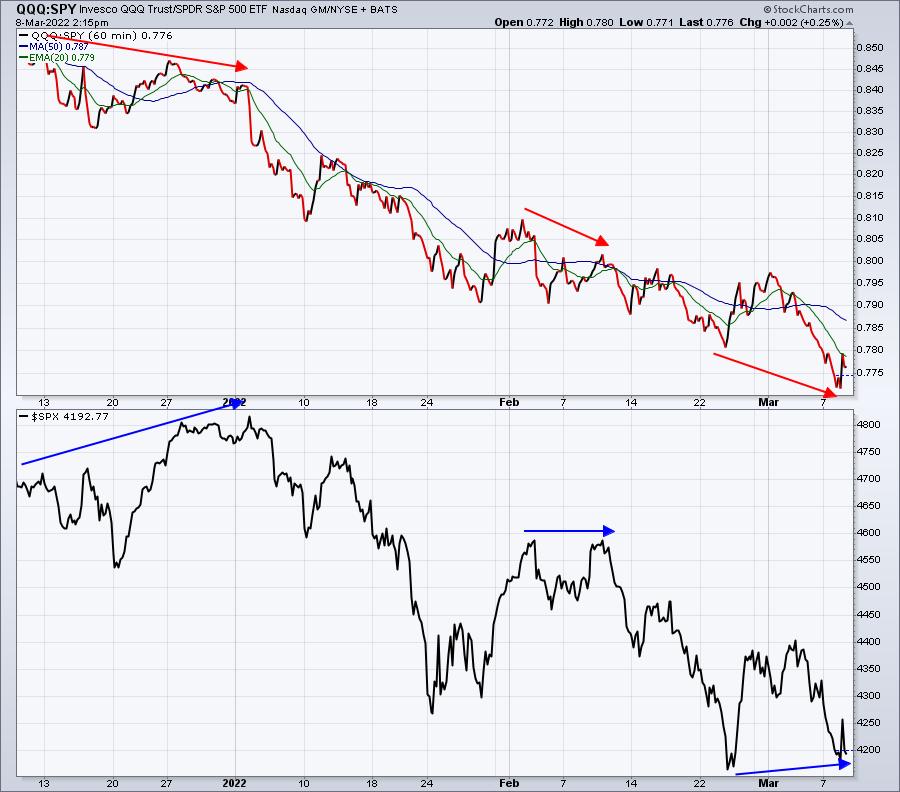
I'd prefer to see the opposite divergence. Instead of seeing higher consecutive lows on the S&P 500 with a falling QQQ:SPY ratio, I really want to see the S&P 500 lows falling, while positive rotation favors the QQQ. That would be a sign of a potential bottom forming.
Sector/Industry Focus
I also am watching the growth vs. value ratios as well, figuring that rotation into growth as the overall market falls would be another very positive sign. The IWF (large cap growth) and IWD (large cap value) are two ETFs that I compare from time to time. Here's the latest relative ratio for the IWF:IWD:
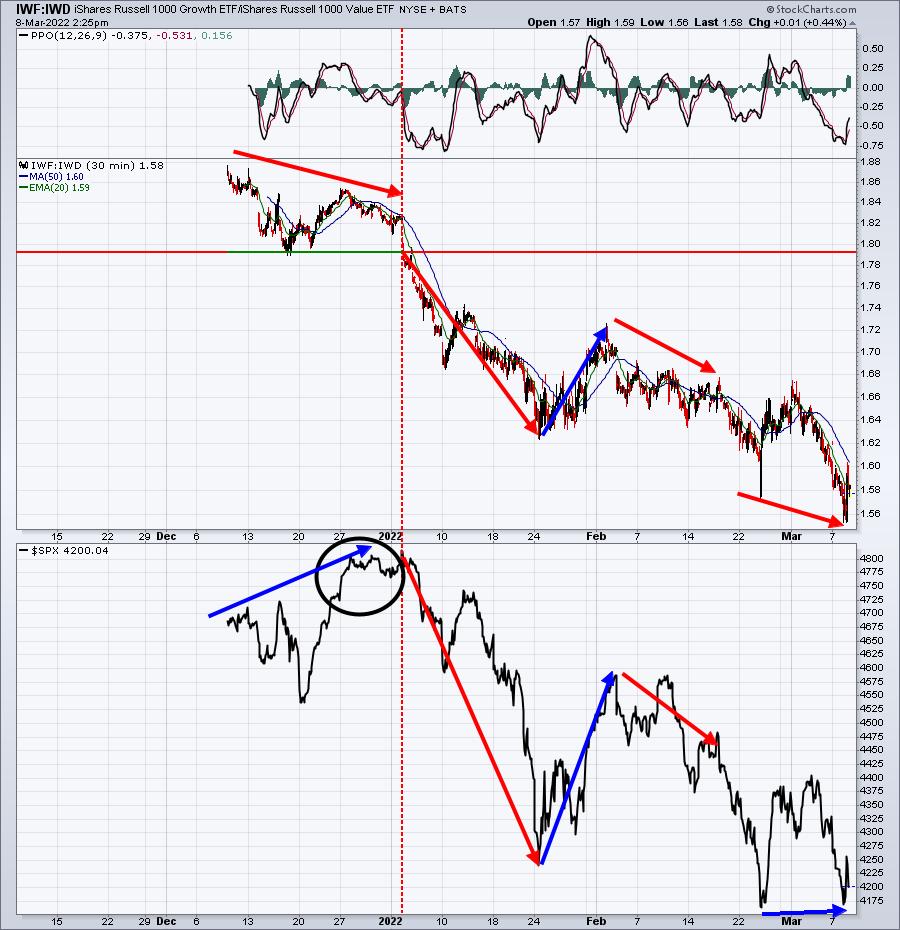
Instead of signaling a potential bottom, the IWF:IWD relative ratio is actually suggesting that it's more likely we're heading lower. That may happen into the close today, but with the VIX into the 30s, we could see a big rally into the close or a major selloff.
Honestly, flip a coin.
ChartLists/Strategies
I've closed out my gold ($GOLD) position. After the big surge today, gold traded over $2000 per ounce, which was my initial target when I first detailed this trade. I'm not greedy. Fear has been escalating for weeks and gold normally benefits from this type of fearful environment. Perhaps the fear escalates further, but I'm content taking profits and moving that part of my portfolio back to cash. Here is the gold chart and the symmetrical triangle breakout that led to $2000 gold:
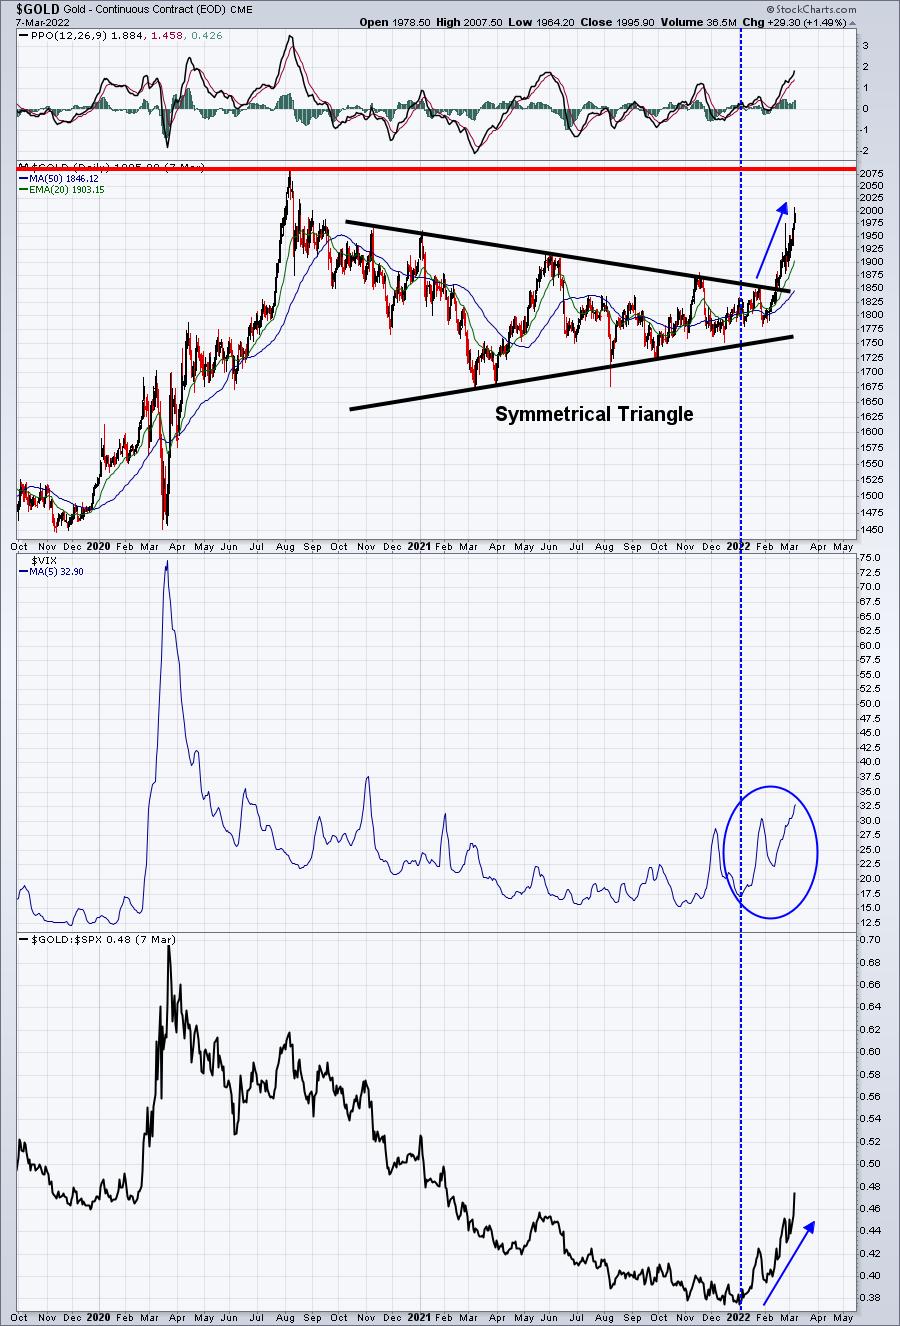
There most definitely could be more upside. I'm just choosing not to risk profits. The symmetrical triangle breakout really got things going here, but you can see the 5-day moving average of the VIX began rising at the start of 2022 and that's exactly when gold began outperforming the S&P 500 (bottom panel).
Earnings Reports
Here are the key earnings reports for the next two days, featuring stocks with market caps of more than $10 billion. I also include a few select companies with market caps below $10 billion. Finally, any portfolio stocks that will be reporting results are highlighted in BOLD. If you decide to hold a stock into earnings, please understand the significant short-term risk that you are taking. Please be sure to check for earnings dates for any companies you own or are considering owning.
Tuesday, March 8:
MDB, OLPX, DKS, GWRE, CASY, WOOF, ABM, BMBL, SUMO, SFIX
Wednesday, March 9:
CRWD, FNV, BEKE, CPB, LU ASAN, MQ, THO, OTLY, KFY, UNFI
Economic Reports
None
Happy trading!
Tom