
EB Daily Market Report - SPECIAL REPORT - Thursday, March 10, 2022
We saw the latest CPI report (February), which was released this morning. It came in about as expected, with the February Core CPI rising 0.5% - matching consensus estimates. That sent the annual core inflation rate HIGHER (as I've previously suggested) to 6.4%, the highest rate we've seen in more than 4 decades. Prepare for the media onslaught.
The high volatility ($VIX) and the big swings back and forth characterize the late stages of a cyclical bear market. The characteristics of our current market environment and that of the 1990-1991 cyclical bear market are remarkably similar - almost eerily similar. I believe studying this period would do all of us a lot of good right now. Let's talk about 1990.
1990
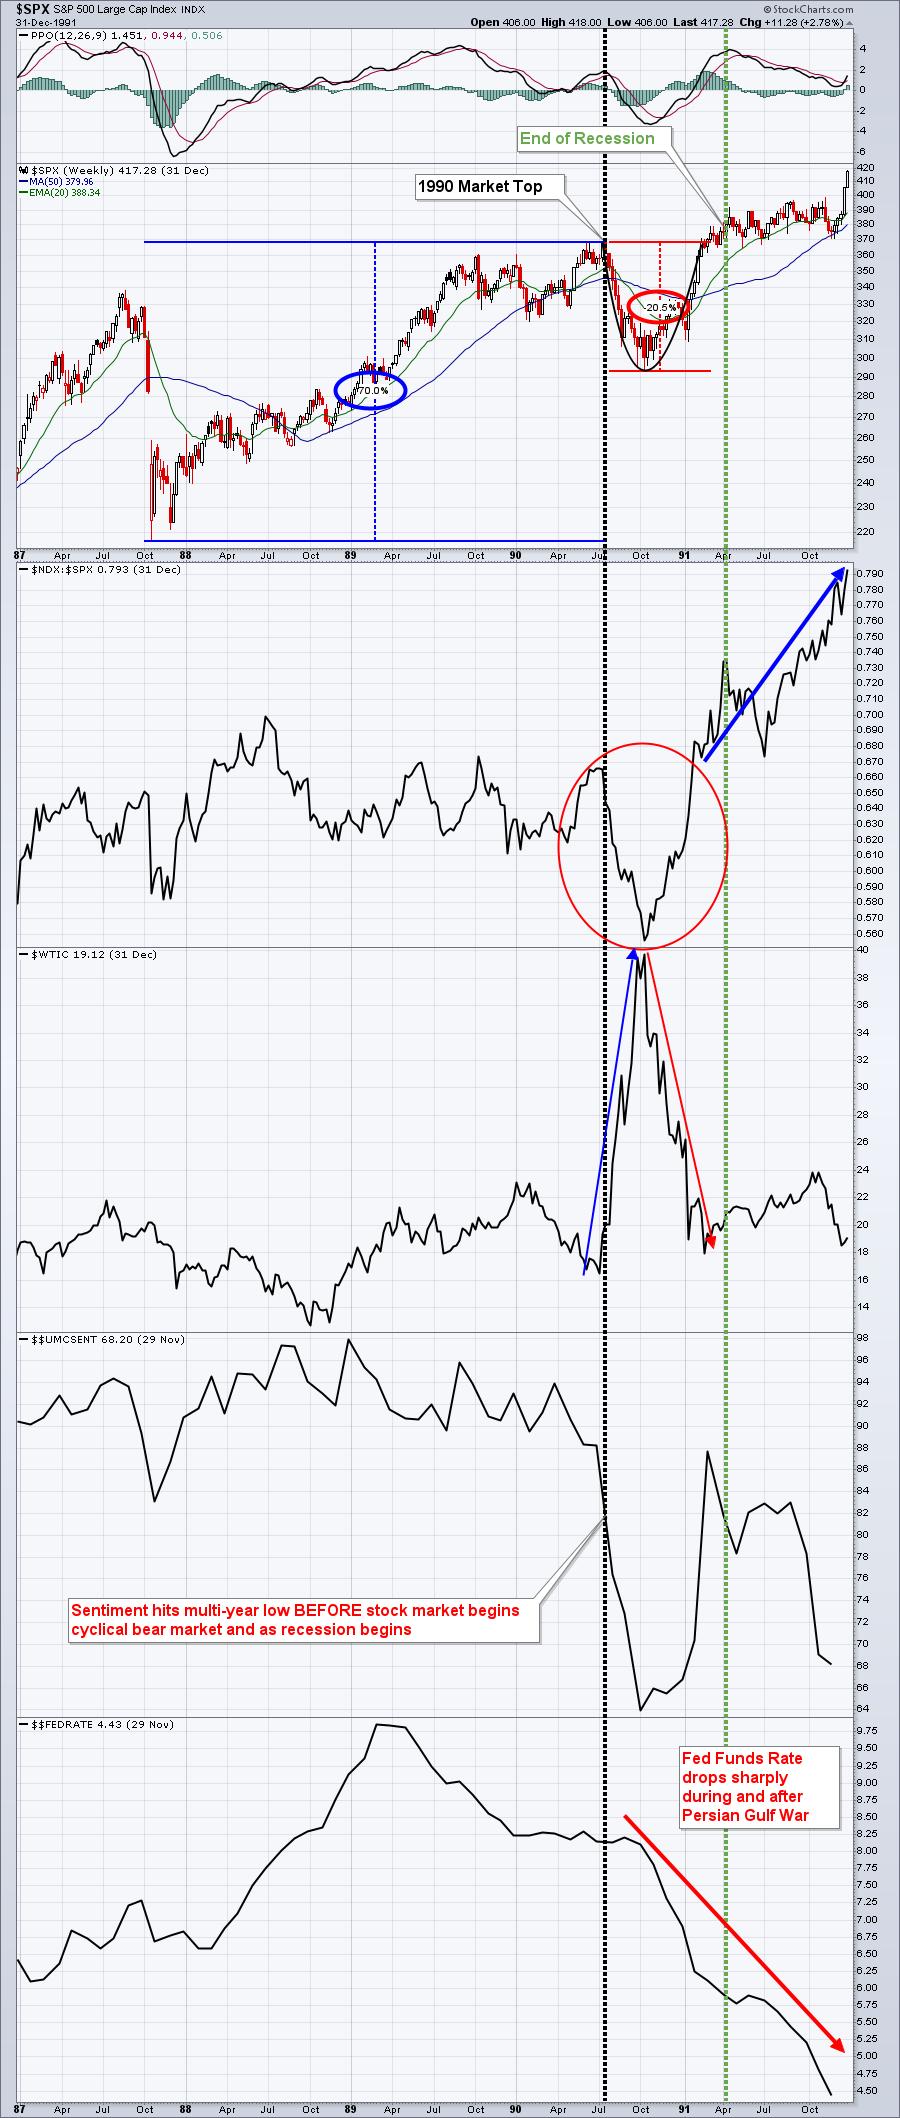
During the 1990-1991 cyclical bear market, we had a prior run up in the S&P 500 of 70% in 2 1/2 years, the Persian Gulf War, surging oil prices (rose 147% in just a few months), falling consumer sentiment, failed NASDAQ leadership at the final 1990 high, and much of this led us into a fairly mild recession. It all started about 9 years into a secular bull market that began in the early 1980s. Does any of this sound somewhat familiar? Here's the chart summarizing all of this from 1987 through 1991:
2022
I'm going to show you the current S&P 500 chart with exactly the same panels beneath it, so you can study the similarities:
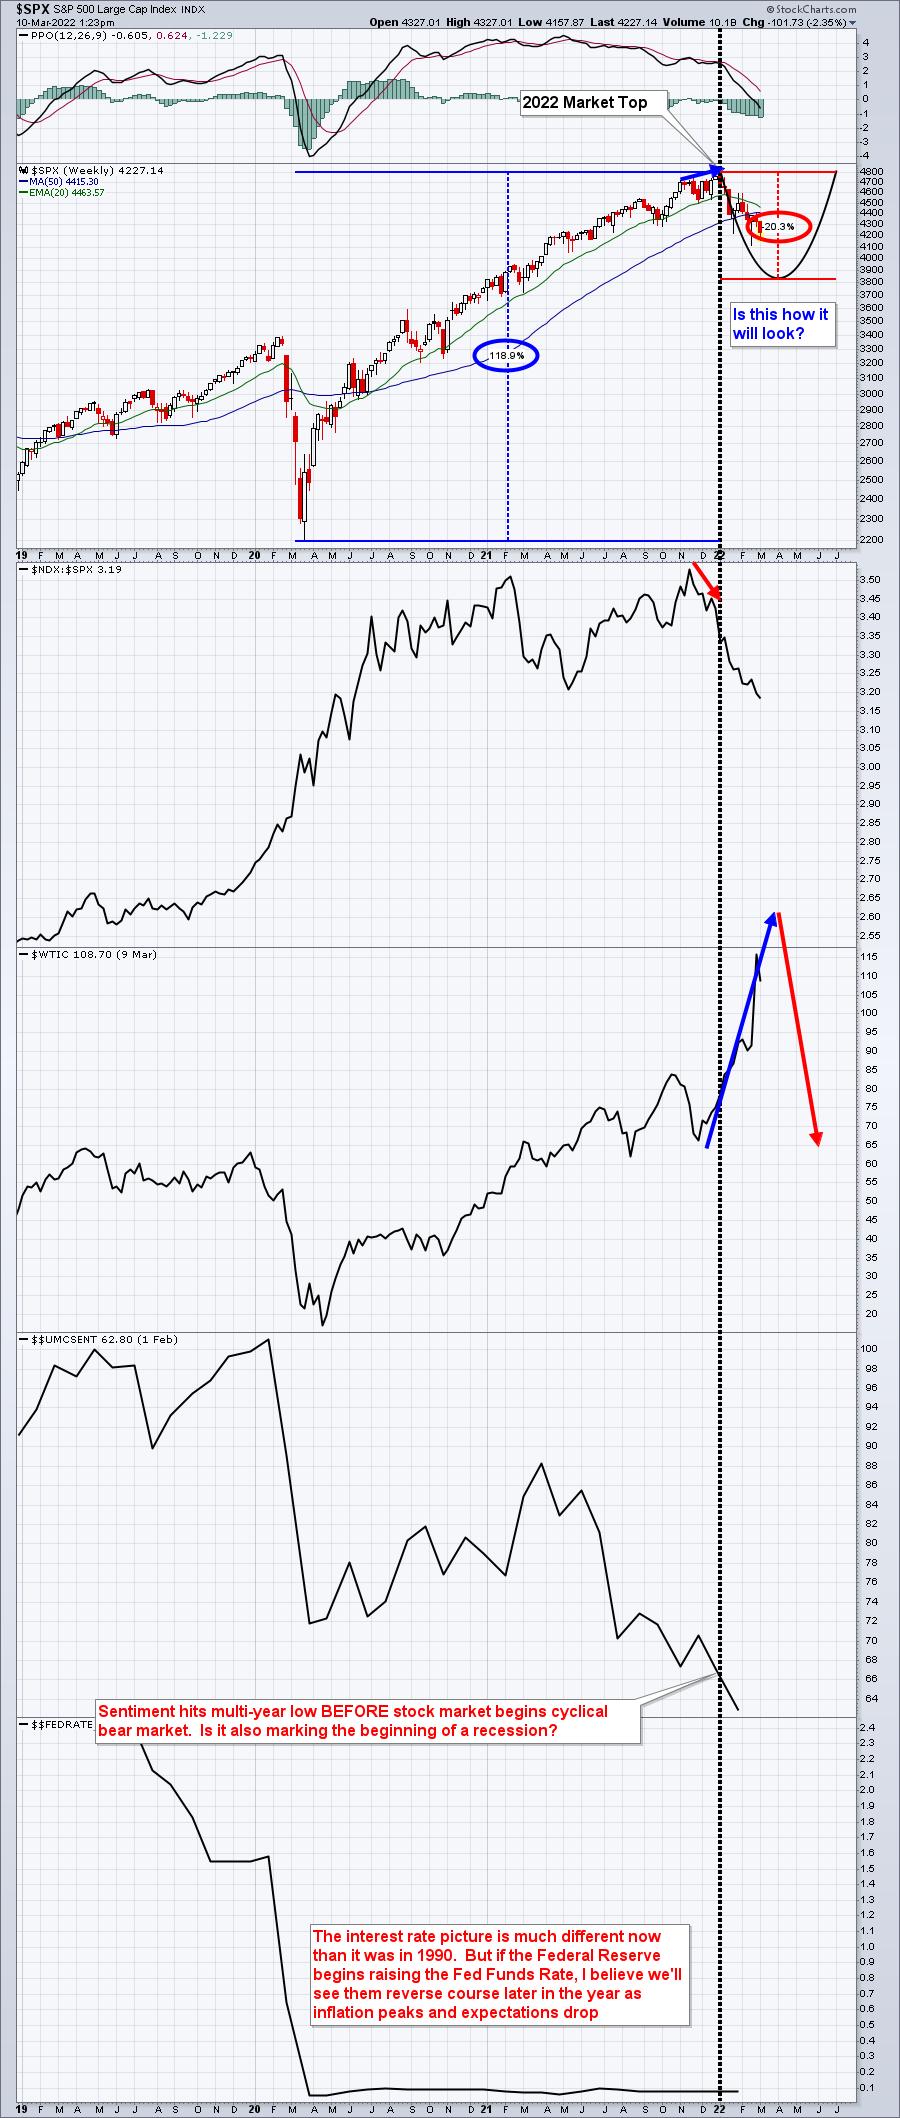
A move down to roughly 3800 on the S&P 500 would approximate the cyclical bear market decline of 1990. A few points that I believe are very important as we study these two charts:
- The similarity in consumer sentiment is astounding (our next consumer sentiment reading will be released Friday morning)
- The soaring crude oil prices are resulting in inflation spiraling higher and will increase recession probabilities
- Our 2+ year rally in 2020-2021 was approximately 119% off the March 2020 low, a much larger advance than we saw prior to the 1990 cyclical bear market. Will this mean a bit larger decline? Could we see 3500-3600? I think it's very possible.
- The final move lower in cyclical bear markets tends to be the worst with the highest volatility ($VIX). Predicting where the VIX might top is nothing more than a guess. History tells us that ANY VIX readings in the upper-30s and throughout the 40s have been GREAT BUYING OPPORTUNITIES historically, even if you don't catch the exact bottom. Sometimes you fall another 5-10% very quickly, but the recoveries are usually insanely quick. Emotionally, it's very difficult to pull the trigger and buy AFTER a bottom has formed and a rally is underway. So "holding your nose" and buying into extreme weakness is typically the best strategy.
- I could be completely wrong. Maybe we never get to 3800 or 3500. Or maybe we don't stop there. But my indicators, along with history, suggest that it's prudent to consider much of the above as the "most likely" path of the stock market, NOT the guaranteed path.
When and whether to buy during a cyclical bear market is, quite honestly, up to each individual based upon your own unique financial situation and objectives. I'll do my best to alert you if I believe we've hit a tradable bottom, but it's not always easy to spot those.
I believe the current stock market volatility and worries will resolve itself similarly to 1990-1991, including the subsequent significant outperformance of the NASDAQ 100 vs. the S&P 500. Time will tell.
Happy trading!
Tom