
EB Daily Market Report - Monday, March 14, 2022
Executive Market Summary
- Futures were bifurcated overnight with the Dow Jones and S&P 500 showing modest gains, while the NASDAQ was lower
- The NASDAQ has continued to underperform as growth stocks (IWF, -1.15%) fail to keep pace with value stocks (IWD, +0.28%); this relationship will always give me stock market heartburn
- Commodities are mostly lower today, with gold ($GOLD, -6.47%) and crude oil ($WTIC, -6.46%) leading the way
- The 10-year treasury yield ($TNX) is up 10 basis points to 2.11%, breaking to their highest level since July 2019
- Financials (XLF, +1.87%) are getting a temporary lift with rising yields, but I don't believe it'll last
- Defensive sectors are also performing well today as health care (XLV, +1.12%) and consumer staples (XLP, +0.97%) gain ground
- Energy (XLE, -2.64%) is taking a back seat with falling crude oil prices
- Consumer discretionary (XLY, -1.54%) and technology (XLK, -1.19%) are both struggling, leading to the poor performance of growth stocks
- Renewable energy ($DWCREE, -6.97%) stocks, on fire recently, have quickly turned lower and threatening to break beneath their 20-day EMA
- The Federal Reserve meets starting tomorrow, with an interest rate hike announcement likely on Wednesday
Market Outlook
Well, we are about to see if the bulls have any fight in them. The QQQ (ETF that tracks the NASDAQ 100) has reached a very critical level of price support:
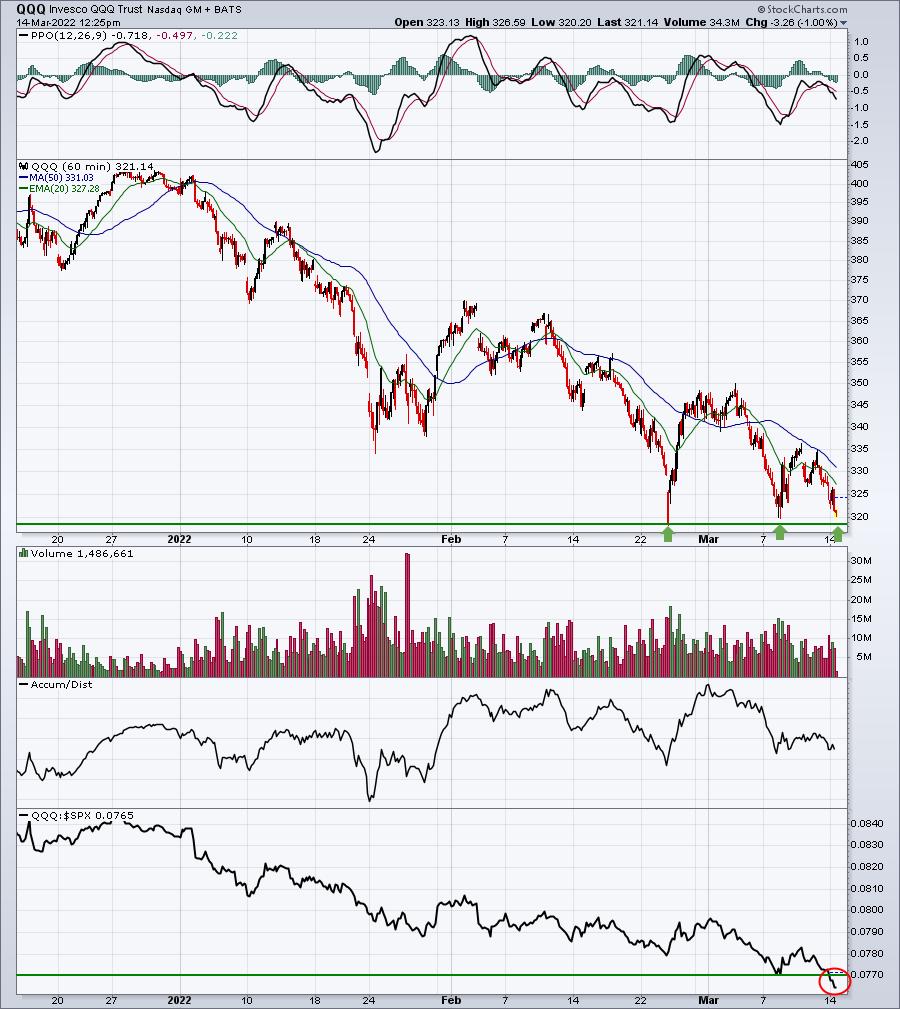
The bottom panel is the problem. The QQQ's relative strength vs. the S&P 500 has already broken down, so there are no signs that Wall Street is using this weakness to move into the more aggressive QQQ. That tells me that QQQ price support just below 319 is less likely to hold. Maybe it holds short-term and we bounce into tomorrow's Fed announcement? If not, I'd be very careful on the long side as impulsive selling could easily kick in, sending our major indices spiraling lower this afternoon.
Sector/Industry Focus
Crude oil ($WTIC) has been a hot topic of late with the Russian-Ukrainian war and the subsequent Russian sanctions delivered from all over the world. Unless Russia backs down, I'd guess we haven't seen the last of crude oil spikes. One way to trade this is to buy/sell the iPath Pure Beta Crude Oil ETN (OIL). When I look to use an ETF or ETN to trade an index, one of the first things I'll do is look at the correlation of the two using the correlation coefficient provided by StockCharts.com. You can do that with oil by pulling up a chart of OIL, then checking to see how positive the correlation is with the $WTIC. If we go back a year, here's how that looks:
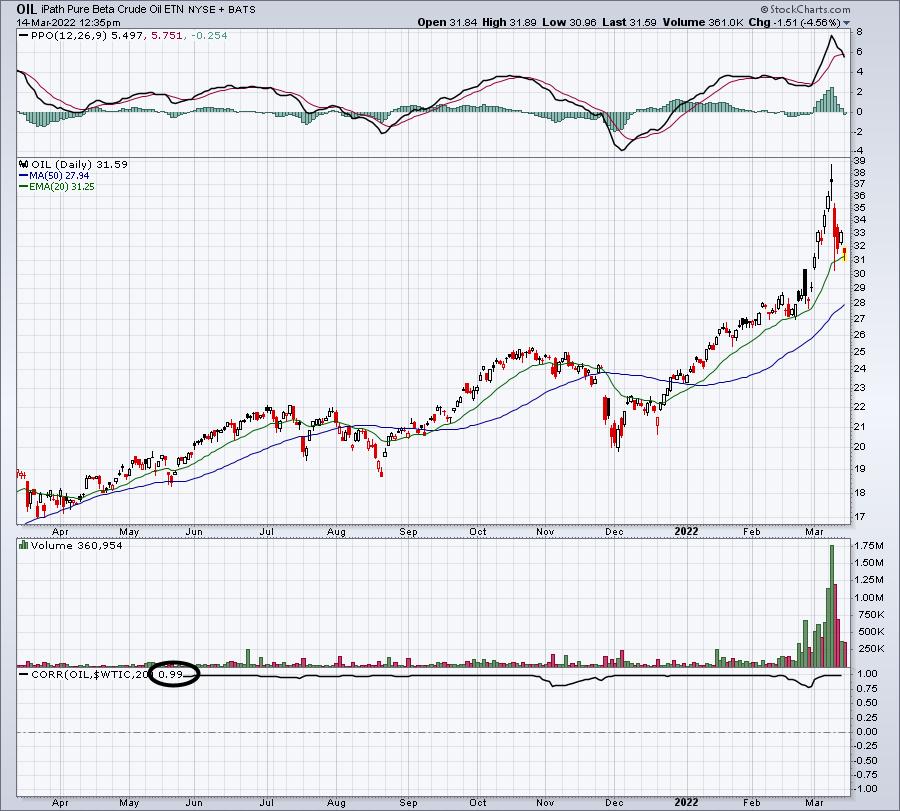
You can see there is extremely tight positive correlation between OIL and $WTIC. It's almost exclusively at the 1.00 level. To see the correlation between crude oil and XLE (ETF that tracks energy sector), here's that chart:
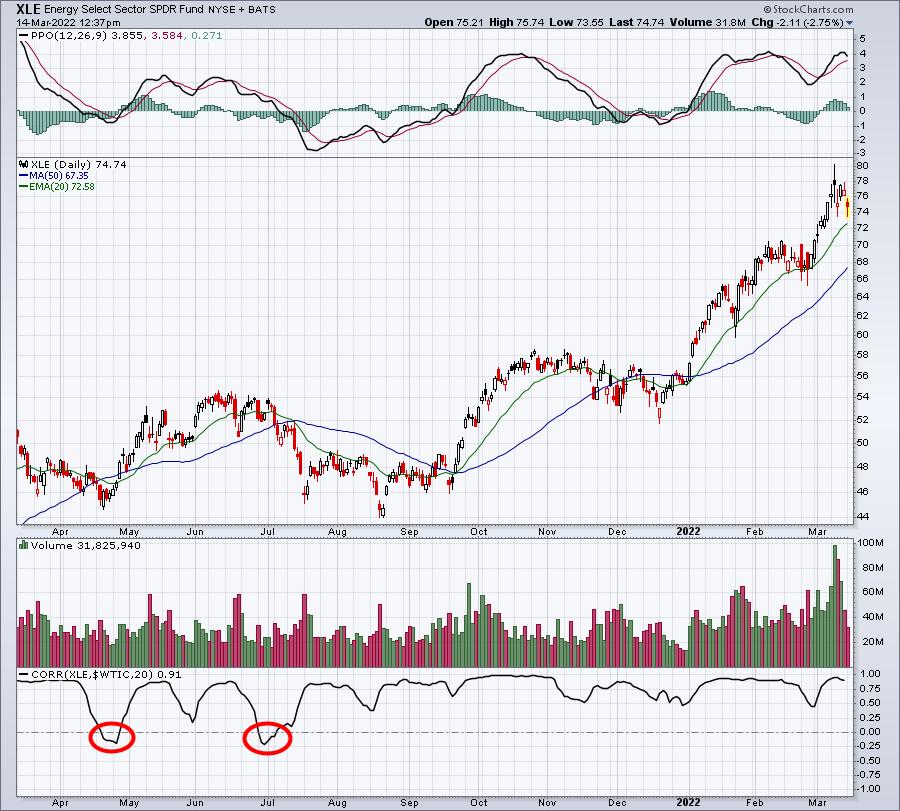
While the correlation between the XLE and $WTIC remains quite positive, it's definitely not nearly as positively correlated as OIL. You can see this correlation actually turned negative twice over the past year. The conclusion here is that movement in the $WTIC will not necessarily mean the same corresponding move in the XLE. Therefore, if you see a potential trade looking at the $WTIC chart, I'd favor trading OIL vs. XLE. Hopefully that makes sense.
By the way, the correlation coefficient indicator can be found below your SharpChart on StockCharts under "Indicators".
ChartLists/Strategies
First, a quick update on WTI, an energy company that I took a position in late last week just above 5.00. Crude oil ($WTIC, -7.13%) is now down nearly $30 since touching $130 per barrel on March 7th. In the Sector/Industry Focus section above, I've highlighted a potential trade directly into crude oil for those interested. It's extremely volatile, but the Russian-Ukrainian war could trigger big moves in crude oil in both directions throughout this conflict. After a $30 drop, it might make sense for some traders to dive into. Just beware the volatility and make sure you can handle it. We've seen plenty of BIG overnight surges and drops.
Now back to WTI. There's no doubt that the price of crude dropping is taking a toll here. The S&P 500 loser leaderboard is littered with energy and materials names today. I doubt it lasts as I see at least one more surge higher in energy and many commodity prices, but always expect the unexpected and keep stops in place. I don't have a huge position in WTI, so I'm willing to give it more room. I was not available to trade first thing this morning and WTI fell quickly at the open. WTI bounced at 4.50 this morning, which also coincides closely with its intraday level of price support:
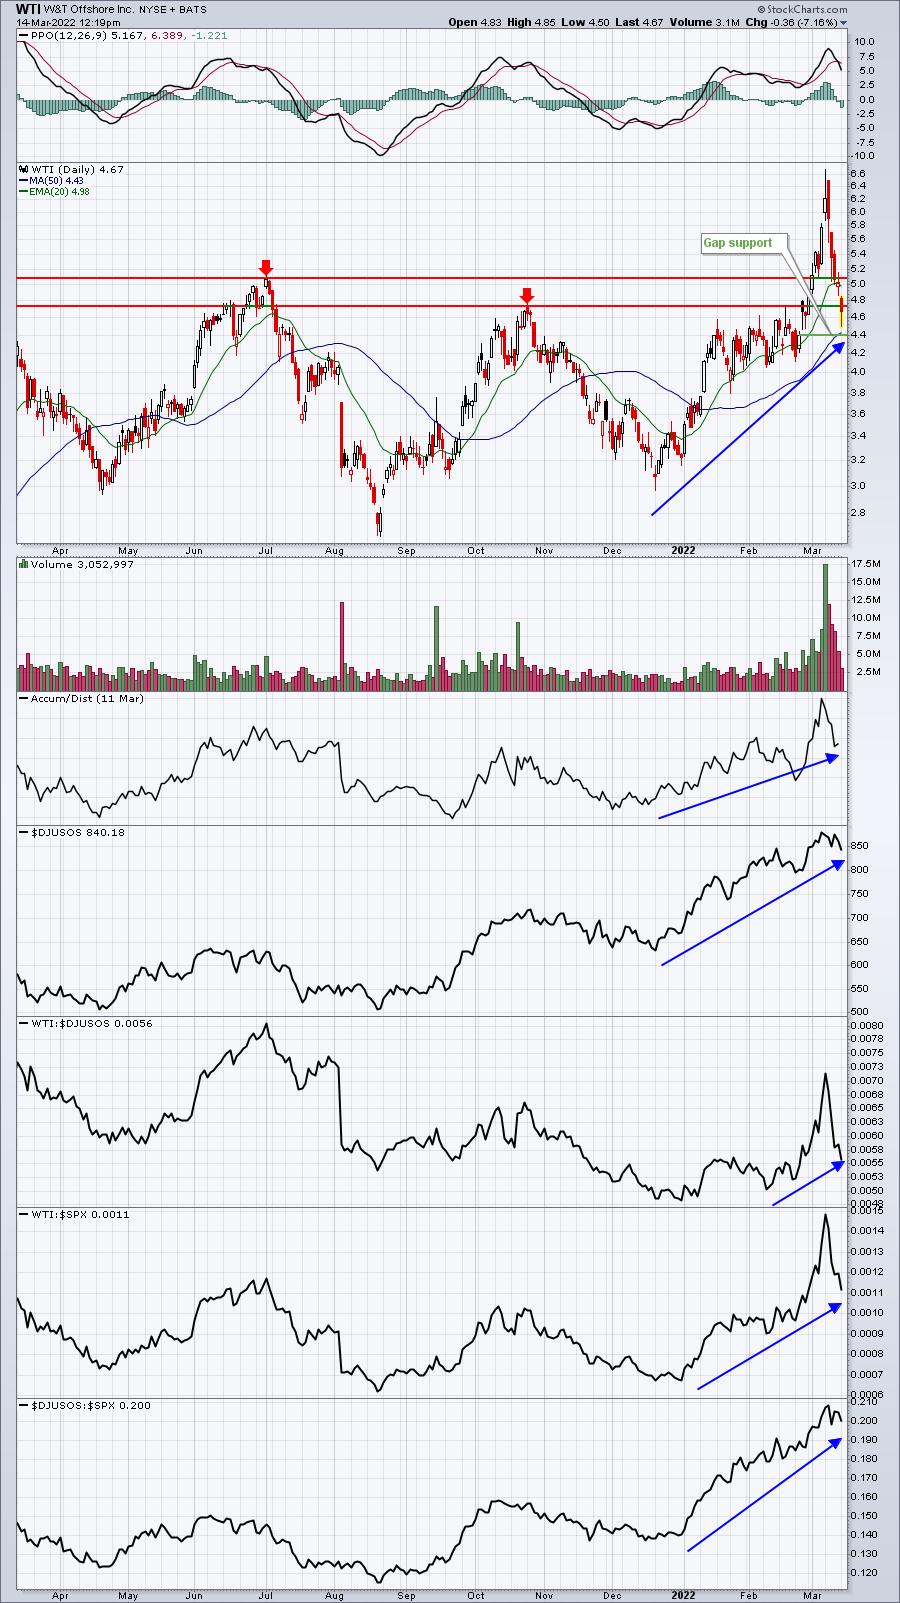
Also, there's gap support at 4.39. A close beneath 4.39 definitely takes me out of this trade. The above chart is the same chart I provided on Friday. The only added annotation is the gap support level at 4.39, so you can see clearly that level. The October price high was 4.73. We opened above that level today, so with the intraday low of 4.50, a close back above 4.73 would provide a bit more of a bullish look to the chart - a kick save with a long tail beneath support. That certainly could be a sign of market maker participation, clearing out a lot of stops.
Earnings Reports
Here are the key earnings reports for the next two days, featuring stocks with market caps of more than $10 billion. I also include a few select companies with market caps below $10 billion. Finally, any portfolio stocks that will be reporting results are highlighted in BOLD. If you decide to hold a stock into earnings, please understand the significant short-term risk that you are taking. Please be sure to check for earnings dates for any companies you own or are considering owning.
Monday, March 14:
MTN, COUP
Tuesday, March 15:
S, SMAR, IHS
Economic Reports
None
Happy trading!
Tom