
EB Daily Market Report - Wednesday, March 16, 2022
Executive Market Summary
- Futures were strong overnight and opened significantly higher
- The NASDAQ, weakest among our key indices recently, are showing relative strength today
- 9 of our 11 sectors are higher; utilities (XLU, -0.84%) and energy (XLE, -0.49%), the sectors with the two highest SCTR scores, are the laggards - surprising? NO
- Meanwhile, the second-lowest SCTR score among sectors belongs to consumer discretionary (XLY, +2.66%), which is today's leader
- Bitcoin ($BTCUSD, +2.28%) rises back above 40,000, but 45,000 is the critical resistance level
- Gold ($GOLD, -0.73%) slips, while crude oil ($WTIC, +0.56%) moves slightly higher
- The 10-year treasury yield ($TNX) rises one basis point to 2.17%, as traders anxiously await the FOMC policy statement, due out in just two hours at 2:00 pm ET
Market Outlook
We have the Fed meeting rapidly approaching as our Fed Chief Jay Powell will discuss the first rate hike since 2018 during the policy statement at 2:00 pm ET. He may also discuss the likelihood of further rate increases to combat the stubborn rise of inflation. He'll likely say the Fed is monitoring developments in the Russia-Ukraine conflict and he might even mention signs of a weakening economy.
Nothing goes straight down. We have declines, followed by rallies, then further declines. That's how a cyclical bear market evolves. I'm still of the belief that we have another leg lower and it could be the biggest one yet. Will it begin after today's Fed meeting? Maybe later this week as options expiration Friday approaches? I don't know, but I will be building positions in the QID/SDS into market strength. If I'm wrong, I'm wrong, but I play what I see in the charts. I pay no attention whatsoever to the media. They don't know anything.
I will be paying very, very close attention to some of the key ratios that I like to follow and I'll be micro-managing it on a 10-minute basis on a 5-day chart. The chart below is the one that I'll continue following to monitor market rotation. If our major indices keep moving higher, but the sustainability ratio charts in the panels below falter, I'll be adding to my QID/SDS. This strategy may not be appropriate for everyone.....or for anyone for that matter. It's simply the way I'm approaching the market. Here's the chart:
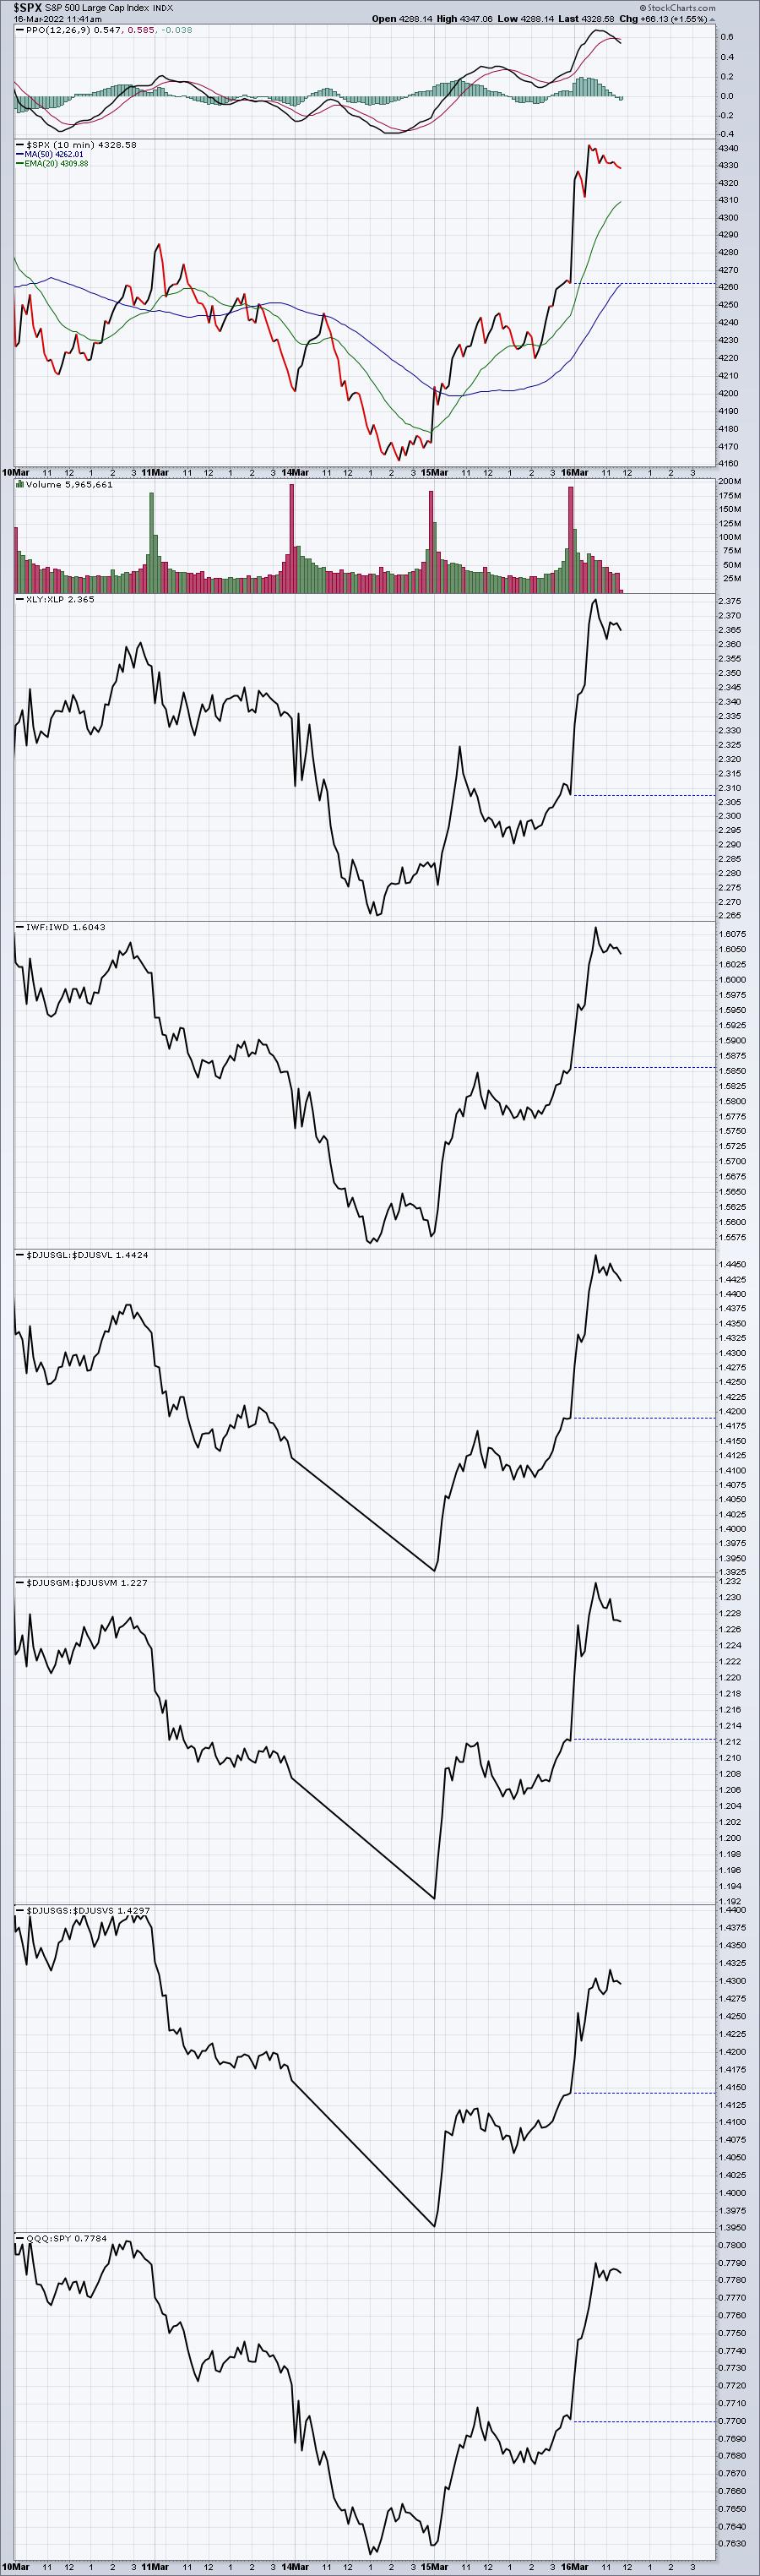
I'm not really seeing any major problems right now, but keep an eye out for any negative divergences - S&P 500 moving higher, while ratios begin to turn lower. That could be a potential reversing signal as Wall Street repositions for another leg lower. The top DOES NOT HAVE TO FORM LIKE THIS, it would simply be a possible signal.
Sector/Industry Focus
It's options expiration week, so that means it's "George Costanza Opposite Week". This is a Seinfeld reference for those of you that may not have watched the sitcom. George was the character where nothing ever seemed to go his way, so in one episode, he does everything OPPOSITE what he would normally do and finds his life improving. Well, options expiration week is a week where things that haven't been working suddenly begin to work. Check out today's sector leaderboard and pay attention to the SCTR scores of today's leaders:
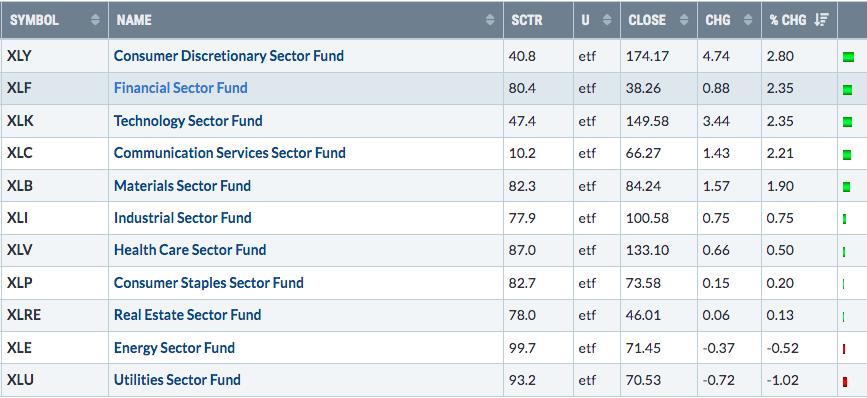
The low-SCTR sectors are performing best, while most high-SCTR sectors are underperforming.
Welcome to Opposite George week.
ChartLists/Strategies
As we bounce during options expiration and into the FOMC announcement, I'd consider looking at the following potential short candidates. Just remember that individual stocks present much higher risks. When I short during a secular bull market - which rarely occurs, by the way - I prefer using leveraged inverse ETFs like the QID (profits 2x from a falling NASDAQ 100, or $NDX) and SDS (profits 2x from a falling S&P 500, or $SPX). But here are individual stocks to consider running the following scan:
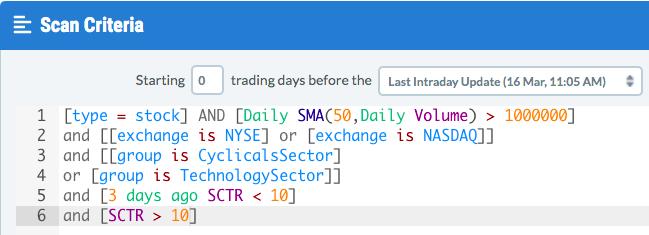
The high volume requirement increases the odds that stocks returned may have option implications this week. The search for just consumer discretionary (cyclicals) and technology is due to growth stocks benefiting more from this short-term bounce and, thus, more likely to fall back if the rally doesn't hold. Finally, at the market low recently, I want to select weak stocks and SCTR scores beneath 10 should provide us that. The SCTR > 10 currently simply means we've seen a bit of an absolute and, likely, relative bounce. Here were the 15 stocks returned:
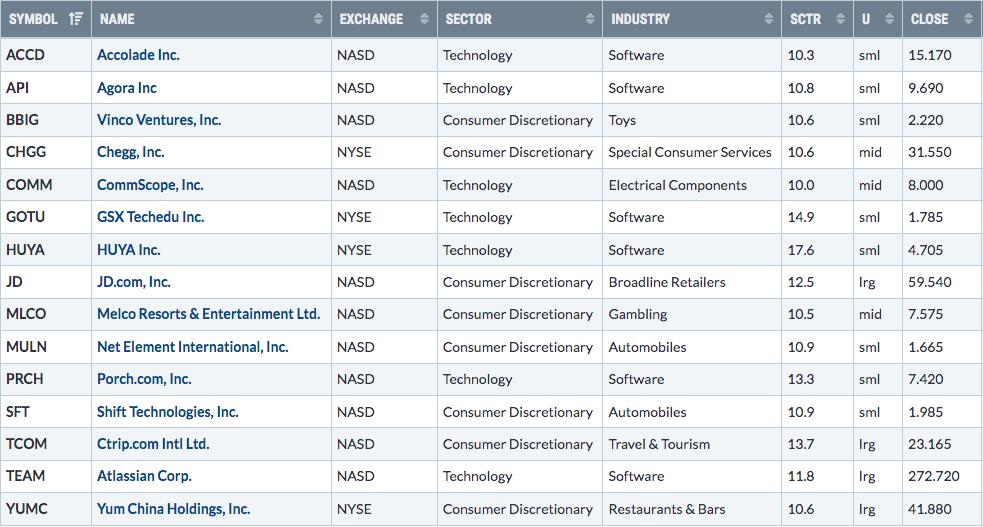
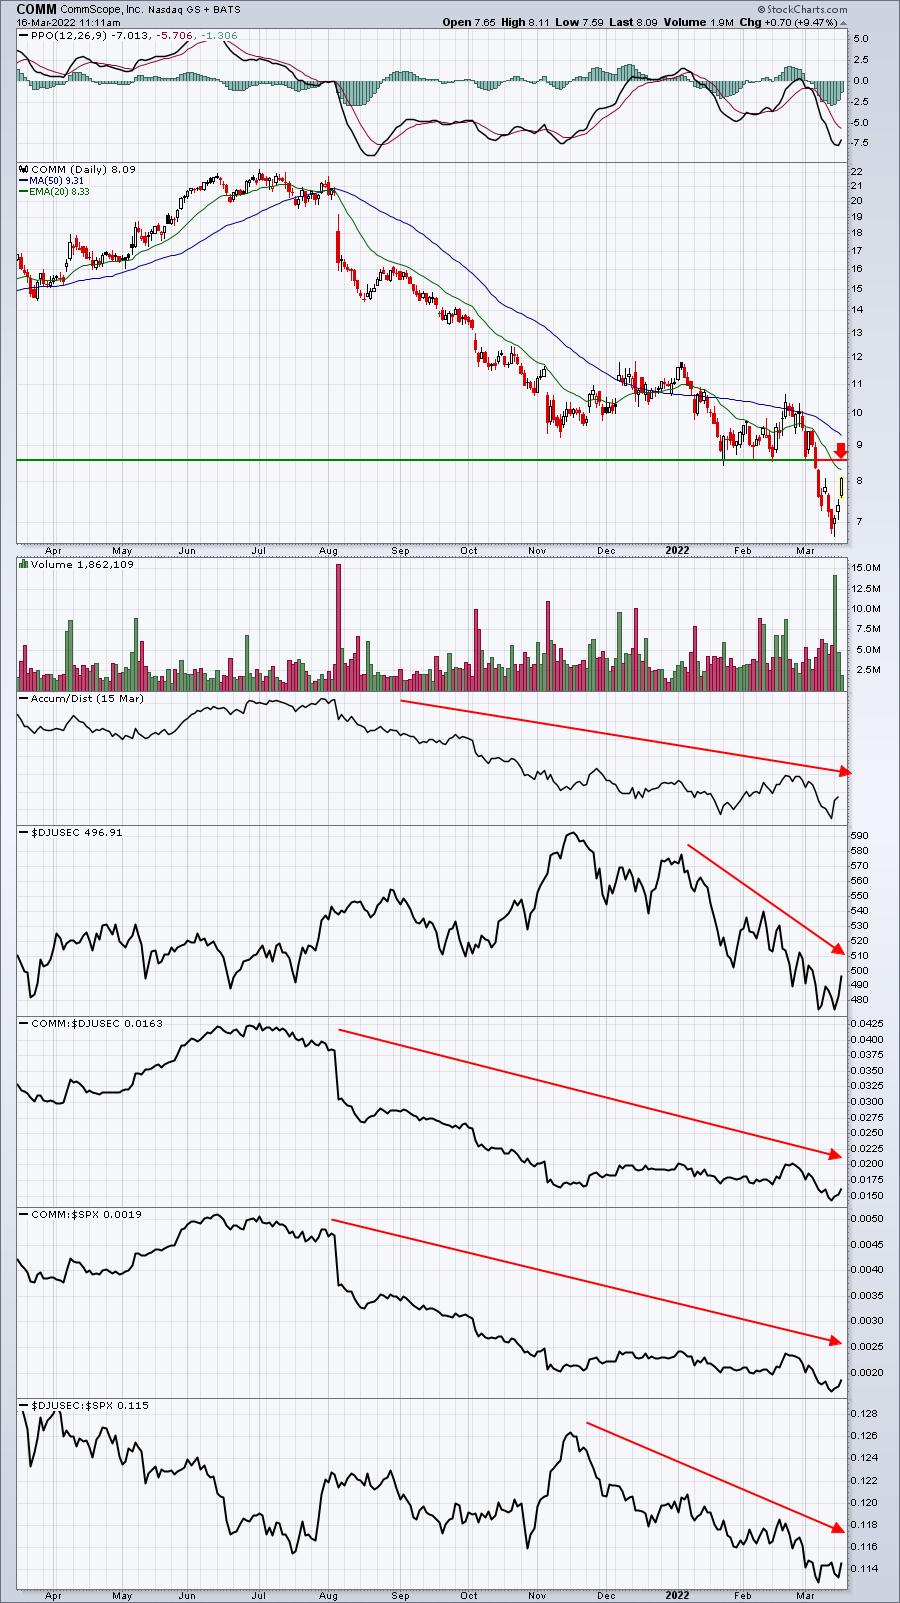
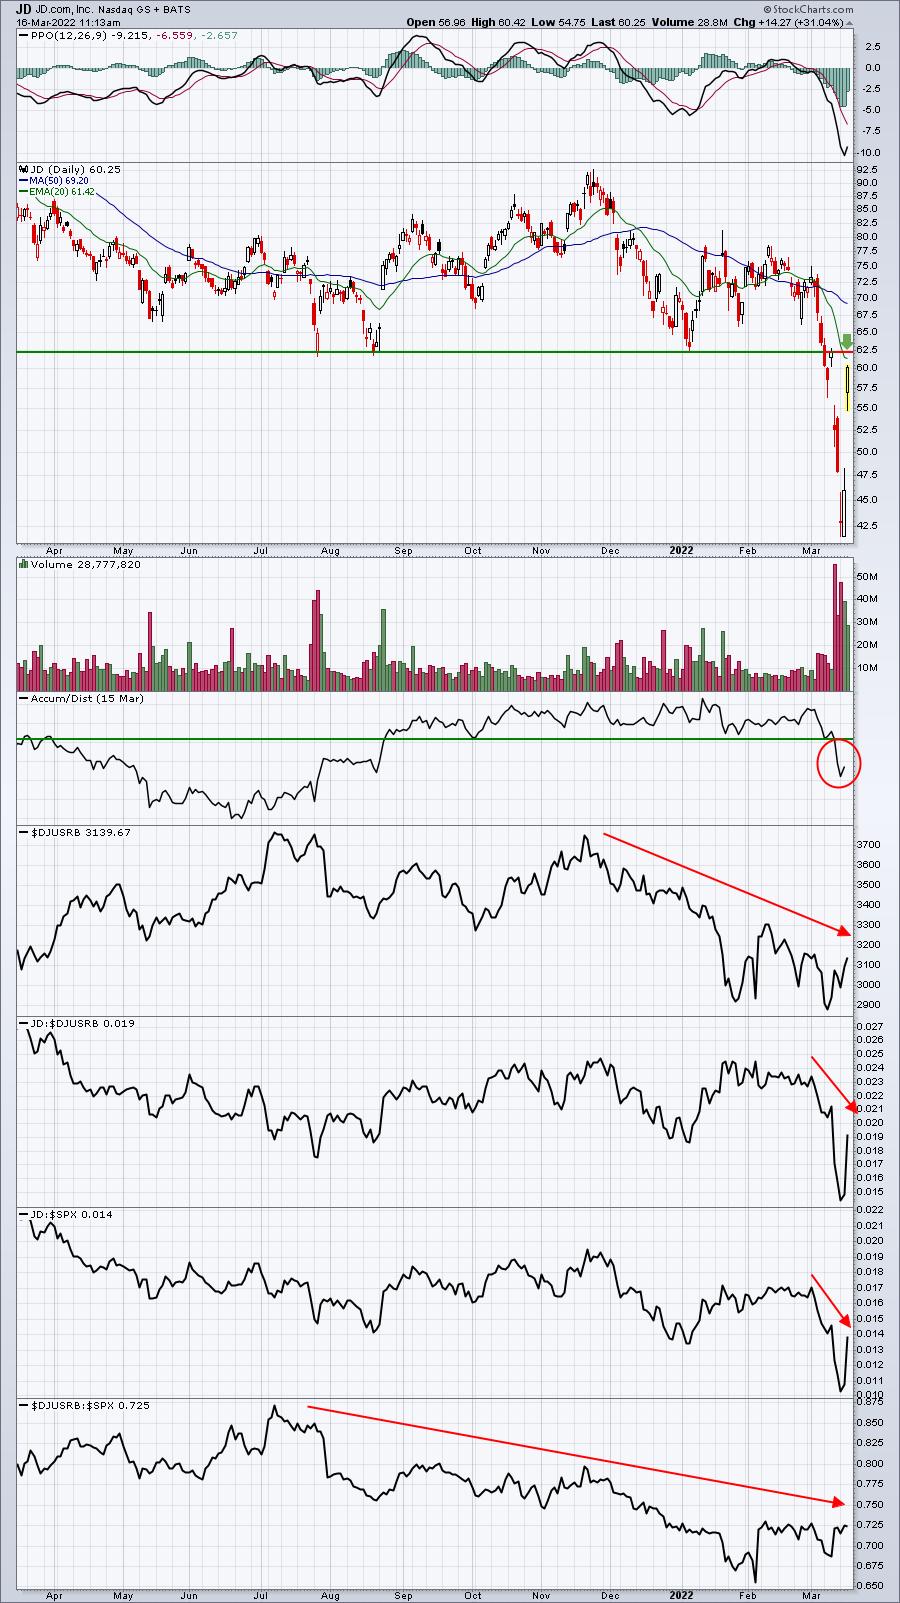
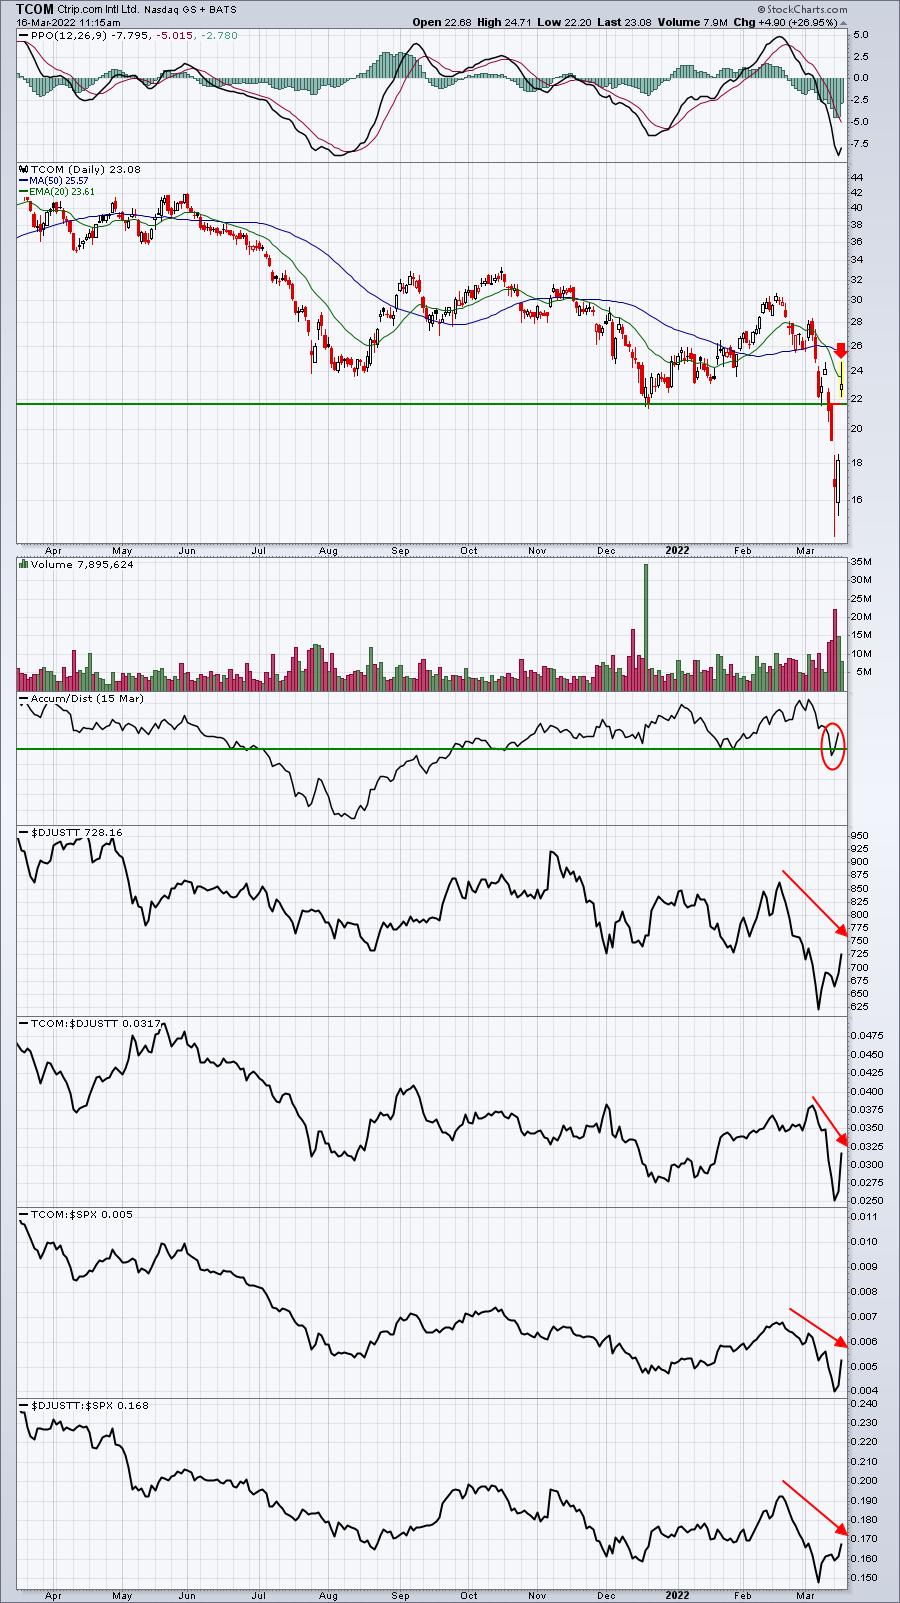
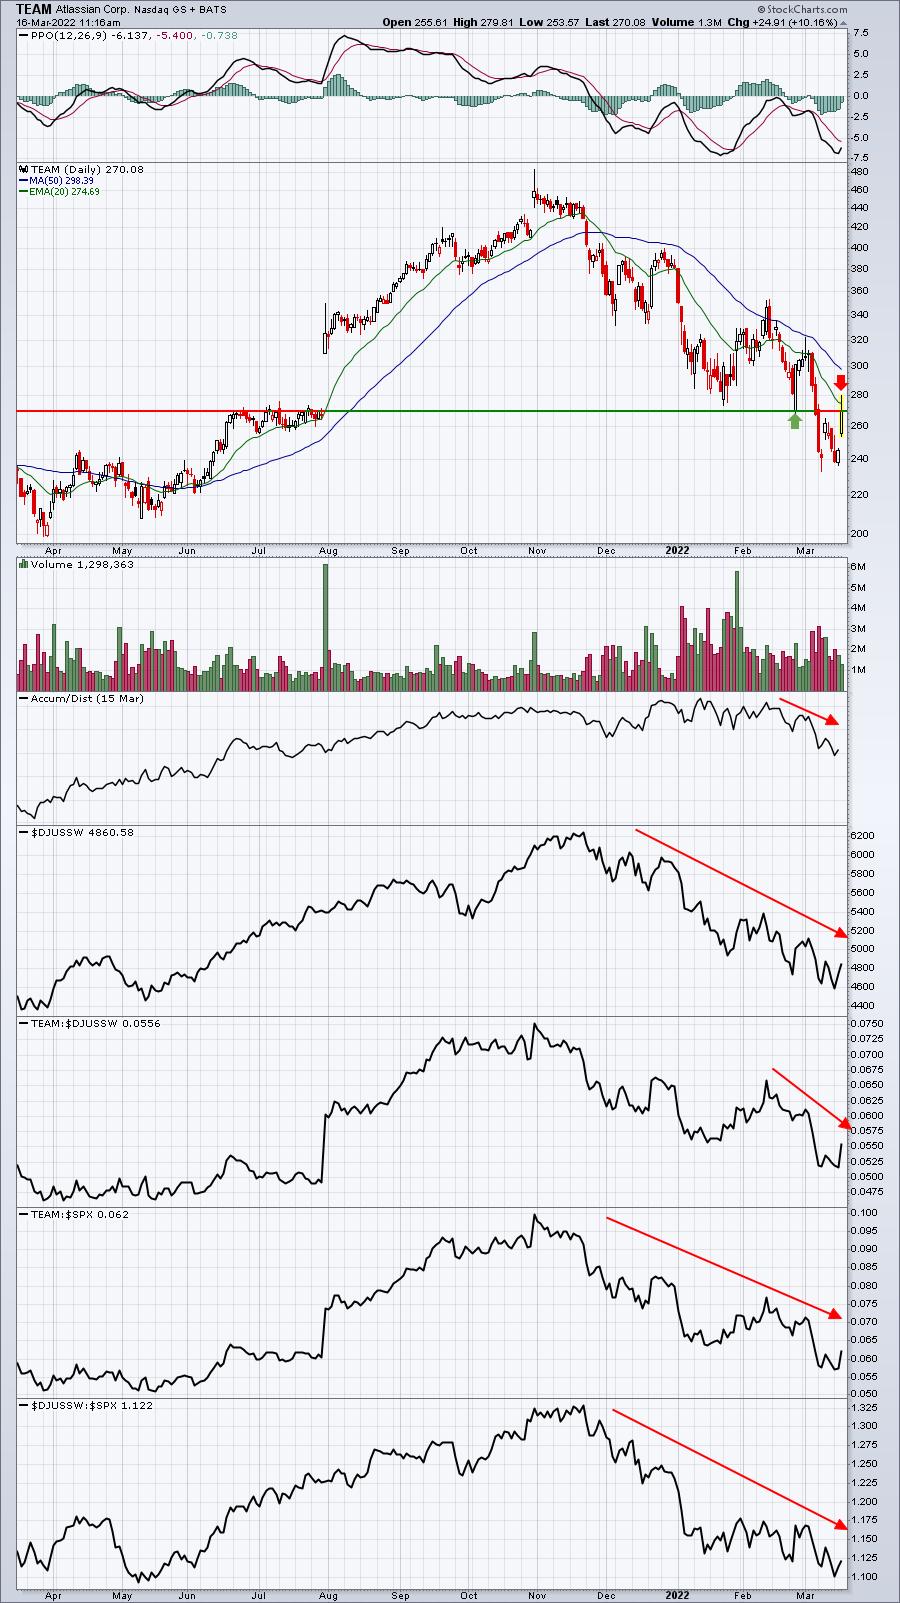
I'd want to be able to enter ANY short position close enough to key resistance so that I can keep my stop reasonably tight. We're in a volatile market, so whipsaw action and quick losses and reversals are definitely to be expected, but I still want to keep my stops as tight as possible and try to avoid big losses. Here are the types of stocks and setups I'd consider:
COMM:
JD:
TCOM:
TEAM:
YUMC:
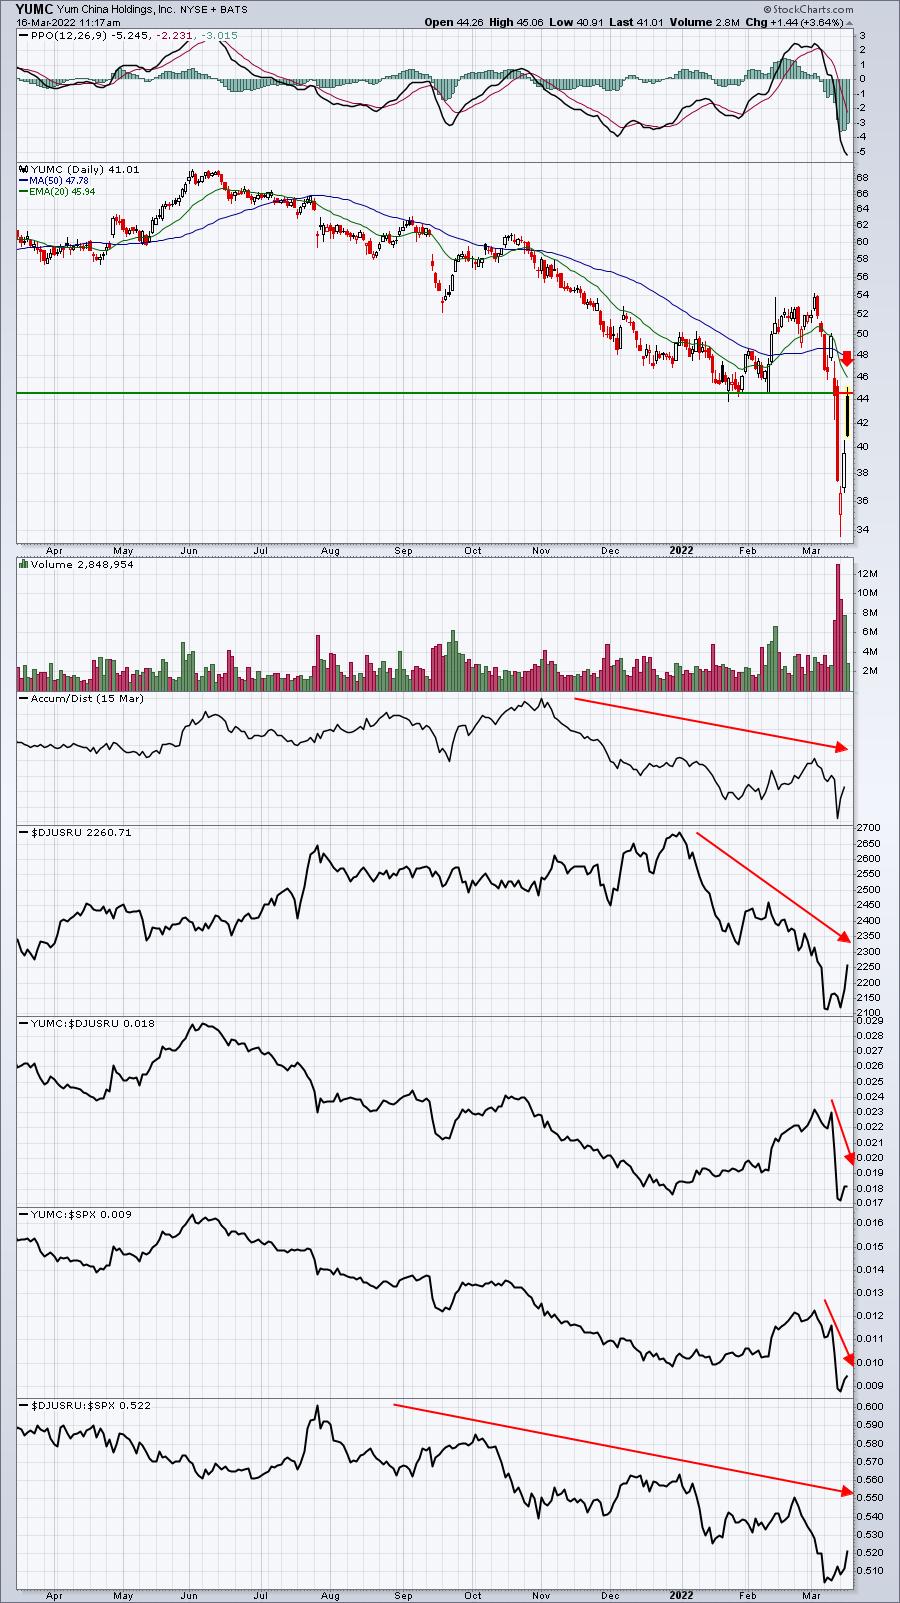
These are provided just to give you visuals of what I'd be looking for to short. Price breakdowns where price action has rebounded back to price resistance and/or 20-day EMA resistance provide excellent reward to risk opportunities on the short side, but they don't mean they'll necessarily work. If the overall market continues to push higher and a bottom is in, then short positions will most likely backfire. I believe we're going lower again, but it's just my opinion.
Earnings Reports
Here are the key earnings reports for the next two days, featuring stocks with market caps of more than $10 billion. I also include a few select companies with market caps below $10 billion. Finally, any portfolio stocks that will be reporting results are highlighted in BOLD. If you decide to hold a stock into earnings, please understand the significant short-term risk that you are taking. Please be sure to check for earnings dates for any companies you own or are considering owning.
Wednesday, March 16:
LEN, EDR, ZTO, WSM, JBL, SMTC, PD, GES
Thursday, March 17:
ACN, FDX, DG, GME, CMC, SIG, STNE, CSIQ, GIII, SCWX
Economic Reports
February retail sales: +0.4% (actual) vs. +0.3% (estimate)
February retail sales less autos: +0.2% (actual) vs. +0.6% (estimate)
January business inventories: +1.1% (actual) vs. +1.1% (estimate)
March housing market index: 79 (actual) vs. 81 (estimate)
FOMC policy statement due out at 2:oo pm ET
Happy trading!
Tom