
EB Daily Market Report - Friday, March 18, 2022
I'm continuing to travel today and will be over the weekend as well. Once again, today's DMR will be somewhat different and I'm not sure what time this weekend's EB Weekly Portfolio Report will be issued because of my travel schedule.
For today, I want to share two primary thoughts with you.
The Max Pain Rally
What do we always talk about with respect to Max Pain? That anything is possible, right? Who honestly thought that when the QQQ and SPY closed on Monday at 318.17 and 417.00, respectively, that they'd both be approaching max pain levels of 354.76 and 443.79, respectively? There was $5 BILLION in net in-the-money put premium on just these two ETFs that would effectively be wiped out with that rally!!!
The QQQ is now 344.44 and the SPY is now 441.07. Do you realize that based on the number of outstanding calls and puts from Tuesday that this net put premium is now under $1 billion? Doesn't this amaze you? This is EXACTLY why we look at max pain every month. On Tuesday night, I basically began by saying that I'd NEVER seen so much net in-the-money put premium on the table heading into options expiration Friday. The market makers were heavily incentivized to drive prices higher. When was the last time you saw ANY market around the globe react positively to a central bank saying they were going to raise interest rates 9 times???? The initial reaction, as we might have expected, was HORRIBLE. But then there was this thing called options-expiration Friday that was still ahead of us and, magically, all those post-Fed meeting losses disappeared! VOILA!!!
What I said on Tuesday was that the risk to short was WAY too high at that time because of the financial incentive for market makers to drive stock prices higher, especially those heavily traded in the options world - consumer discretionary (XLY) and technology (XLK). So how did those two sectors (and all the other sectors) perform since Monday's low? Well check out this Excel table that I prepared:
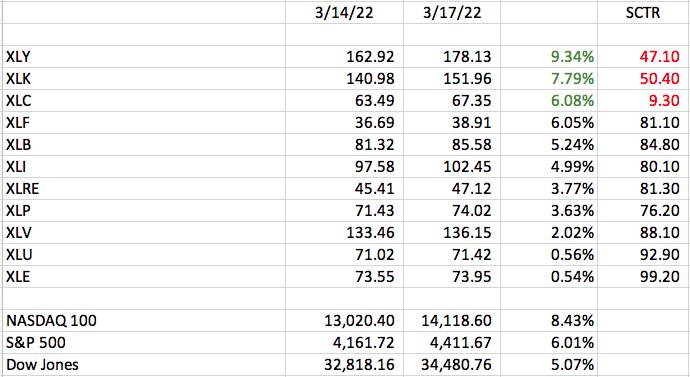
The XLY, XLK, and XLC finally caught a bid. Isn't that wonderful? They have the 3 lowest SCTR scores. Meanwhile, the two sectors with the highest SCTR scores, XLE and XLU, didn't really gain anything from Monday's low. What a coinkydink!
Welcome to "Opposite George" (Seinfeldism) week! It's max pain week, the week where the stock market gets turned upside down. Whatever wasn't working starts to work and whatever was working suddenly isn't. Crazy, isn't it?
While I was not a fan of shorting the market earlier this week, I'm now a fan. There is no certainty that the stock market will turn lower again. However, at least we know there is now little short-term financial incentive for market makers to steal everyone's options premium.
Max Pain Revisited
As the number of calls and puts continue to be traded throughout the week and as prices change, the max pain will naturally move throughout the week as well. Because the QQQ still has another 10 bucks to the max pain level of 354 calculated on Tuesday, I thought I'd recalculate max pain for the QQQ. Max pain has fallen slightly from 354.76 to 353.83 and the net in-the-money put premium, which stood at $2.7 billion at Monday's close, is now just $660 million. Based on this, there's still certainly the possibility that we move higher one more day, but we'll see. There's definitely much less incentive for options to drive prices higher, so now let's see if Wall Street is truly bullish about 9 rate hikes ahead. I doubt it.
Here are two charts of the S&P 500 to watch from a price perspective:
$SPX Daily Chart:
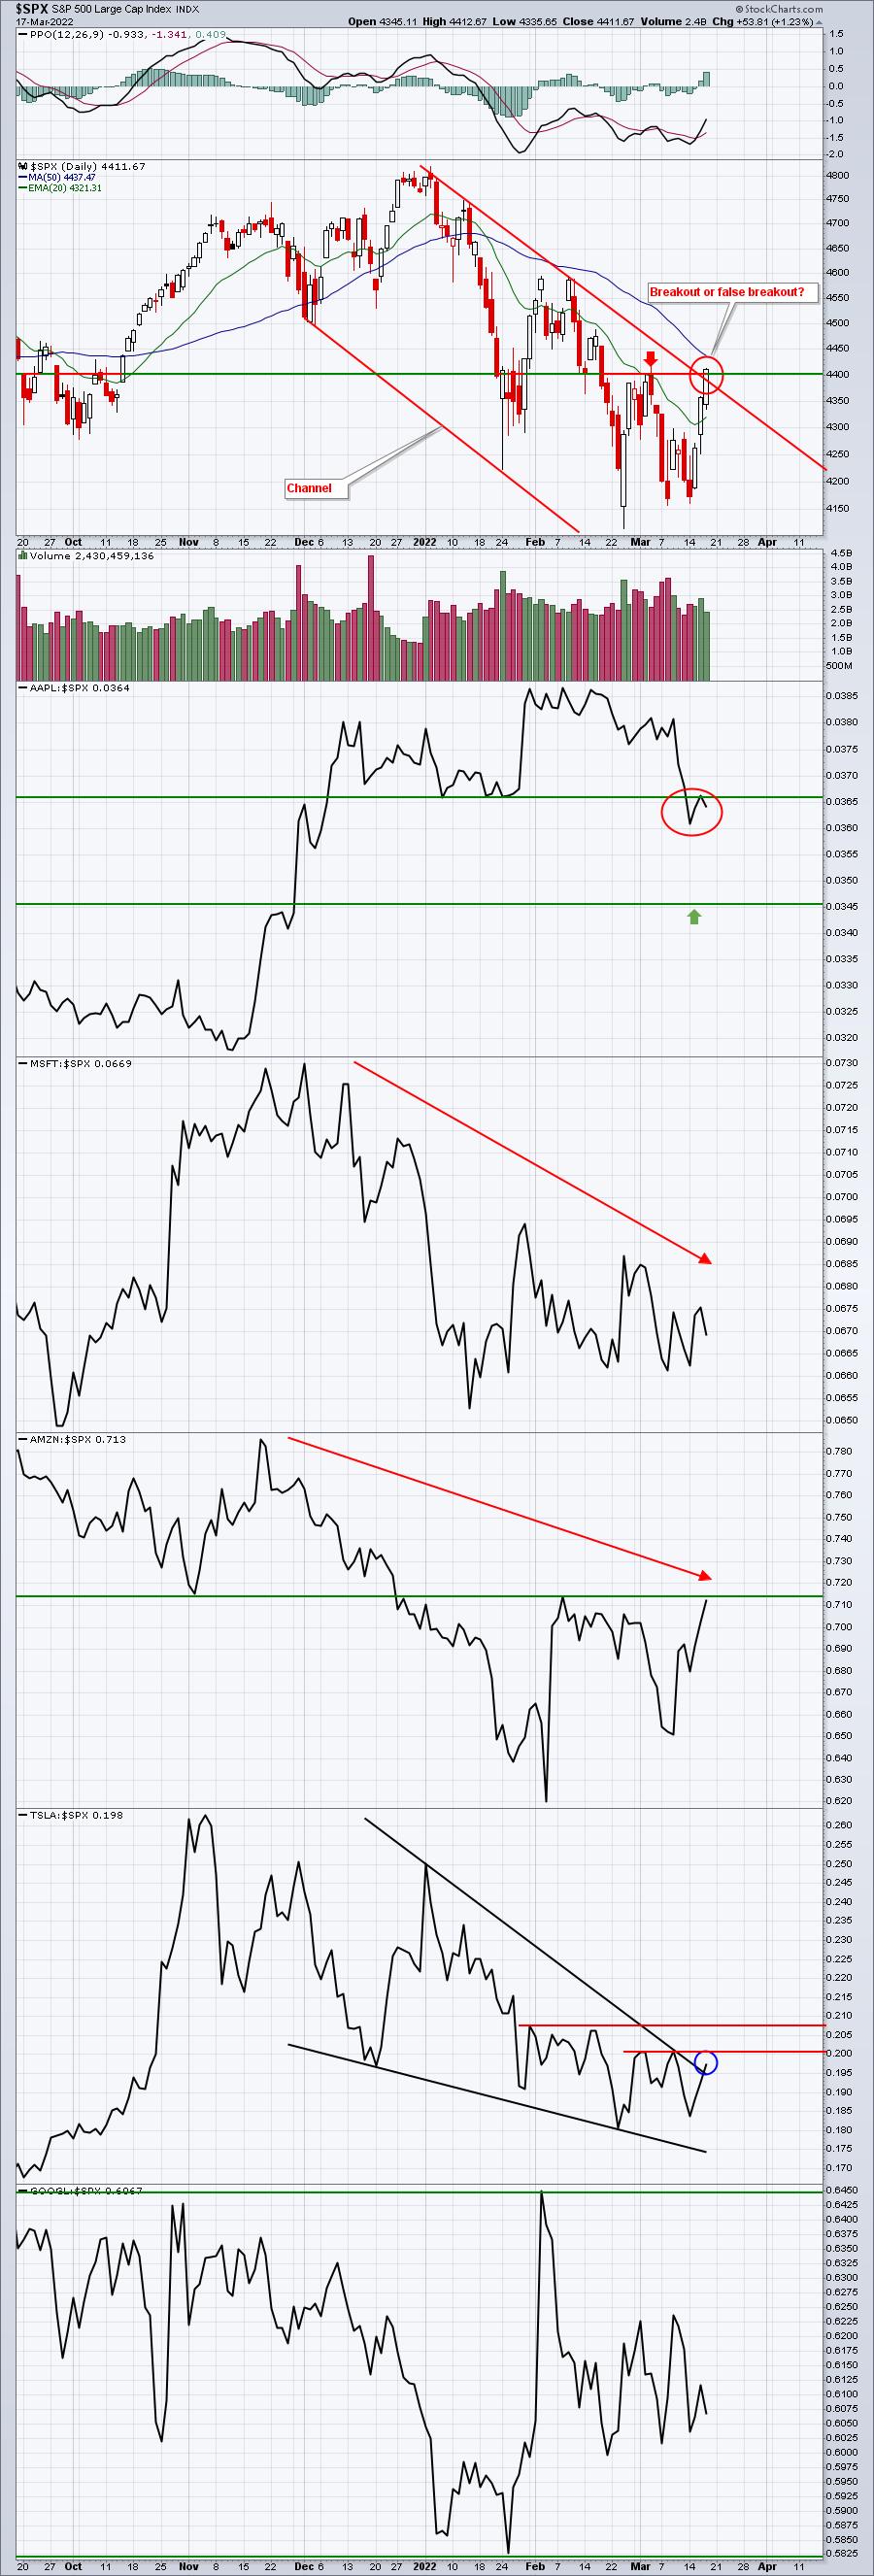
The very first thing I see here is a potential breakout to the upside from the 3-month down channel. If it wasn't max pain week, I'd be much more excited by the move. Maybe it turns out to be the real deal, but I have to at least question market maker motives this week. Second, AAPL, which is the leader of the S&P 500, hasn't exactly been flying this week. Yes, it's recovered some, but I would have thought AAPL would have snapped back much more than it has. Its relative strength line still looks like it's weakening to me.
Probably the biggest issue, however, isn't appearing on this daily chart. It's the 20-week EMA shown below.
$SPX Weekly Chart:
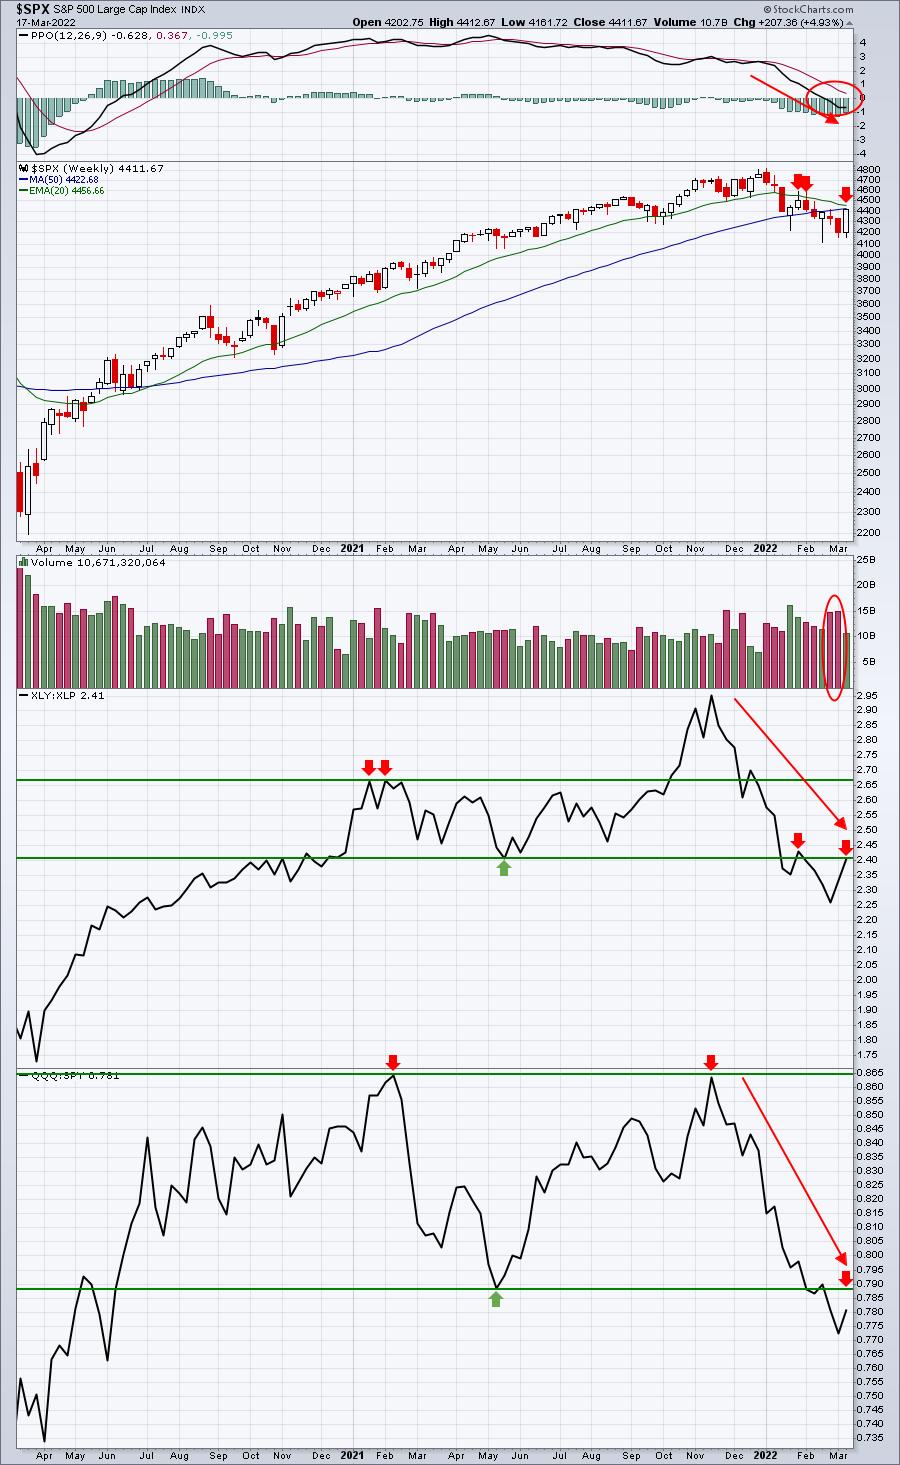
I do believe we're in a secular bull market and eventually we break to new all-time highs - probably later this year or in 2023. Short-term, however, I still think it's VERY dicey. I don't want to be stubborn and not recognize the resumption of strength, but I do think we have to understand this strength is coming during max pain week. I've seen it all before. I promise to re-evaluate the market next week if this current strength continues next week. But I'm thinking the strength is nearing its end.
We'll see.
I should be back to my normal DMRs next week. Have a great weekend!
Happy trading!
Tom