
EB Daily Market Report - Thursday, March 24, 2022
Q1 2022 Market Update ChartList
The recording for last night's Q1 2022 Market Update is available on our website, if you were unable to attend yesterday. Feel free to review it at your leisure. In addition, the ChartList that I used to organize all the charts for yesterday's session is now available on our website as well for your viewing/downloading pleasure.
Executive Market Summary
- Futures were higher overnight, though we've seen a slight shift in strength away from growth stocks - at least at the small- and mid-cap levels
- Crude oil ($WTIC) is lower by 2.5% to $112 per barrel
- The 10-year treasury yield ($TNX) opened higher at 2.37%, but has returned to the flat level on the session
- Cryptocurrencies are having a strong day with etherium ($ETHUSD) jumping more than 4%
- Gold ($GOLD) has climbed $26 per ounce to $1963, while copper ($COPPER) is fractionally lower
- All 11 sectors are higher today, though consumer discretionary (XLY, +0.08%) is notably lagging; home construction ($DJUSHB, -1.25%) remains under pressure
- KB Homes (KBH, -4.27%), a homebuilder, reported quarterly results that missed estimates, creating that negative environment for the group
- NVIDIA (NVDA, +8.02%) leads the S&P 500 and a very strong semiconductor group ($DJUSSC, +4.88%)
Market Outlook
For the first time since last Monday (10 days ago), our major indices finished weak, closing near their lows of the day. It's too early to say this signals another leg down, but there are key support areas to consider. Let's start with the QQQ 60-minute chart where the weakness is following a negative divergence:
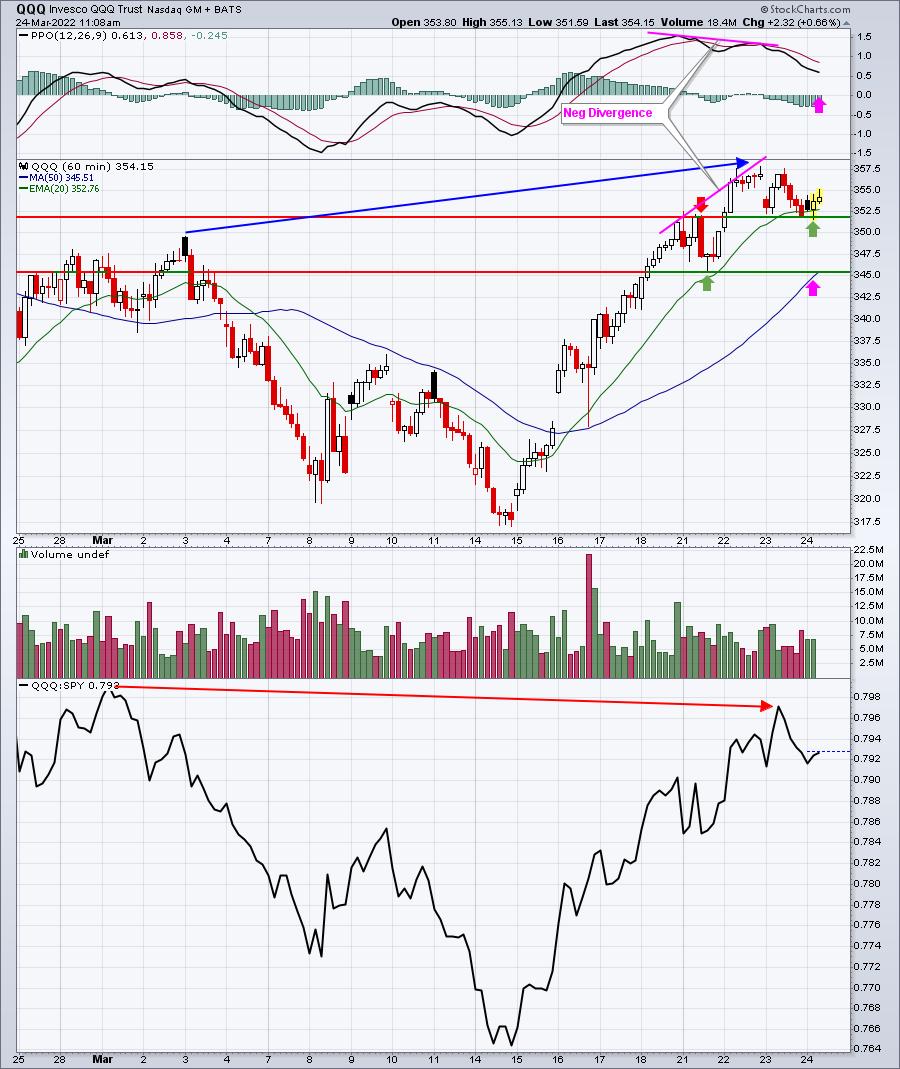
The QQQ is attempting to bounce off its 20-hour EMA, which is a positive, but it's doing so with a very weak hourly PPO. Another high would just result in yet another negative divergence. Keep in mind that divergences, like any other technical signal, provides us no guarantees. It's simply a sign that short-term positive momentum is weakening. It's entirely possible that the QQQ accelerates to the upside and its hourly PPO wipes out the negative divergence. But the negative divergence does suggest that the odds are greater that we'll see a pullback. The pink arrows mark a "minimum" type of pullback to "reset" the PPO at centerline support and to see a possible 50-hour SMA test. That would also test Monday's low just above that 345 level.
It's also worth noting on this hourly chart that the QQQ has moved higher to surpass its price level from a month ago. However, the QQQ's relative strength vs. the SPY has not. From this analysis, we can conclude that the last month's action has resulted in Wall Street moving a bit more defensively toward the S&P 500 vs. the more aggressive NASDAQ 100.
Now let's take this one step further and look at the QQQ daily chart:
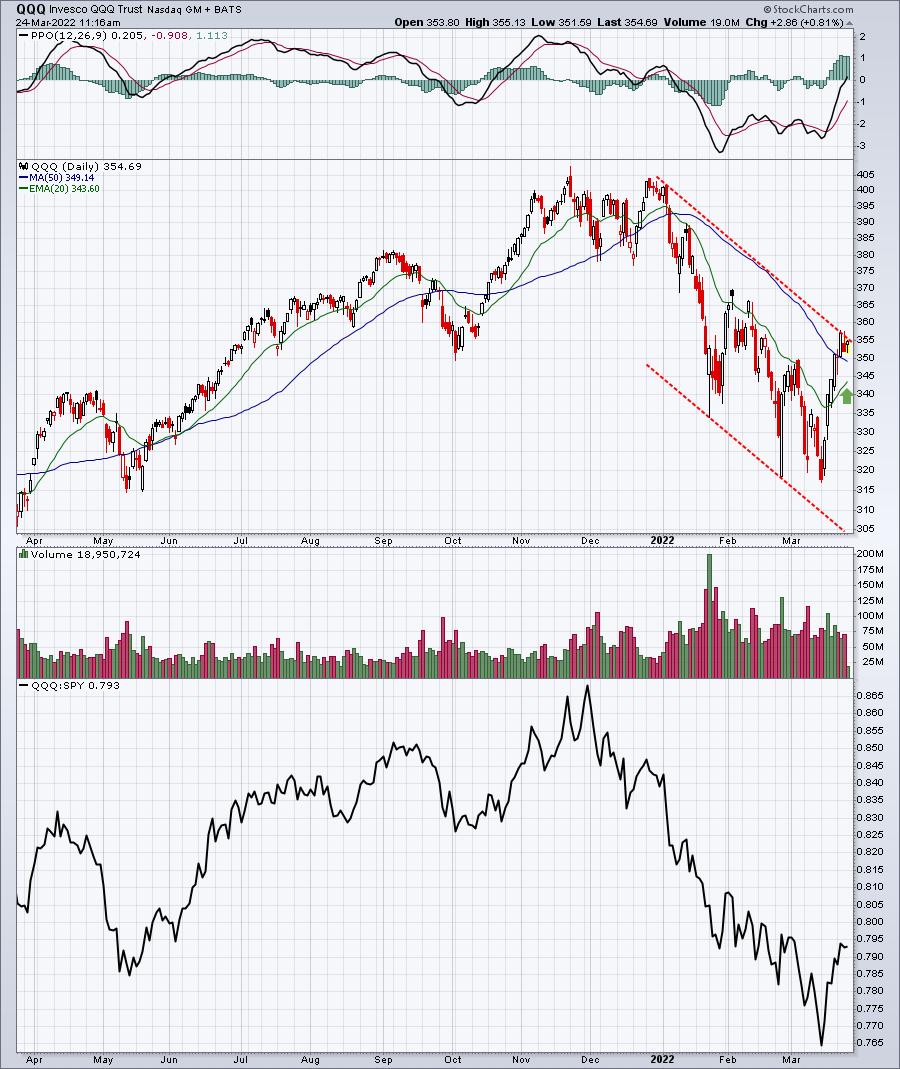
Couple points here. First, if I connect the high from the beginning of the year to Tuesday's close, and then drag that same sloped line to the initial January 24th low, notice that it also connects the low from February 24th. So while the S&P 500 saw its down channel broken this week, the QQQ's does still remain alive, depending on how we close today. I also show a green arrow that highlights the rising 20-day EMA, currently at 343.60. Given the hourly support shown previously just above 345, I think we can conclude that key price support resides now in that 343.60-345.00 area. Loss of that level would significantly increase the odds of another severe decline.
Sector/Industry Focus
Semiconductors ($DJUSSC) are showing excellent strength today, trying to break out above the high established on Tuesday. There's no doubt that such a breakout from a very influential area of the market would help our key indices do the same. Failure on the breakout, however, could trigger the opposite effect. Check out this 3-month hourly chart:
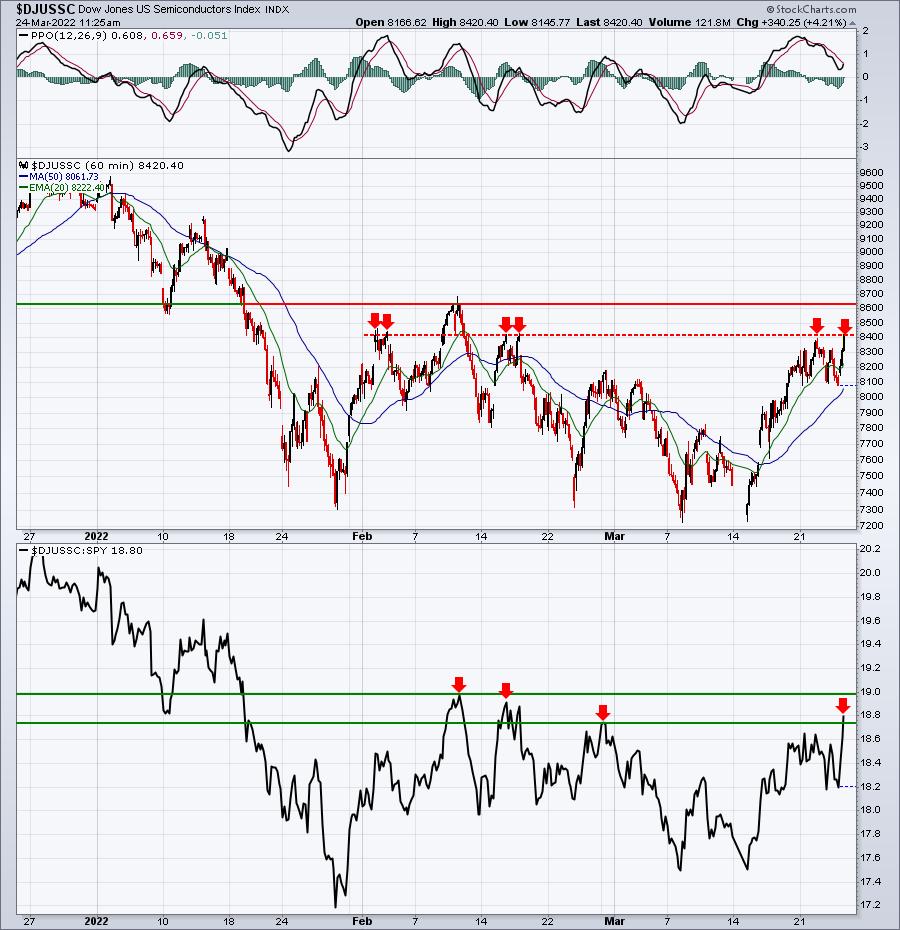
The past two months show a number of key absolute and relative resistance levels. Breaking above all of them would be very bullish for this group and would most definitely put a check mark in the column of the market bottom already being established.
ChartLists/Strategies
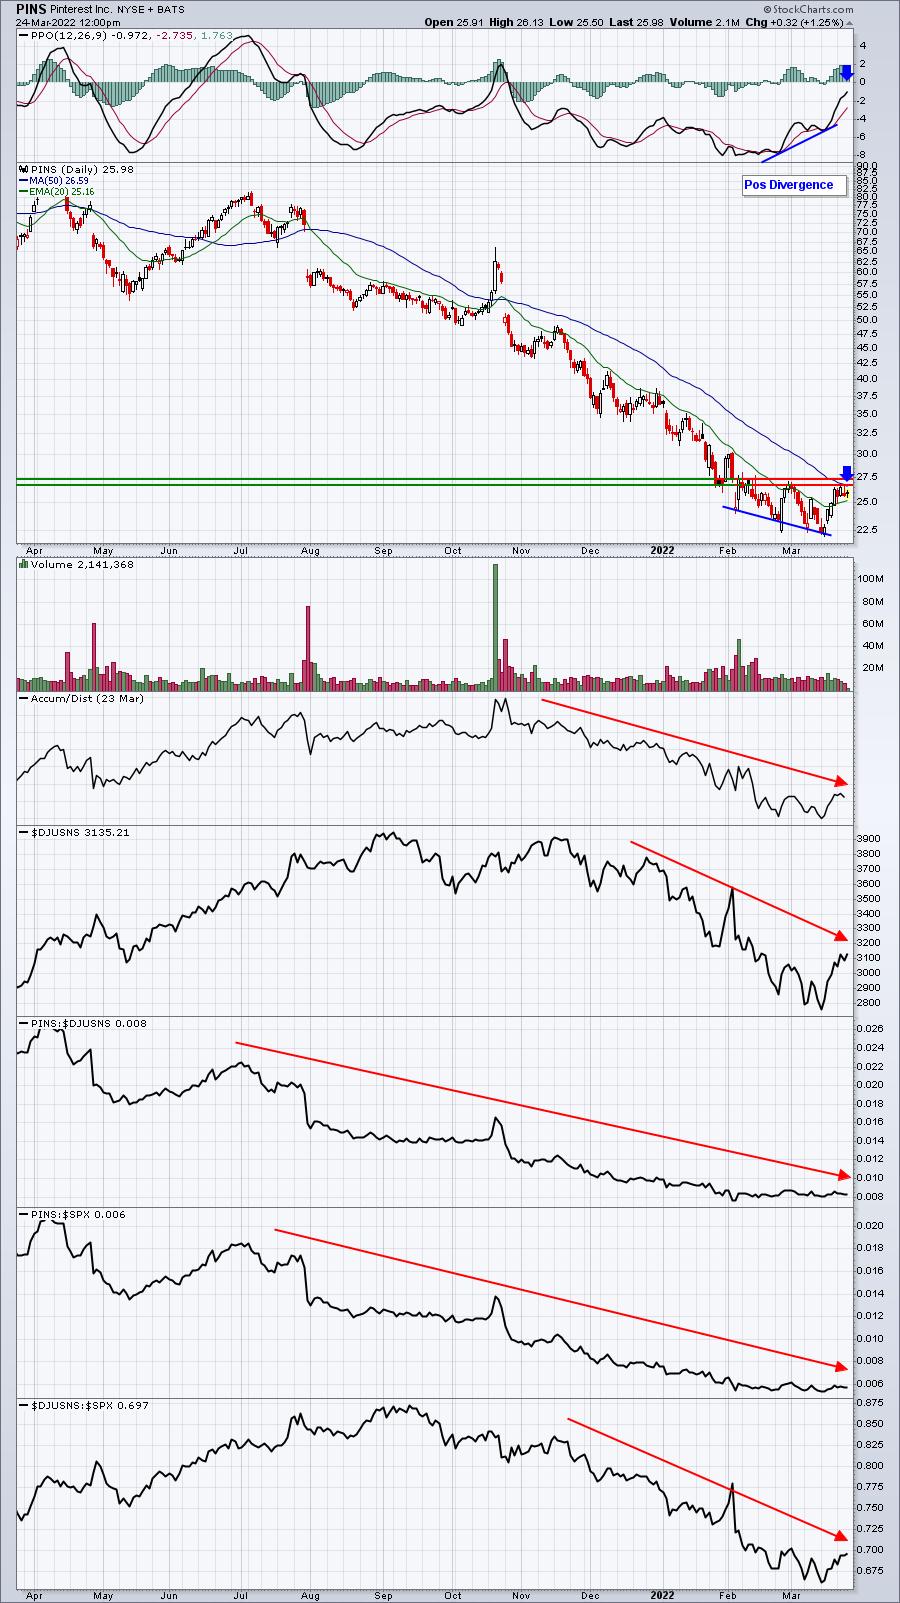
I ran an Uptrend Reversal scan, searching for stocks that have shown a series of higher daily lows, but reversed that streak and today printed a lower low. It doesn't mean these stocks will go lower. It simply highlights the fact that a new downtrend could be beginning.
Here were two stocks off from this scan:
PINS:
LMND:
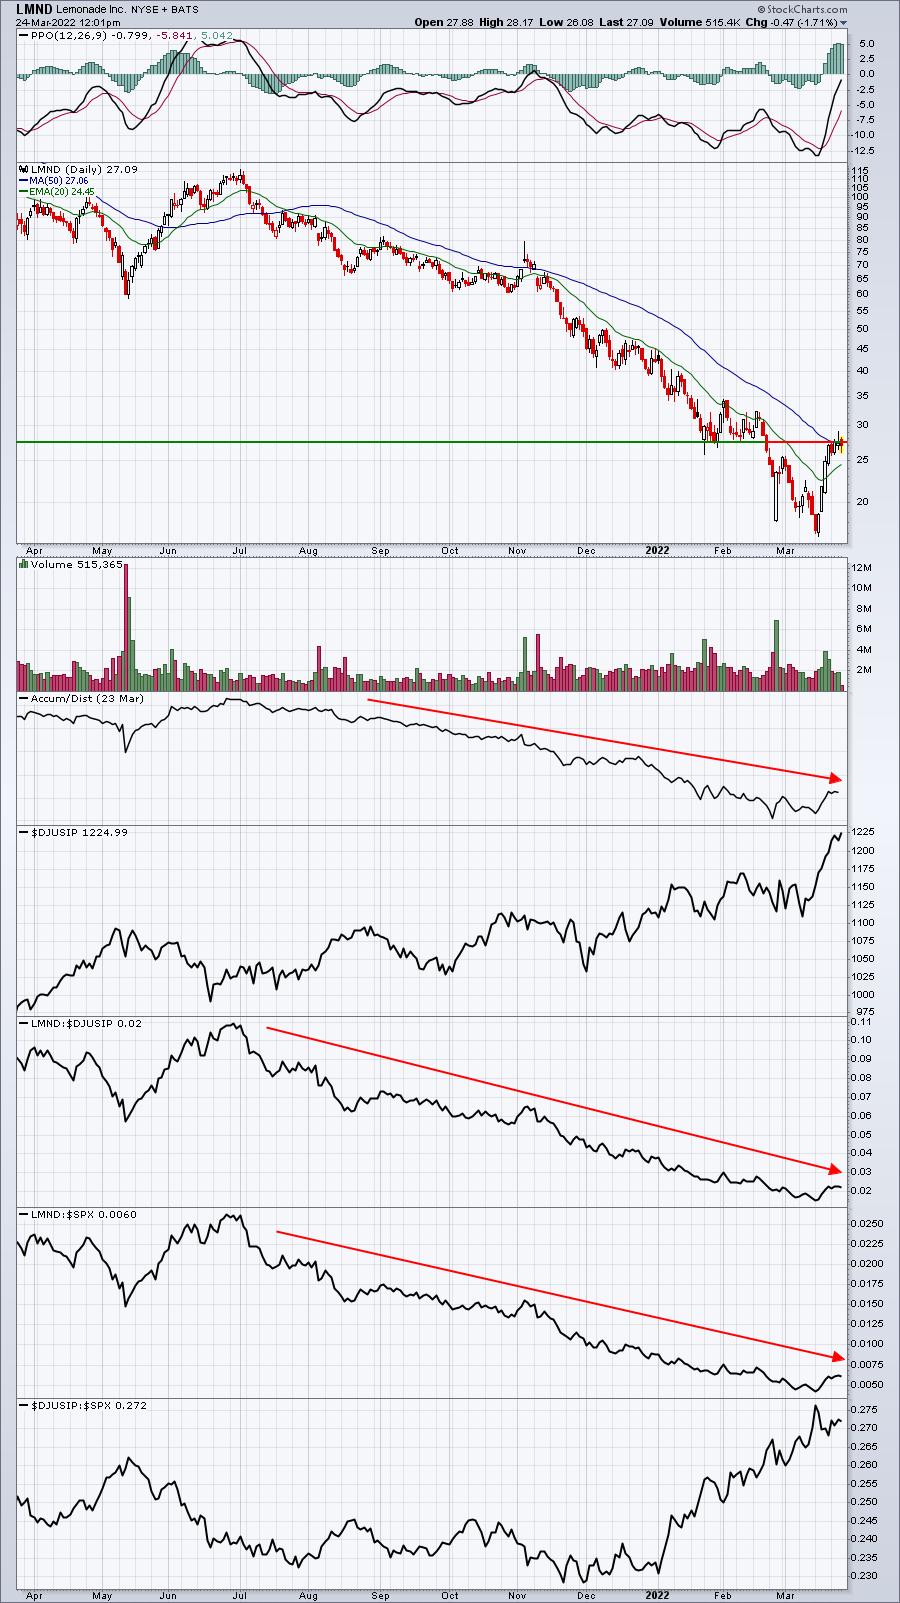
Both of these charts have common characteristics. First, they're both clearly downtrending. They also continue to show signs of distribution. They're also both very weak on a relative basis vs. their industry peers. The horizontal lines drawn show key price resistance. Shorting at or near this resistance with a fairly tight closing stop is the way I'd approach both stocks.
Earnings Reports
Here are the key earnings reports for the next two days, featuring stocks with market caps of more than $10 billion. I also include a few select companies with market caps below $10 billion. Finally, any portfolio stocks that will be reporting results are highlighted in BOLD. If you decide to hold a stock into earnings, please understand the significant short-term risk that you are taking. Please be sure to check for earnings dates for any companies you own or are considering owning.
Thursday, March 24:
DRI, FDS, SNX, NEOG, KC, MOMO
Friday, March 25:
None
Economic Reports
February durable goods: -2.2% (actual) vs. -0.5% (estimate)
February durable goods ex-transports: -0.6% (actual) vs. +0.5% (estimate)
Initial jobless claims: 187,000 (actual) vs. 215,000 (estimate)
March PMI manufacturing: 58.5 (actual) vs. 56.6 (estimate)
March PMI services: 58.9 (actual) vs. 56.0 (estimate)
Happy trading!
Tom