
EB Daily Market Report - Friday, March 25, 2022
Executive Market Summary
- Futures were higher overnight and our major indices began the day in positive territory
- Intraday we've seen selling return and our indices are all mostly negative now
- The 10-year treasury yield ($TNX) is up 15 basis points (!!!) to 2.49%
- The rise in yields has begun to spook growth stocks as many growth indices are down more than 1%; the IWF (ETF tracking the mega cap growth stocks) is down 0.81%
- The Volatility Index ($VIX, +2.95%) hit a low of 20.90 earlier, but is now 22.31; the 20 level was where the VIX was at the last short-term S&P 500 top on February 9th
- Bitcoin ($BTCUSD, +1.43%) is nearing MAJOR price resistance at 45,000; consider taking profits and seeing if this crypto can clear that key price resistance
- Energy (XLE, +1.93%) and defensive sectors are outperforming today, while technology (XLK, -1.03%) and consumer discretionary (XLY, -0.76%) return to their 2022 underperforming ways
- Moderna (MRNA - 8.15%) and Etsy (ETSY, -7.07%) are among today's worst S&P 500 performers as growth stocks sell off
Market Outlook
A volatile market is an unpredictable market, by definition. Trying to figure out the day-to-day moves is nearly impossible. The biggest upside move occurred as we were on the verge of a major price breakdown and nervousness was at a 2022 high. Now we've seen a huge rally off the bottom and the options world is acting as if we have no problems. Check out this 5-day moving average of the equity-only put call ratio:
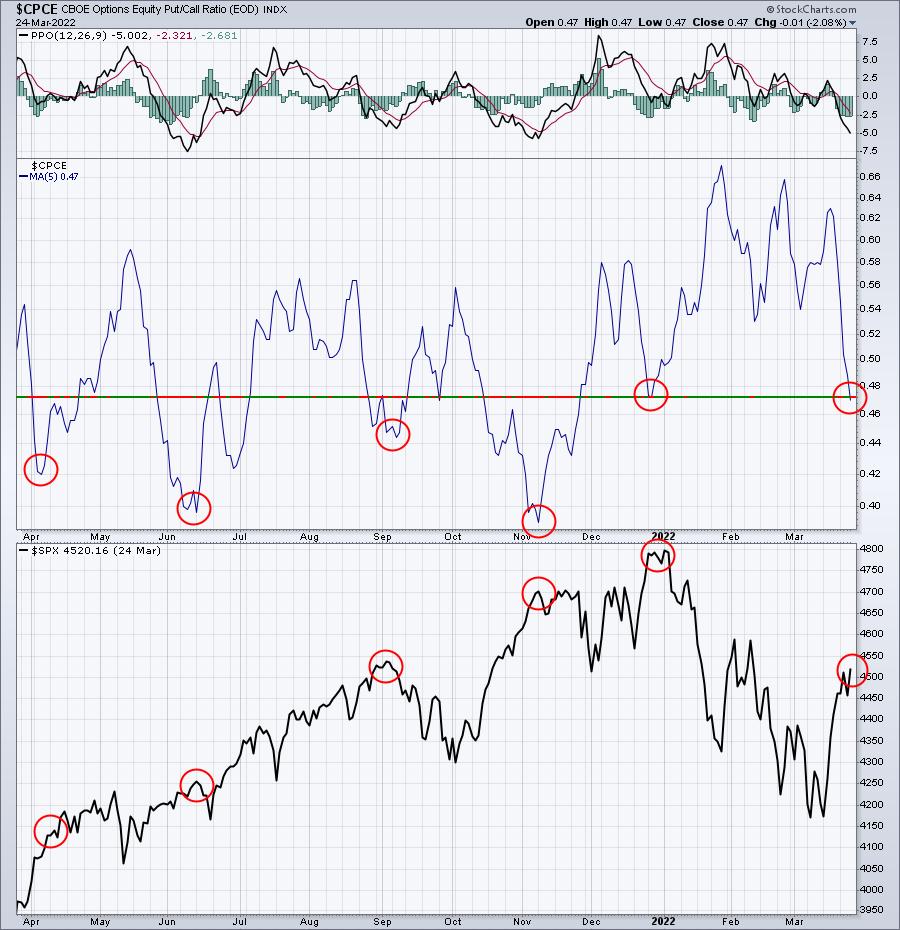
This isn't a guarantee of future price direction, but it does help to explain the difficulty of believing this rally just keeps spiraling higher. We've had a nice rally, likely spurred by the huge value of March net in-the-money put premium. But is that it? Is our downside over? That's a difficult question to answer, though the higher this rally goes, the less likely we'll see a break below the February low. On the S&P 500, here's the series of lower highs and lower lows to watch. If Point 2 is cleared, the intermediate-term downtrend is effectively squashed and I'd be viewing 2022 more as a period of consolidation as we move forward. So check it out:
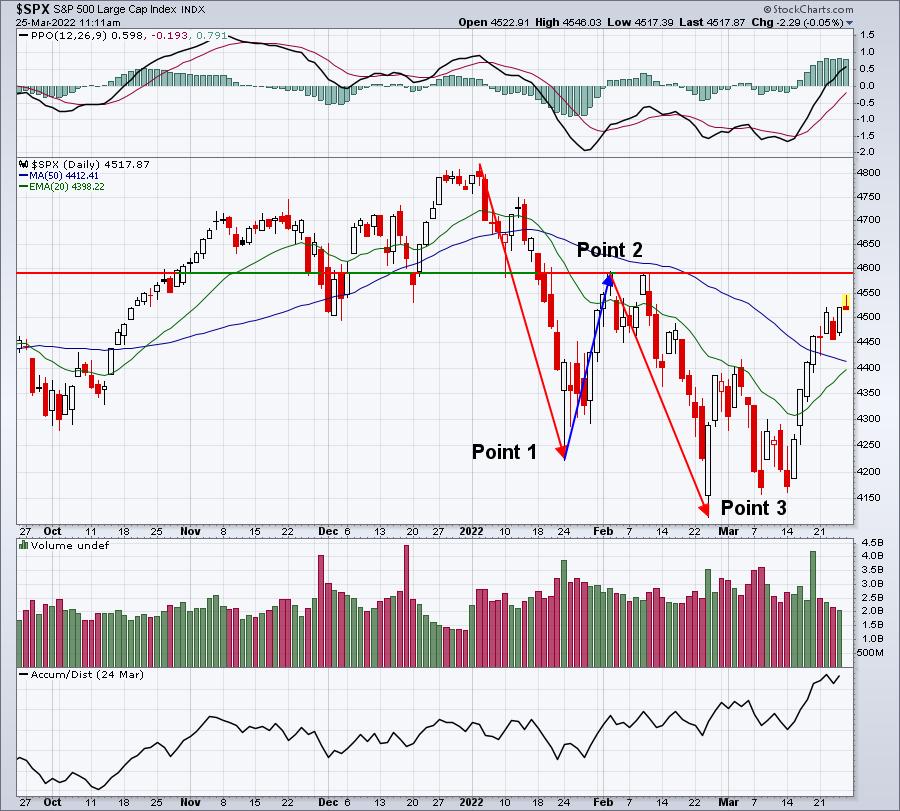
Bottom line: I believe this rally and the rising AD line are both great signals for my call of this being short-term weakness and the fact that we remain in a secular bull market. But it does not guarantee that the short-term weakness is over for U.S. equities.
Sector/Industry Focus
Consumer staples (XLP) have been strong during this rally, but the sector is now testing key downtrend line resistance:
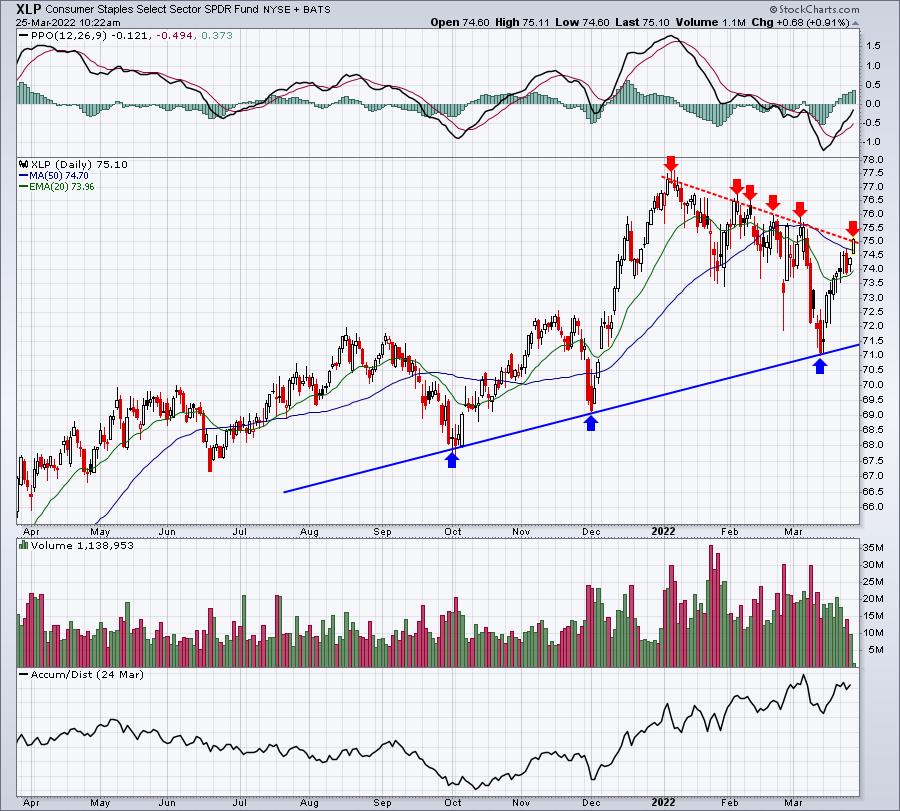
Trend lines are only as strong as the number of points they connect. I see technicians all the time connecting two points on a chart and calling it a trend line. That is NOT a strong trend line. Literally, we could connect two points all the time. I believe a trend line MUST connect at least three points to be valid. Also, you need to be aware of the slope of the trend line. A trend line that even connects three or more price points will very likely break if price action is moving higher at a 10% per month clip. That's unsustainable. Therefore, long-term trend lines that slope higher at a more sustainable pace are MUCH more reliable and tradable, in my opinion.
Looking at the above short-term downtrend line, it connects many, many points, so it would be notable if the XLP could finish strong today and clear this trend line. However, there's a downside to this behavior. In the chart below, you can see the QQQ trying to push to new highs, but with not a lot of support from our key sustainability ratios:
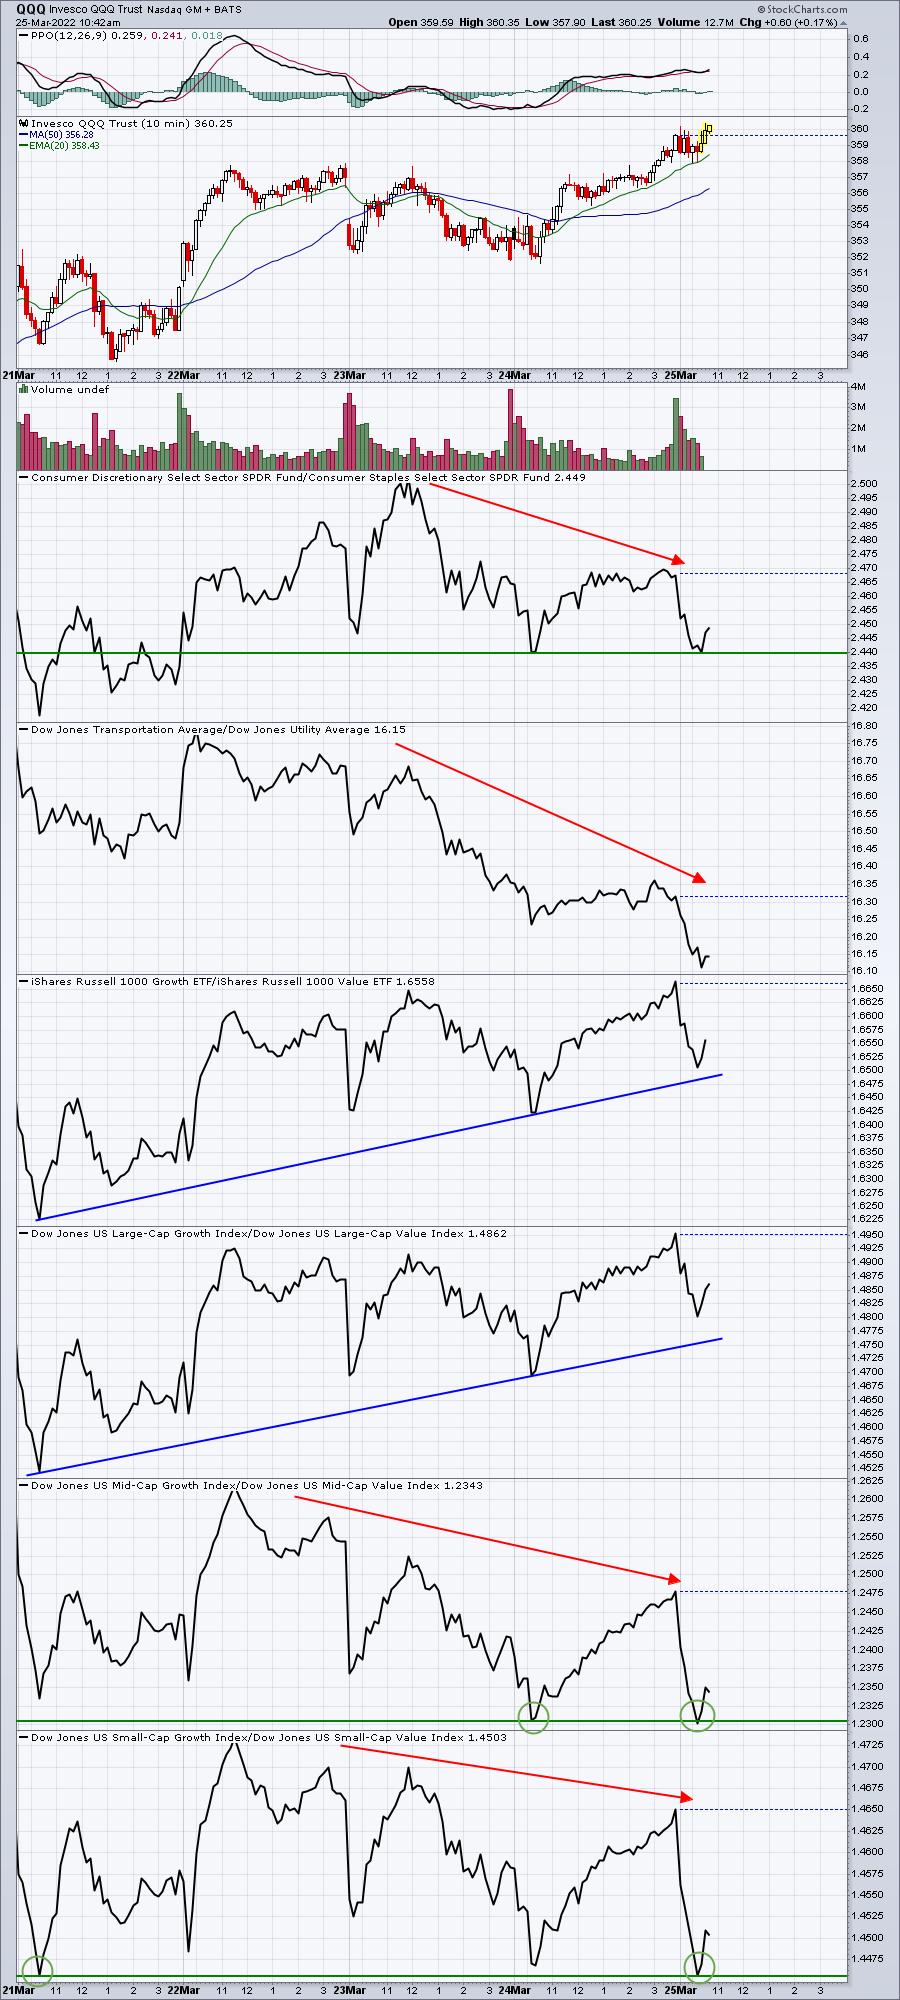
Note the XLY:XLP ratio falling to test its 4-day low. Transports are dropping consistently vs. utilities. Mid cap and small cap growth is struggling vs. its value counterparts. The only real strength right now supporting this move to the upside is large cap growth. It's that familiar group of Apple (AAPL), Microsoft (MSFT), Alphabet (GOOGL), Tesla (TSLA), NVIDIA (NVDA), and a few others, that are trying to carry the entire market on its shoulders. That's a lot to expect. Perhaps it continues, but just beware that most of these large cap growth stocks are currently sporting negative divergences on their 60-minute charts.
If you're trading on the long side, I'd obviously stick with the large cap leaders. But I'd remain VERY aware of the above concerns, so any big reversal in the afternoon, particularly one that's accompanied by heavy volume, would likely take me out of the trade.
ChartLists/Strategies
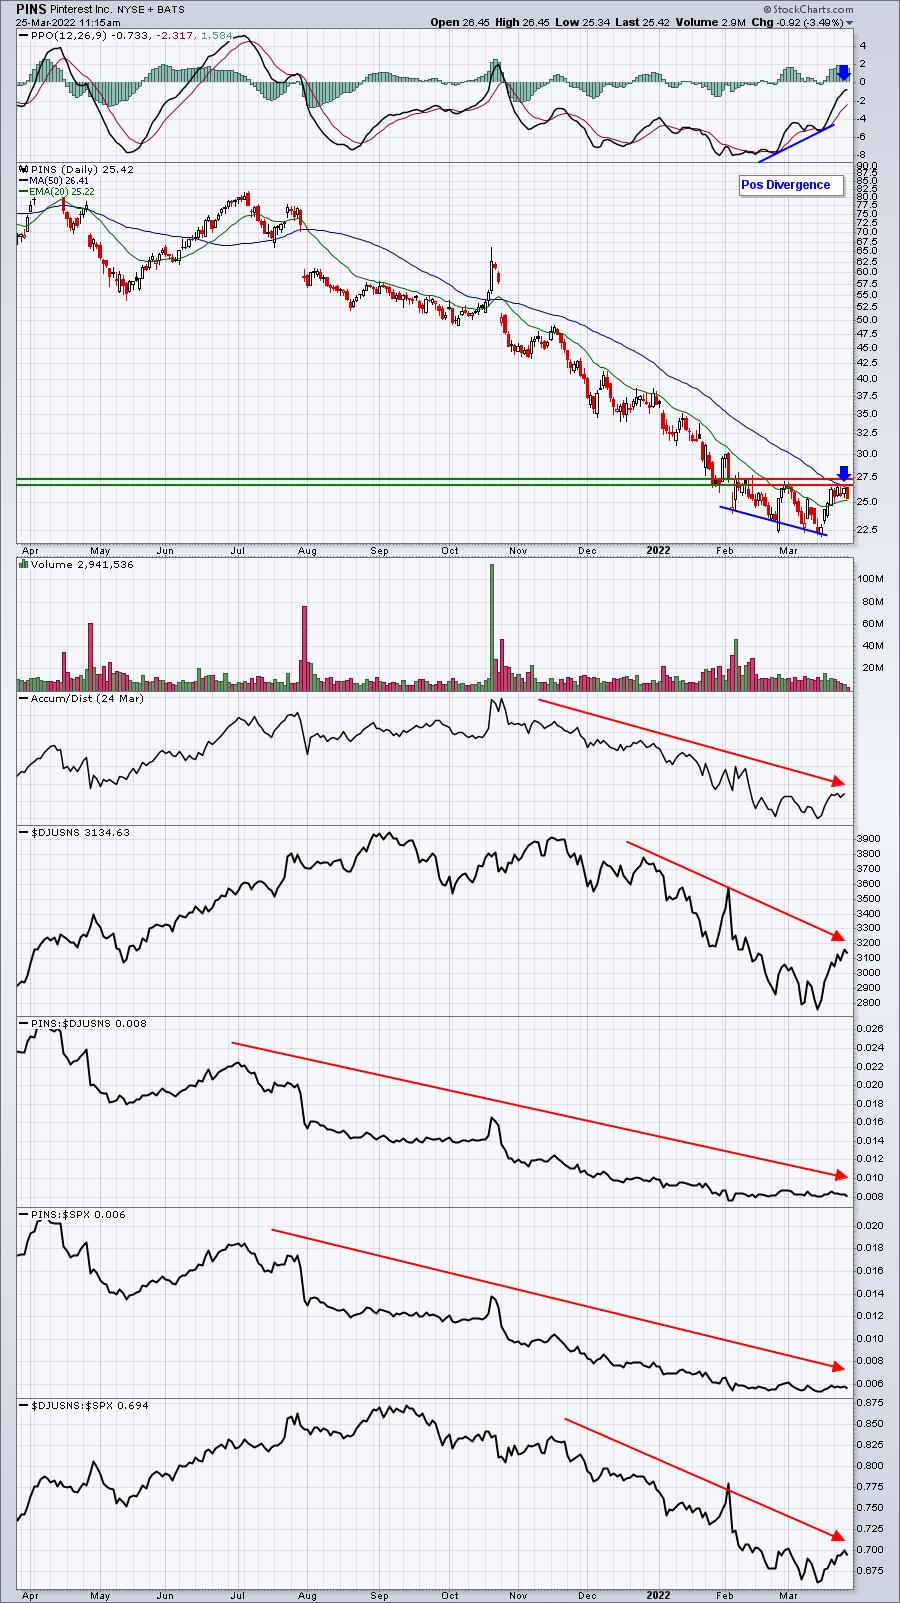
The two potential short candidates from yesterday are both having rough days today thus far. Check out the updated charts:
PINS:
LMND:
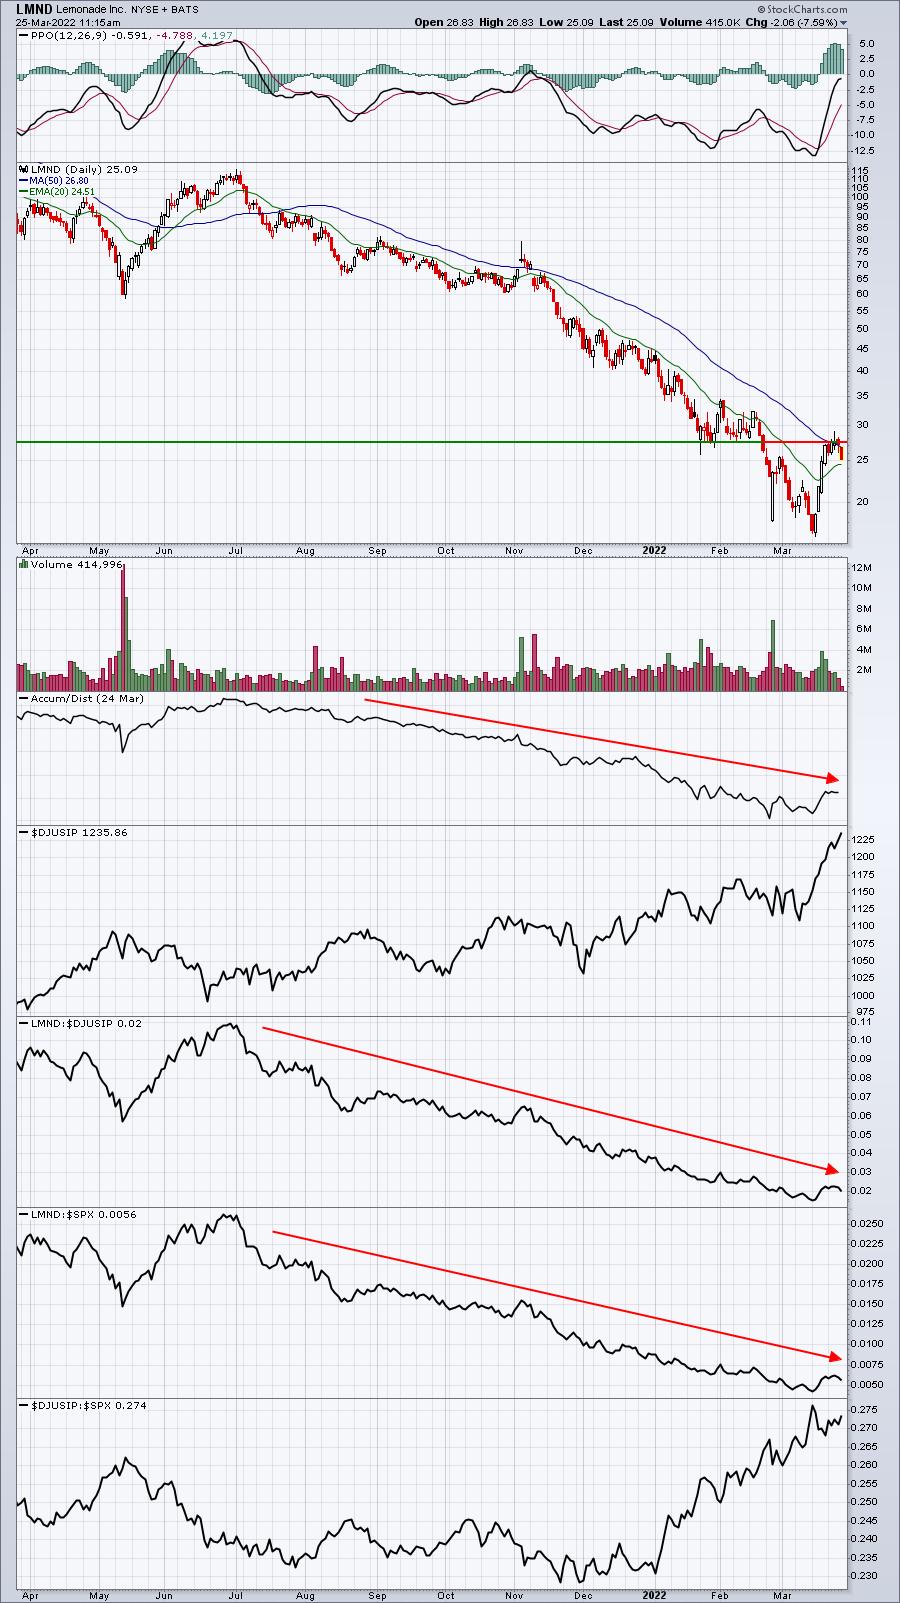
Both are laggards in their respective groups, so if the 2022 cyclical bear market weakness returns, these are both subject to potentially much more selling.
Earnings Reports
Here are the key earnings reports for the next two days, featuring stocks with market caps of more than $10 billion. I also include a few select companies with market caps below $10 billion. Finally, any portfolio stocks that will be reporting results are highlighted in BOLD. If you decide to hold a stock into earnings, please understand the significant short-term risk that you are taking. Please be sure to check for earnings dates for any companies you own or are considering owning.
Friday, March 25:
None
Monday, March 28:
XPEV, TPG, JEF, SAIC, PLAY
Economic Reports
March consumer sentiment (final): 59.4 (actual) vs. 59.7 (estimate)
February pending home sales: -4.1% (actual) vs. +0.9% (estimate)
Happy trading!
Tom