
EB Daily Market Report - Tuesday, March 29, 2022
Executive Market Summary
- Futures were higher overnight and our key indices gapped up at the opening bell
- The S&P 500 is attempting to negotiate 4600 on a closing basis for the first time since mid January, eclipsing the February double top just beneath that key level
- The growth-oriented NASDAQ is again leading the action today as treasury yields decline from earlier highs
- The 10-year treasury yield ($TNX) is down 7 basis points to 2.41%, its largest decline in the past 3-4 weeks
- Real estate (XLRE, +1.74%) is building on its recent strength and leads all sectors today
- Consumer discretionary (XLY, +1.41%) and technology (XLK, +1.01%) are among today's leaders as well
- Energy (XLE, -1.74%) is having another rough session, testing its rising 20-day EMA
- All consumer discretionary industry groups are higher, led by tires ($DWCTIR, +4.66%) and travel & tourism ($DJUSTT, +4.56%)
- Laggards on the S&P 500 are led by energy and materials stocks
Market Outlook
Well, 4600 resistance on the S&P 500 is upon us. If we hold into today's close above 4600, then I believe the February low is IT. I'd approach the market completely different moving forward. Assuming this break holds, I see two possible scenarios, both ending quite bullishly. First, I'd consider that the current rally keeps moving higher and higher:
S&P 500 - Scenario 1: Channel Higher Develops
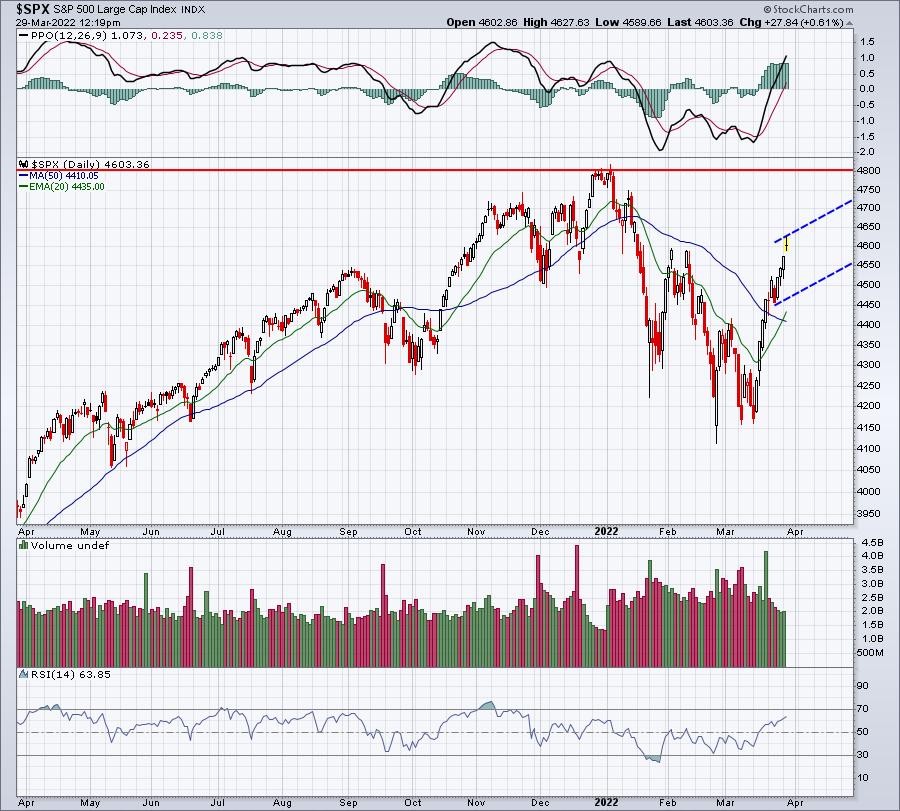
The daily RSI has moved back above 60, another confirming sign that the cyclical bear market low is in. Perhaps, the S&P 500 just continues soaring higher and pushes to new all-time highs. I wouldn't expect that, but anything is possible. Then there's another possible pattern that could develop, not nearly as bullish as the Scenario 1.
S&P 500 - Scenario 2: Neckline Resistance Holds
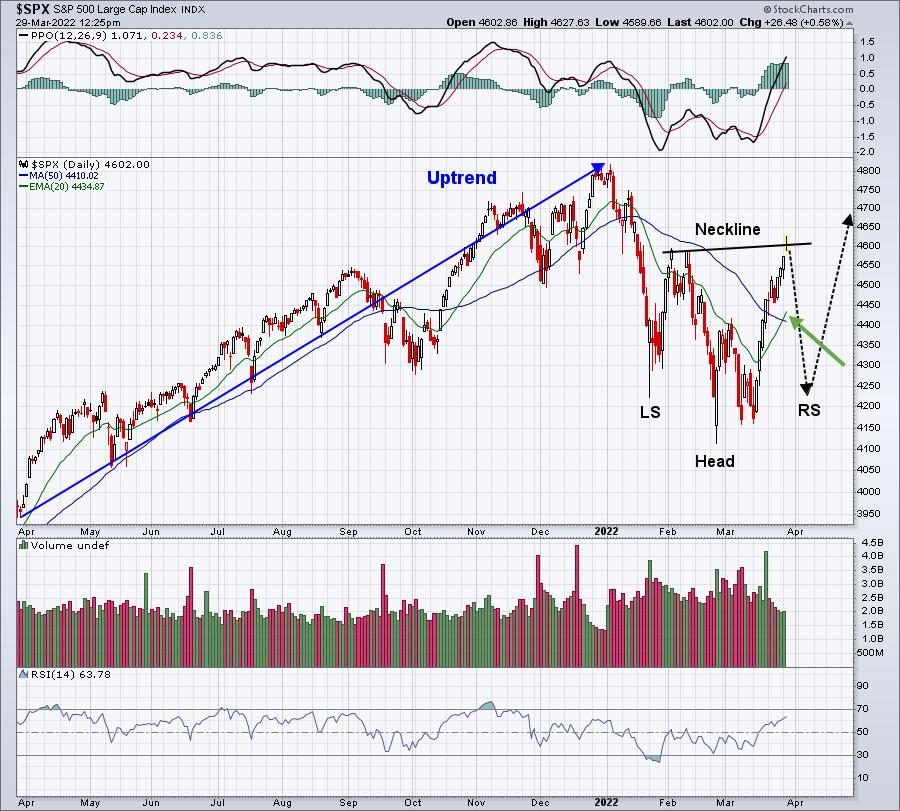
The good news is that the S&P 500 has already printed a higher high than what we saw in early February. Generally speaking, a rising neckline has a bullish "slant" to it. Two potential pullback areas would include an inverse right shoulder low that is fairly close to the inverse left shoulder. That would be a rather significant decline that would befit the type of volatility that we've seen in 2022. A lesser pullback (thick green arrow) could simply be a rising 20-day EMA test.
Sector/Industry Focus
Overall, we're seeing fairly strong beneath the surface action to support this market rally, which is great news. If I want to be picky, however, relative strength in the two most critical sectors could be stronger from an intermediate-term perspective:
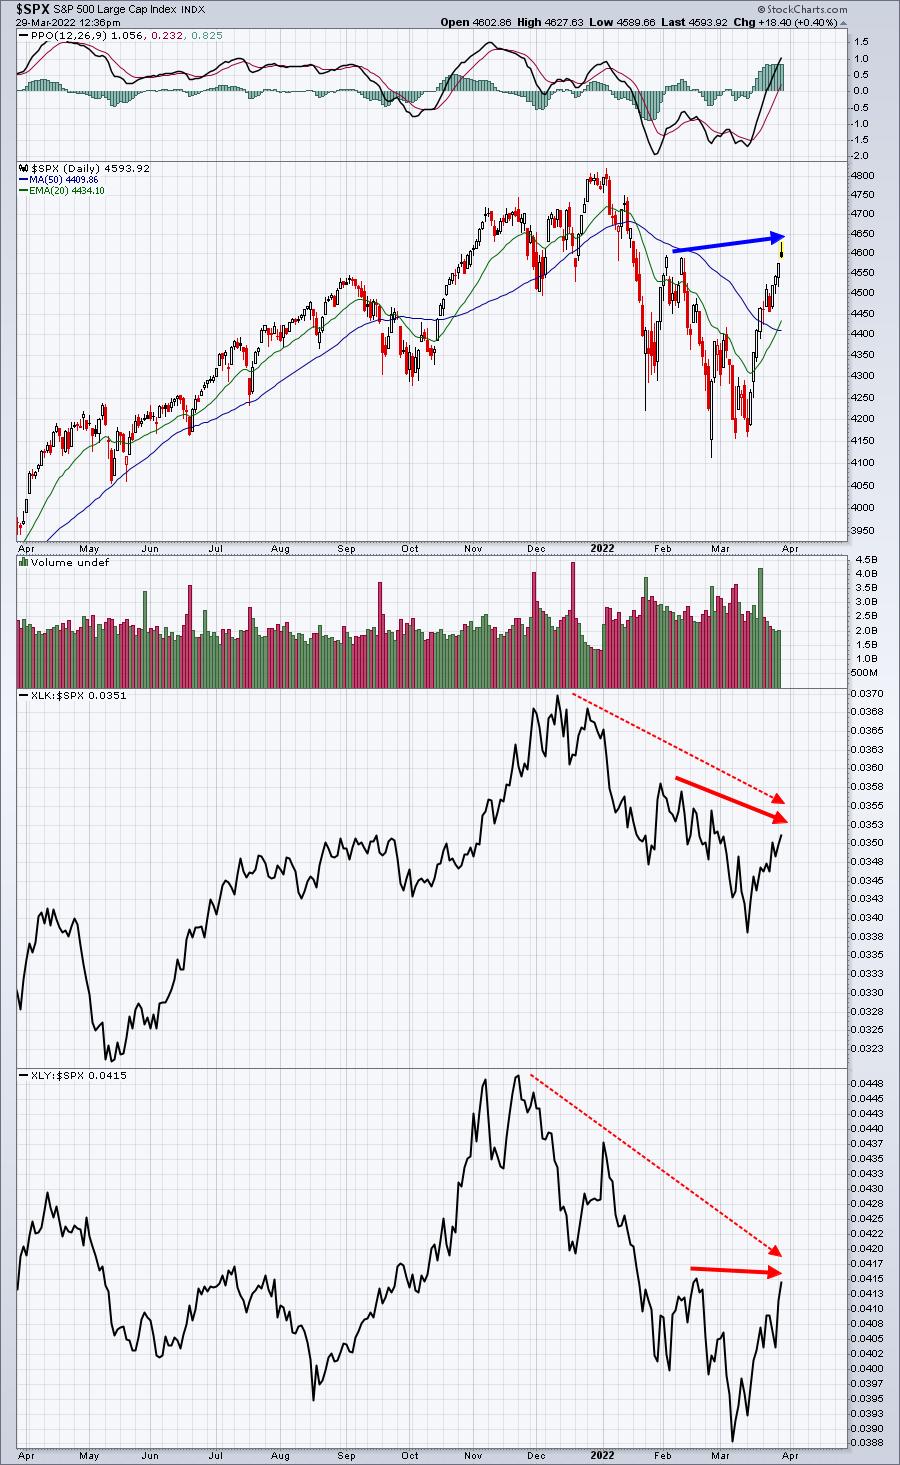
This chart is absolutely my biggest concern about the rally right now. Both the XLK and XLY have led the S&P 500 off the recent bottom, but they're nowhere close to their previous relative highs and an argument could definitely be made that they're simply not strong enough to help the S&P 500 continue its climb right now.
The Volatility Index ($VIX) has recently marked S&P 500 bottoms by reaching the 20 level. We saw the VIX close yesterday at 19.63. Today, it hit a low of 18.67, but is back up to 19.19. A selloff this afternoon in the S&P 500 should be respected just as much as another rally as this VIX move below 20 could trigger a key top. There's so much going on right now and so much to think about, but I do think this afternoon's action will help shape the next several weeks.
One last thought. Yesterday's equity only put call ratio ($CPCE) was .45 and we've now seen 6 consecutive days' readings at .50 or below. This is the most bullishness we've seen in the options world since technology stocks topped. This guarantees us nothing, but you have to wonder how much more upside there could be in the near-term with calls being bought hand over fist.
ChartLists/Strategies
A question came in asking me how I would handle Lowes Companies (LOW) now that it's bounced off the key support shown yesterday. The answer really depends on the type of investor/trader you are. Anyone with a longer-term perspective, wishing to enter a leading home improvement company, could consider exiting on a close beneath 209-210 support. So long as that holds and LOW begins trekking higher, then consider holding. A shorter-term trader, however, is all about booking profits and building cash to await the next trading opportunity. In this case, a couple different strategies could be employed. Let's look at the chart:
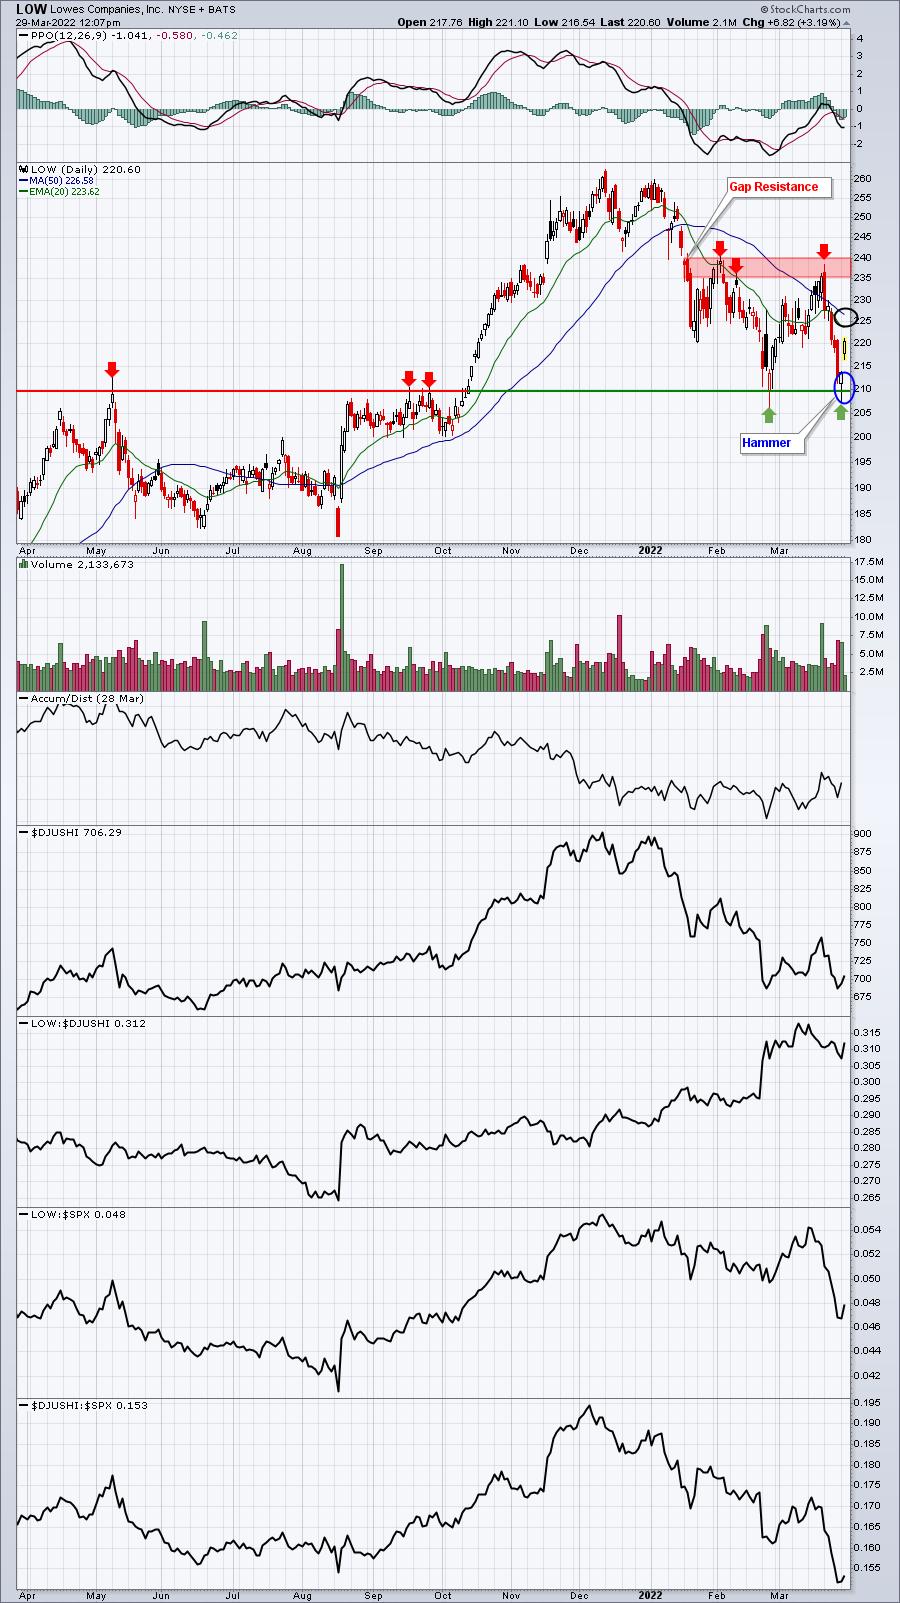
Once I have a profit on a reversal like we see here with LOW, I don't like to walk away with a loss. Therefore, I'd first consider exiting on any lower low. So assuming gains hold today, I'd place an INTRADAY stop just beneath today's low, so perhaps any move below 216. If LOW continues to print higher highs and higher lows, simply let it run. An alternative would be to hold until it hits key moving averages (black circle) and take profits there. That could represent a very quick 4-5% profit. Finally, should LOW continue rallying, a trip back into the 235-240 area is a possibility. That would be more than a 10% profit, which I'd nab with no second thoughts whatsoever.
I view these types of reversals as excellent trades and would really like to make sure I walk away with a profit, but that's just me.
Earnings Reports
Here are the key earnings reports for the next two days, featuring stocks with market caps of more than $10 billion. I also include a few select companies with market caps below $10 billion. Finally, any portfolio stocks that will be reporting results are highlighted in BOLD. If you decide to hold a stock into earnings, please understand the significant short-term risk that you are taking. Please be sure to check for earnings dates for any companies you own or are considering owning.
Tuesday, March 29:
MU, LULU, MKC, CHWY, CNXC, ESLT, RH, PVH, VRNT, ASO, CALM, PRGS
Wednesday, March 30:
PAYX, BNTX, PATH, FIVE, AER, MSM, BRZE, PHR
Economic Reports
January Case-Shiller home price index: +1.8% (actual) vs. +1.4% (estimate)
January FHFA house price index: +1.6% (actual) - no estimate found, but normally similar to Case-Shiller
March consumer confidence: 107.2 (actual) vs. 107.0 (estimate)
Happy trading!
Tom