
EB Daily Market Report - Friday, April 1, 2022
ChartLists Updated
I think the StockCharts.com issue surrounding the download of ChartLists has been resolved. I didn't have any trouble just moments ago downloading a couple ChartLists. So you should be able to download the Wednesday Resumption of Secular Bull Market ChartList from our website, if you so desire. Also, I have completed an update of the following two ChartLists:
- Strong Earnings ChartList (SECL)
- Strong Future Earnings ChartList (SFECL)
I'll have others over the weekend. The above two ChartLists should be available on our website early this afternoon.
Executive Market Summary
- Futures were higher overnight and they held those gains into the open
- The March nonfarm payrolls came in slightly below expectations - numbers provided below
- The 10-year treasury yield ($TNX) has jumped 6 basis points this morning, back to 2.39%, though it touched 2.46% earlier
- Despite the higher yields, financials (XLF, +0.03%) are showing little strength and banks ($DJUSBK, -0.53%) are lower
- Energy (XLE, +1.31%) leads the action to open April, with both real estate (XLRE, +0.67%) and materials (XLB, +0.62%) gaining nicely as well
- Truckers ($DJUSTK, -5.35%) are under significant pressure as JB Hunt Transports (JBHT, -7.17%) and Old Dominion (ODFL, -5.40%) lead the S&P 500 losers
- The market looks to close out the week and the beginning of April with more weakness as all of our indices have turned negative
Market Outlook
Recently on my Trading Places LIVE show, I discussed the "erosion" that takes place on leveraged, or juiced (as I like to call them) ETFs. Leveraged ETFs include ETFs like the QID (2x inverse NASDAQ performance) or the SQQQ (3 times). In theory, they work like this. If the NASDAQ 100 drops 5%, then the QID would, in theory, climb 10% and gain twice what the NASDAQ 100 loses. The SQQQ would again, in theory, gain 15% from a 5% drop in the NASDAQ 100. So you would expect that if the NASDAQ 100 goes nowhere over a two-month period and is flat, the QID and SQQQ would be flat as well, right? Well, check this chart out:
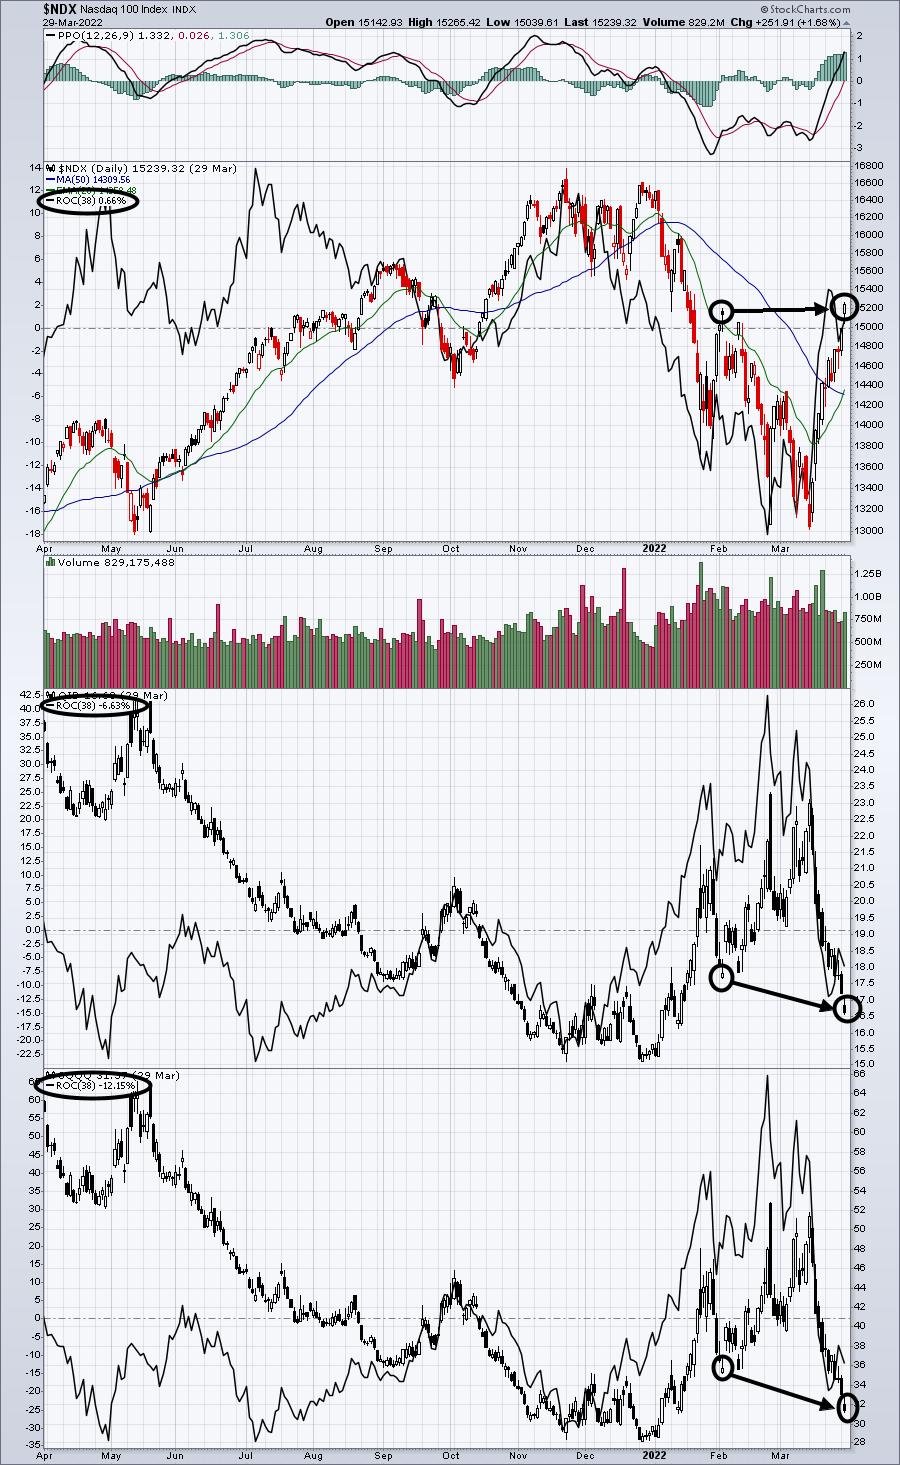
There's a lot of noise on this chart, but just focus on the price from early February to the date of this chart, which was March 29th. The prices for the NDX, QID, and SQQQ are all circled as of those two dates. These were 38 days apart, which is why I show the Rate of Change (ROC) as 38 periods. I've circled those in black as well. Here are the ROCs for each over this 38 day period:
- $NDX: +0.66%
- QID (2x): -6.63% (in theory, the QID should be down 1.32% or twice the 0.66% change)
- SQQQ (3x): -12.15% (in theory, the SQQQ should be down 1.98% or three times the 0.66% change)
Do you see the problem with holding these "juiced" ETFs longer-term? That's not what they were designed for. They work great for short-term trends and that's all. I would suggest avoiding the temptation to hold long-term as volatility eats into their expected returns. That's referred to as "erosion".
Sector/Industry Focus
Truckers ($DJUSTK) have been under significant selling pressure the past few days and they're now testing a key intermediate-term price support level:
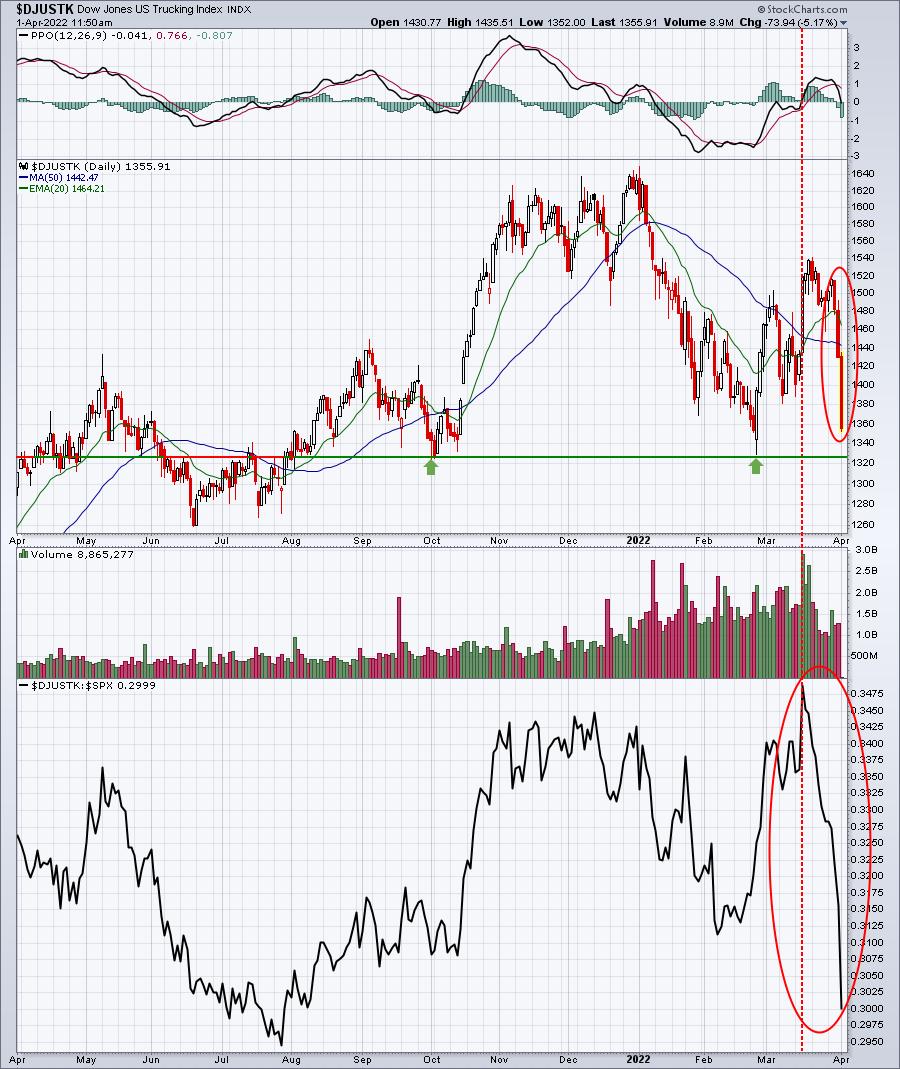
The absolute price weakness showed up big time the past three days, but check out the relative weakness in the lower panel. It's been plummeting for the past couple weeks. If we're looking to potentially endure an upcoming recession, truckers would stand to lose big time. Is this what this chart is telling us? Something to think about.
ChartLists/Strategies
We could be transitioning into another period of downtrending prices. I think it makes sense to be a bit more cautious about taking on new positions right now. I'll take a look on Monday for potentially solid trades, but skip that exercise for today as risks are most definitely increasing.
Earnings Reports
Here are the key earnings reports for the next two days, featuring stocks with market caps of more than $10 billion. I also include a few select companies with market caps below $10 billion. Finally, any portfolio stocks that will be reporting results are highlighted in BOLD. If you decide to hold a stock into earnings, please understand the significant short-term risk that you are taking. Please be sure to check for earnings dates for any companies you own or are considering owning.
Friday, April 1:
None
Monday, April 4:
None
Economic Reports
March nonfarm payrolls: 431,000 (actual) vs. + 490,000 (estimate)
March private payrolls: 426,000 (actual) vs. 458,000 (estimate)
March unemployment rate: 3.6% (actual) vs. 3.7% (estimate)
March average hourly earnings: +0.4% (actual) vs. +0.4% (estimate)
March PMI manufacturing: 58.8 (actual) vs. 58.5 (estimate)
March ISM manufacturing: 57.1 (actual) vs. 59.0 (estimate)
February construction spending: +0.5% (actual) vs. +0.9% (estimate)
Happy trading!
Tom