
EB Daily Market Report - Friday, April 8, 2022
ChartWatchers Article
If you don't already subscribe to the StockCharts.com free newsletter, "ChartWatchers", you probably should. There are usually great insights to at least consider from very reputable technicians (and close friends of mine). I don't always agree with my fellow colleagues, but I do have tremendous respect for their work.
Anyhow, I just published my article for this weekend's newsletter and want to make sure that all of our EB.com members are aware that it's been published. If you'd like to read more of my thoughts about the current market, you can CLICK HERE.
Executive Market Summary
- Futures were green overnight, but they did take a hit just before this morning's opening bell
- There is serious bifurcation in today's action as the Dow Jones is up 255 points, while the NASDAQ is down 75
- Value (IWD, +0.81%) is crushing its growth counterparts (IWF, -0.33%)
- Commodities are higher as crude oil ($WTIC, +0.93%) and gold ($GOLD, +0.47%) outperform; palladium ($PALL, +8.18%) is surging after a steep correction over the past month or so
- The 10-year treasury yield ($TNX) is not slowing its 4-5 week rise, jumping another 4 basis points to 2.69%
- Energy (XLE, +2.42%) and financials (XLF, +1.17%) are leading the session from a sector perspective
- Meanwhile, technology (XLK, -0.53%) is the primary laggard, with consumer discretionary (XLY, -0.18%) not too far behind
- Semiconductors ($DJUSSC, -1.86%) and renewable energy ($DWCREE, -1.32%) are the technology casualties
- SolarEdge (SEDG, -3.45%) and Enphase Energy (ENPH, -3.30%) are among the Top 5 worst performers on the S&P 500, putting pressure on most renewable energy names
Market Outlook
I will admit that U.S. equities have remained quite resilient in the face of mostly awful geopolitical and economic news. But the "beneath the surface" signals honestly are not improving that much. In the ChartWatchers article that I referenced above, I provided an RRG chart of all sectors, excluding energy (XLE) and materials (XLB) to highlight the poor (bearish) rotation that has taken place through the first quarter of 2022.
As I compare growth to value across our 3 asset classes - large, mid, and small cap - I just don't see Wall Street committing to growth names yet. That tells me we MUST keep our guard up, even if our major indices appear to be weathering the storm. A significant decline can take place at any time when defensive rotation is taking place. Check out this "growth vs. value" analysis relative to the performance of the benchmark S&P 500:
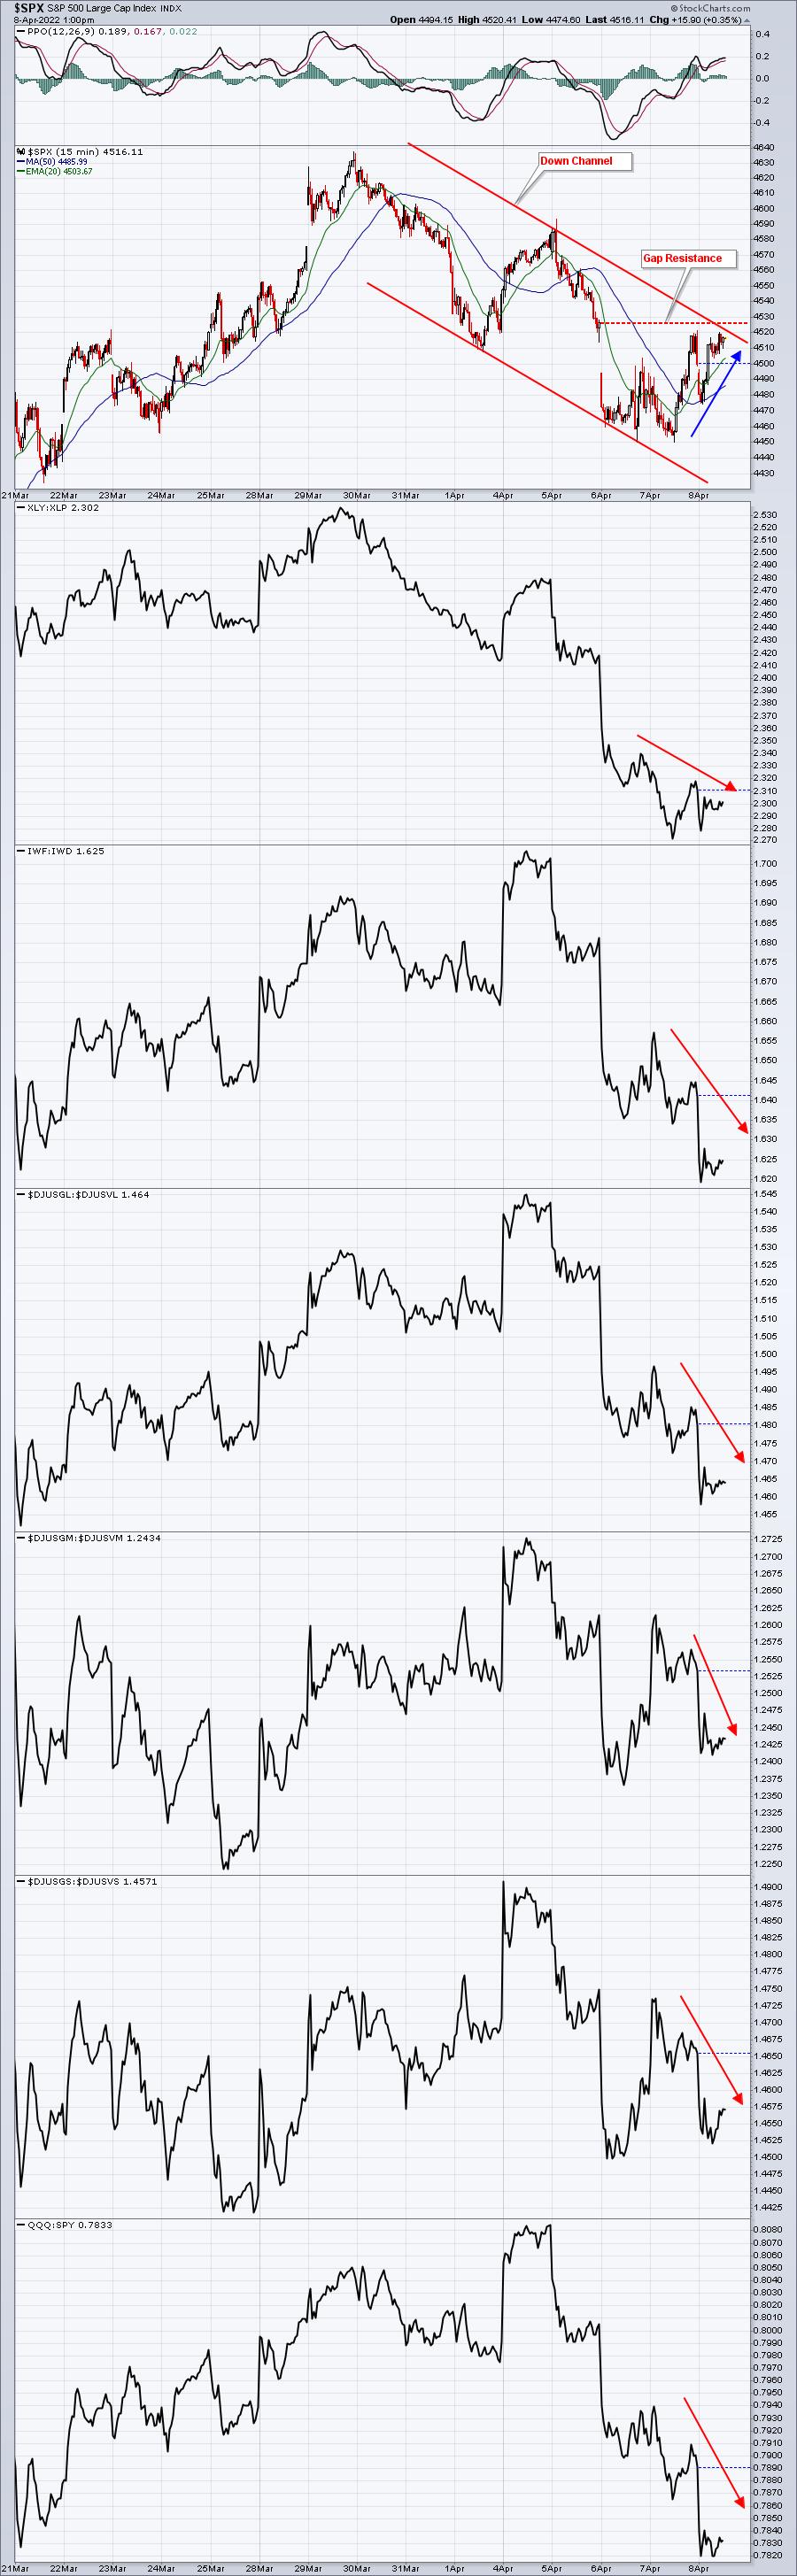
This is about as bearish a chart as I can imagine. The S&P 500 is attempting to clear gap and channel resistance as a time when Wall Street is repositioning into value stocks. Here's an aggressive trade for you. Buy the SDS, which is the 2x inverse ETF of the S&P 500. In theory, if the S&P 500 drops 2%, the SDS should go up 4%. So this is a BEARISH trade on the overall market with a very tight stop. If the S&P 500 closes above 4525, exit and take a small loss. If, however, it sells off, hold onto it so long as it prints lower daily highs. The first time it prints a higher daily high, exit the SDS.
Sector/Industry Focus
Transportation stocks ($TRAN), which I featured yesterday, can be compared on a relative basis to utilities ($UTIL). This is a "sustainability ratio" that I follow, similar to the XLY:XLP ratio (which is by far my favorite sustainability ratio). My 10 second explanation of the TRAN:UTIL ratio is.....it should go up when the market is bullish and go down when the market is bearish. Check it out over the past 2+ years:
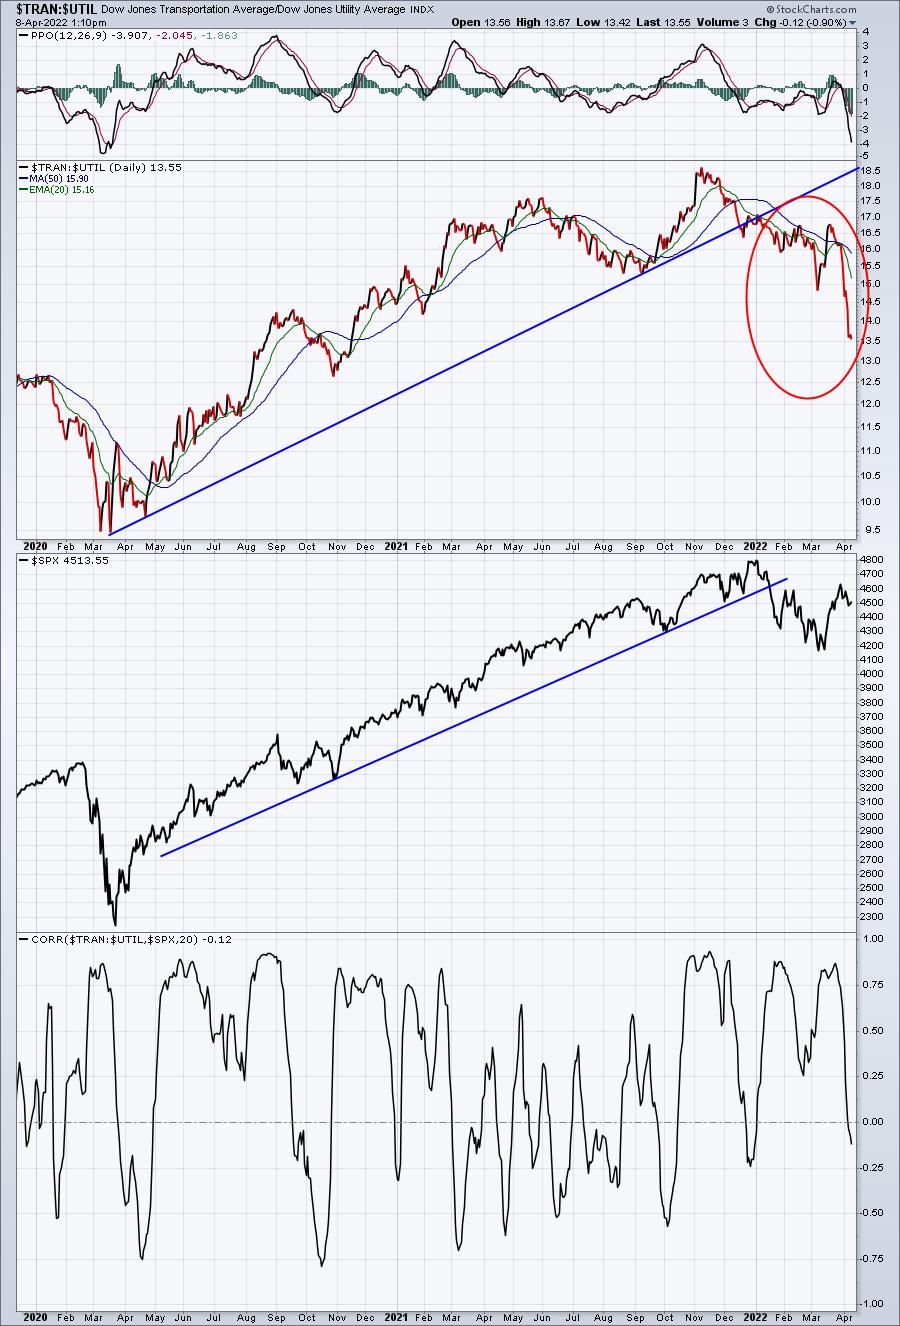
Once the ratio lost its trendline early in 2022, it's been weakening. However, the downtrend has turned into a ski slope the past few weeks. Wall Street is pricing in a recession in the transport stocks. Meanwhile, they're buying utilities like there's no tomorrow. If U.S. equities were about to move in a sustained uptrend, why would Wall Street be rotating the way that it is?
ChartLists/Strategies
Here are two stocks that could see short-term weakness if the benchmark S&P 500 rolls over:
MRNA:
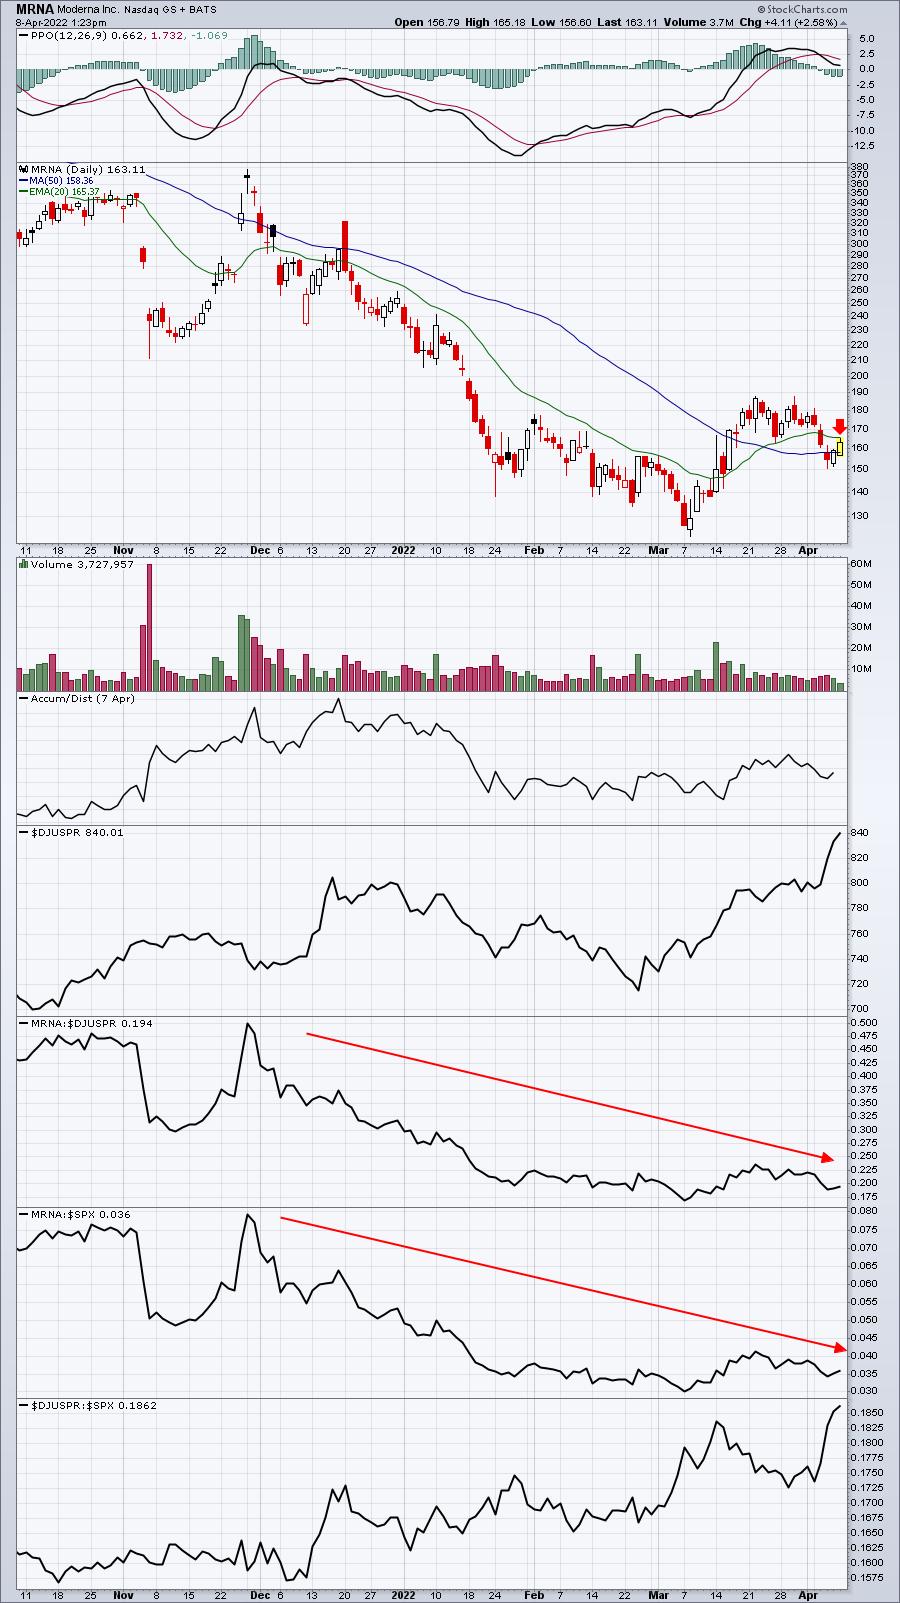
If MRNA is rolling back over this latest test of the 20-day EMA from underneath should fail. Therefore, you could keep a very tight closing stop near 166. It could be a very quick exit and small loss OR, if the rally is ending, it could be a big score on the short side in the near-term.
GM:
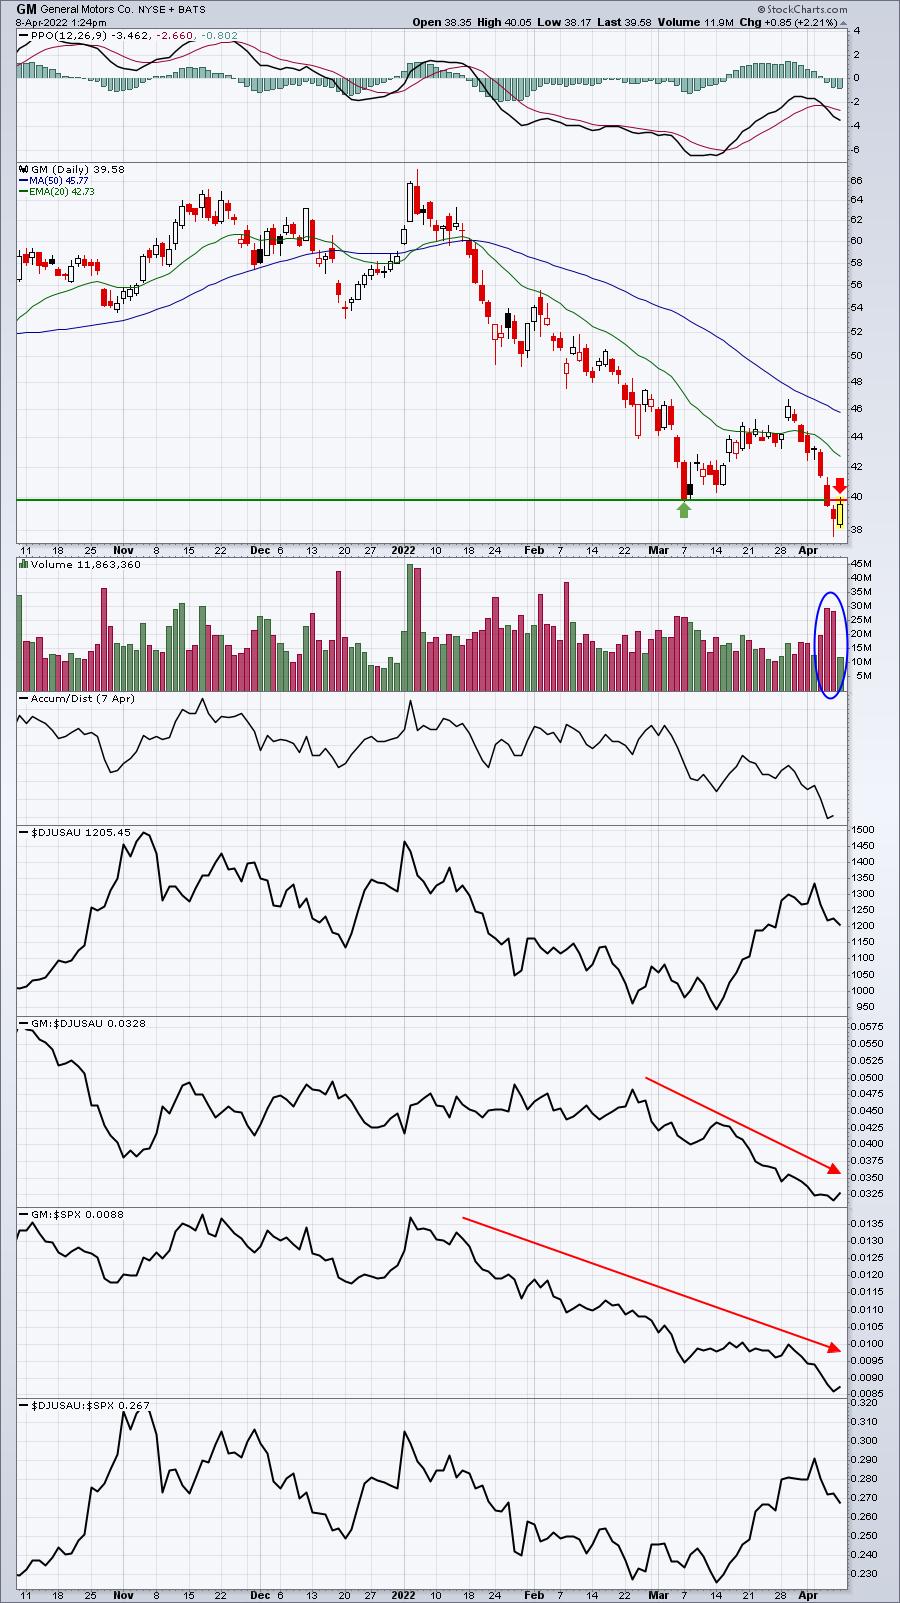
GM broke down over the past two days on heavier-than-normal volume. Today's rally could be nothing more than a quick test of price resistance before another leg lower. Once again, I'd keep a tight closing stop here above 40.
Earnings Reports
Here are the key earnings reports for the next two days, featuring stocks with market caps of more than $10 billion. I also include a few select companies with market caps below $10 billion. Finally, any portfolio stocks that will be reporting results are highlighted in BOLD. If you decide to hold a stock into earnings, please understand the significant short-term risk that you are taking. Please be sure to check for earnings dates for any companies you own or are considering owning.
Friday, April 8:
None
Monday, April 11:
None
Economic Reports
None
Happy trading!
Tom