
EB Daily Market Report - Monday, April 11, 2022
Today's Event - Sneak Preview of Model ETF Portfolio
At 4:30pm ET today, I'll be hosting our quarterly "Sneak Preview" of our Model ETF Portfolio. Nearly 3 months ago, we "drafted" several ETFs to fill out our portfolio in an extremely volatile period in an attempt to outperform the S&P 500. We definitely took a much more cautious approach given the market environment that we were dealt. With a week to go before closing out the quarter, our Model ETF Portfolio is roughly 2% ahead of the S&P 500, so we've had some success in mitigating the weak conditions. I expect that we'll need to continue to be cautious and I'll talk more about that this afternoon.
If you'd like to join the webinar, you can click on the link below AFTER 4:00pm ET:
https://earningsbeats.zoom.us/j/85094776328
If you're unable to make the event live, but would like to view it later, we'll have the recording available for you.
Executive Market Summary
- Futures were weak overnight and we began the day with a gap lower
- After a brief, early attempt to push prices higher, bulls relented and more selling has ensued
- Cryptocurrencies have had a very rough April and it's not getting any better today; bitcoin ($BTCUSD) and etherium ($ETHUSD) are down 6.23% and 8.31%, respectively
- Commodities are mixed with crude oil ($WTIC, -4.07%) down $4 per barrel to $94
- Silver ($SILVER), however, is strong with a gain of 0.67%
- Energy (XLE, -2.97%) is very weak given the falling crude prices
- All 11 sectors are lower with technology (XLK, -1.92%) also leading to the downside
- Software ($DJUSSW, -2.03%) is contributing to the XLK weakness
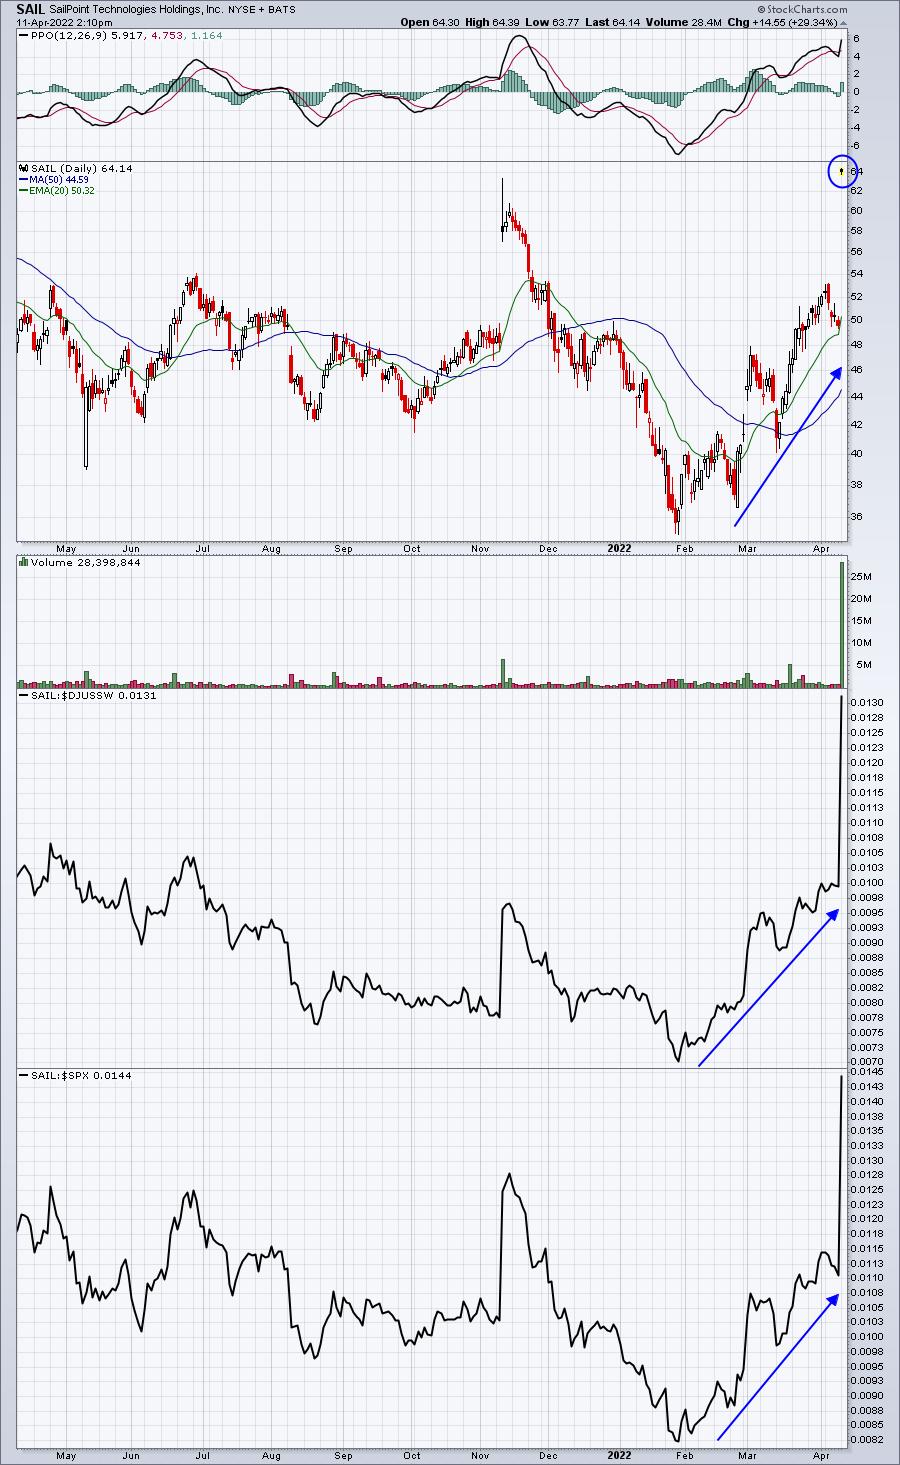
- A private equity firm is acquiring SailPoint Technologies (SAIL, +29.36%) in an all-cash deal worth just under $7 billion
- Delta Airlines (DAL, +4.40%) is one of the leading S&P 500 companies today, just two days ahead of its quarterly earnings report due out on Wednesday morning
Market Outlook
The daily charts are showing breakdowns beneath key moving averages, which is very worrisome. It certainly suggests we could be looking at further weakness ahead. Unless the SPY and QQQ are able to regain key moving averages like the 20-day EMA, I'd look for more downside. The S&P 500 ($SPX) hourly chart appears to suggest the same thing as today's weakness is breaking neckline support in a topping head & shoulders pattern:
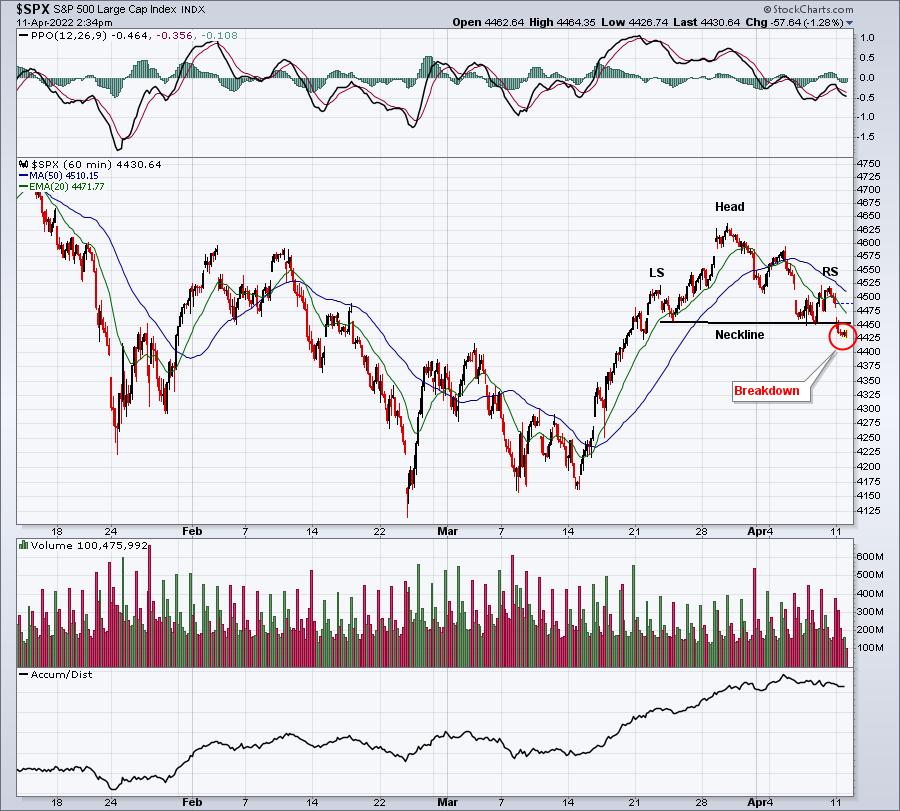
From the head down to the neckline, this pattern measures roughly 185 points. A closing breakdown today would thus measure down to 4265 or thereabouts. Be careful right now.
Sector/Industry Focus
Mobile telecommunications ($DJUSWC) is up slightly today and threatening a breakout. But because of its long-tail and potential false breakout, it might very well be printing a top. Needless to say, today's close will be very important for this industry group:
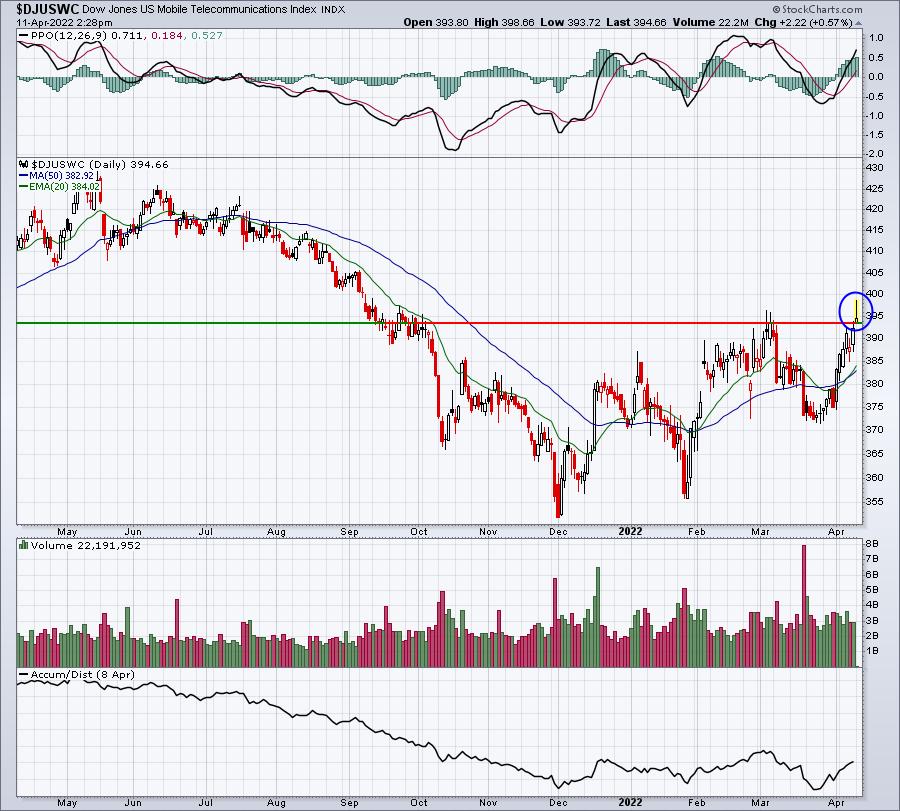
Clearly, if the DJUSWC is able to work its way back towards the high by the close, this chart would be much more bullish. But if not.......?
ChartLists/Strategies
I mentioned in the Executive Market Summary that SAIL is being acquired for nearly a 30% premium over Friday's close. While we never know which companies might be acquired, it certainly makes sense that it's likely to be a company showing relative strength, which SAIL did show heading into this morning's acquisition announcement:
SAIL is a stock that's included on our Strong Earnings ChartList (SECL) and Strong AD ChartList (SADCL). One way to check to see if a stock is included on our various ChartLists is to pull a stock up using the "Symbol Summary" (instead of SharpChart).

After you click "Go", at the bottom on the left side, it'll show which ChartLists that stock is included in within your StockCharts.com account. Here's how it shows in my account:
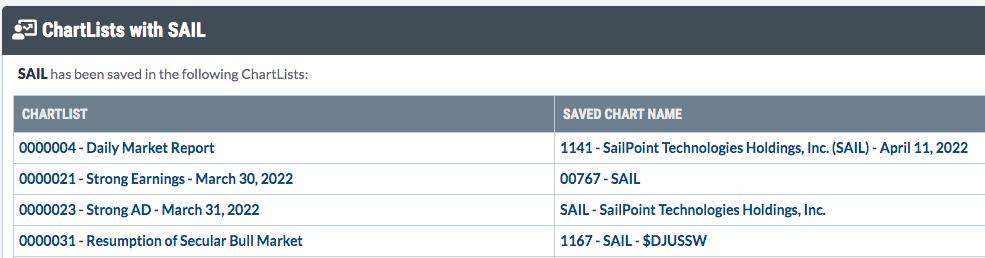
Also, note that SAIL was included as one of the software stocks that I suggested was looking strong when I hosted the "Resumption of Secular Bull Market" webinar less than two weeks ago. And, if you're wondering, "was Tom smart enough to buy SAIL and make nearly 30% today?" Well, you know the answer. Of course not! (Insert sad face here)
But I hope some of you were luckier than me.
Earnings Reports
Here are the key earnings reports for the next two days, featuring stocks with market caps of more than $10 billion. I also include a few select companies with market caps below $10 billion. Finally, any portfolio stocks that will be reporting results are highlighted in BOLD. If you decide to hold a stock into earnings, please understand the significant short-term risk that you are taking. Please be sure to check for earnings dates for any companies you own or are considering owning.
Monday, April 11:
None
Tuesday, April 12:
ACI, KMX
Economic Reports
None
Happy trading!
Tom