
EB Daily Market Report - Wednesday, April 13, 2022
Executive Market Summary
- Futures were relatively flat overnight and we opened today with bifurcated action
- The Dow Jones opened lower, while the NASDAQ was higher, showing relative strength
- Currently, the NASDAQ is up 1.53% and continues to show relative strength
- Leadership is found in consumer discretionary (XLY, +1.60%), communication services (XLC, +1.43%), and technology (XLK, +1.34%) - the three most aggressive sectors
- Meanwhile, utilities (XLU, -0.62%) are weak
- Crude oil ($WTIC, +2.01%) is extending its strength from Tuesday; natural gas ($NATGAS, +3.08%) continues its stellar advance
- JP Morgan (JPM, -2.36%) kicked off earnings season with earnings that fell short of expectations; banks ($DJUSBK, -0.84%) are lagging the broader index in sympathy
- Headline inflation was hotter than expected for a second day in a row; this time it was the March PPI, which rose a staggering 1.4%, well ahead of the 1.1% estimate
- Finally, Delta Airlines (DAL, +4.71%) is leading the airlines group ($DJUSAR, +6.21%) higher after reporting better-than-expected earnings results
Market Outlook
One of the biggest problems in the stock market right now is the latest breakdown in my most important sustainability ratio - consumer discretionary (XLY) vs. consumer staples (XLP). The S&P 500 is still a long way from its February/March double-bottom price support, but the XLY:XLP is moving nervously close to its low. Check this out:
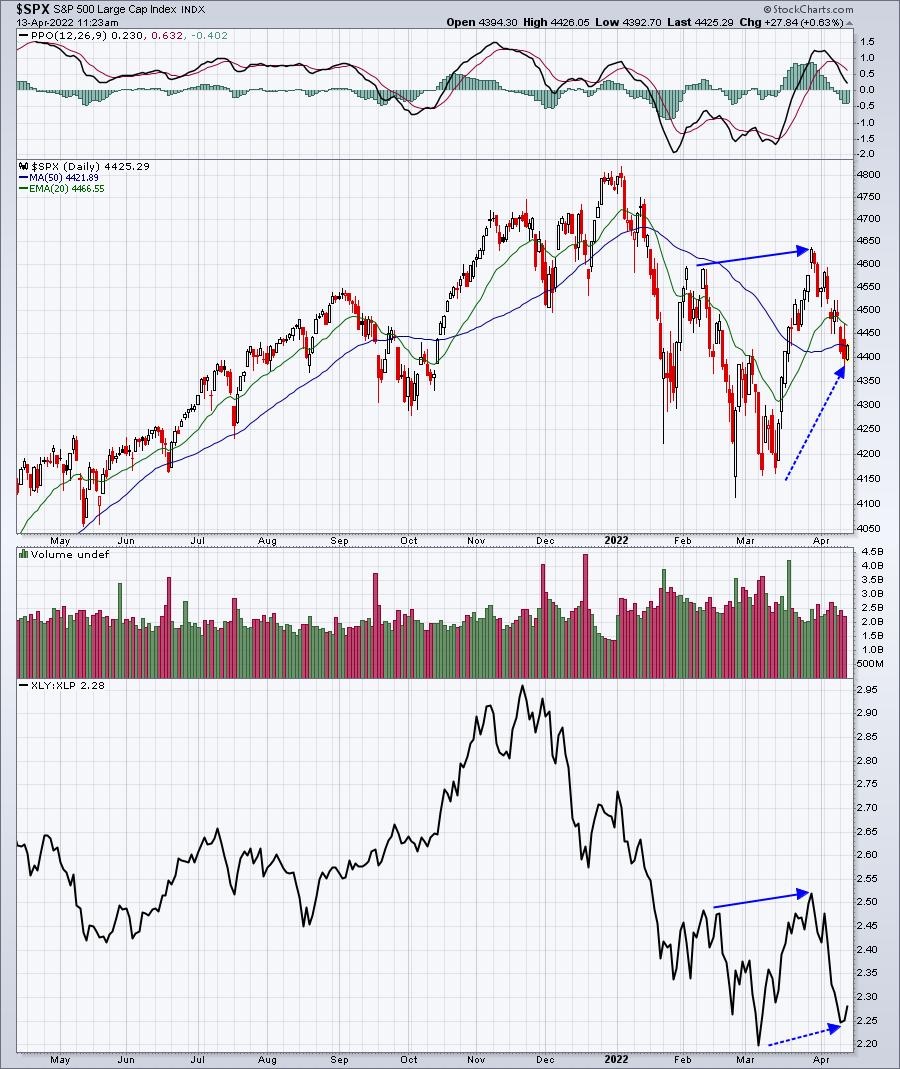
These types of relationships are rarely, if ever, discussed in the media. But I've found this simple XLY:XLP ratio an unbelievably accurate sign of trend sustainability. We've been in a downtrend of our major indices in 2022 - with of course rallies along the way. The fact that the XLY:XLP is nearing another 2022 relative breakdown is very worrisome. The solid blue directional lines show that the S&P 500's new high in March was accompanied by a similar to new relative high in the XLY:XLP, which is good. But the selling since that March high shows Wall Street rapidly rotating away from the XLY vs. the XLP - and that is not good.
Sector/Industry Focus
The Dow Jones U.S. Biotechnology Index ($DJUSBT) has been improving recently as Wall Street has rotated from aggressive sectors to defensive sectors. The following chart shows improving absolute and relative strength in the biotechs:
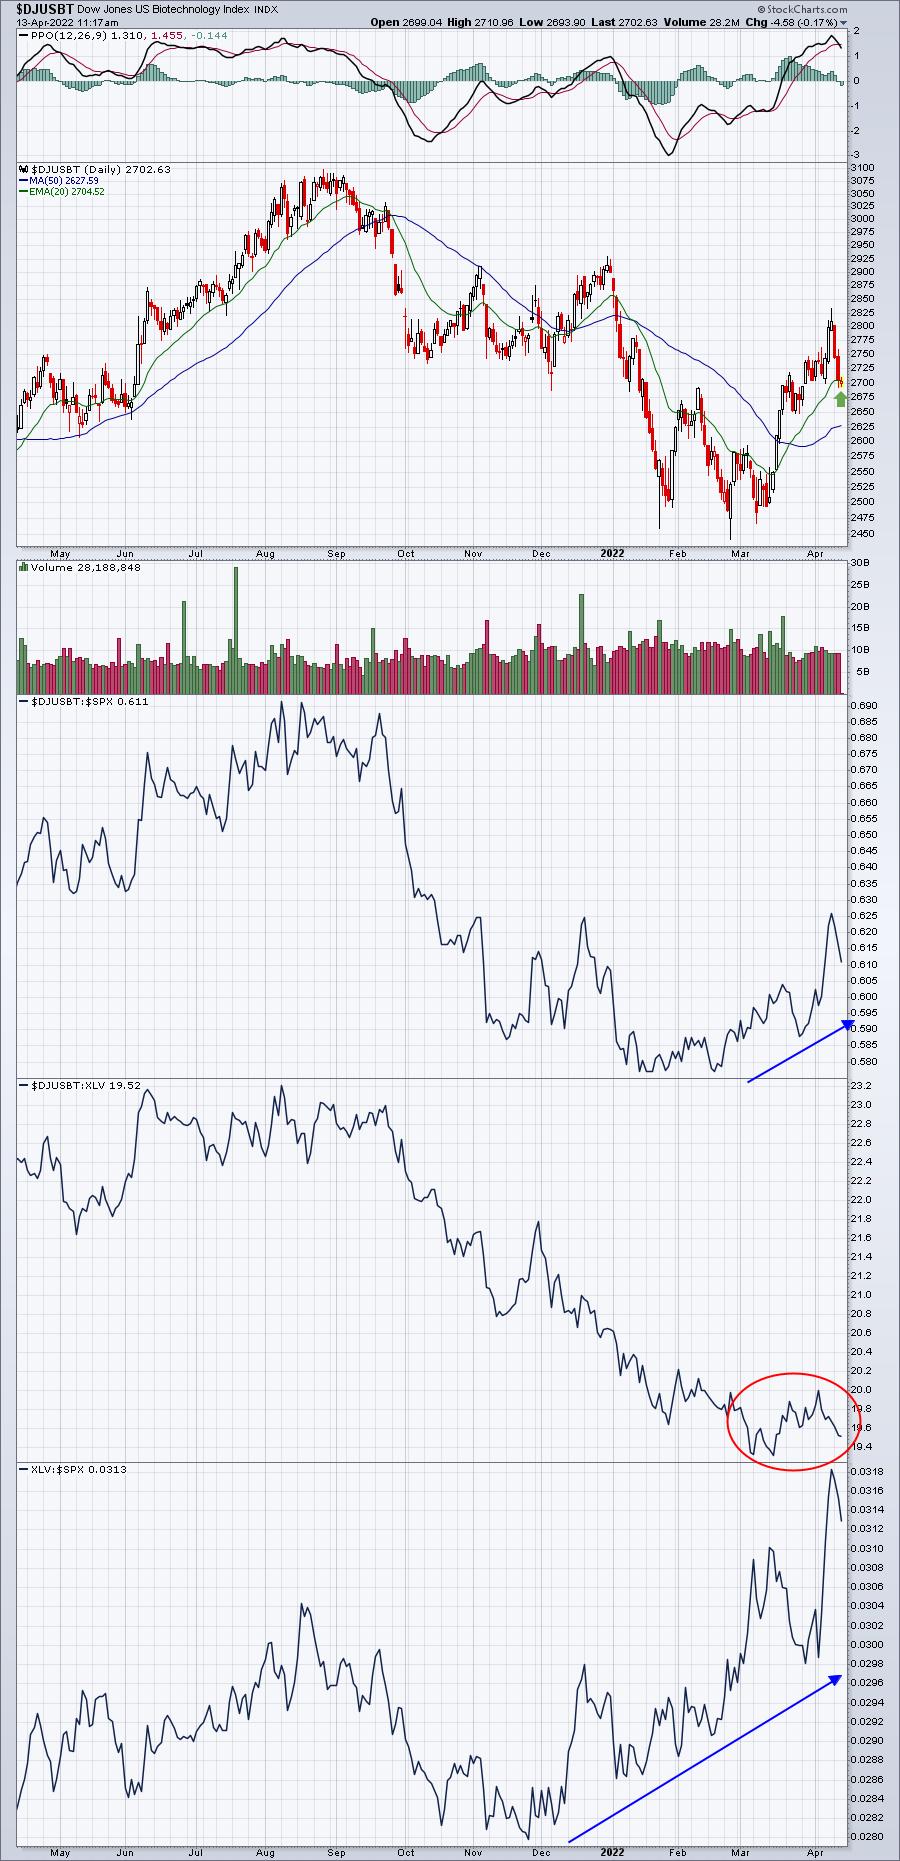
The group is experiencing its first 20-day EMA test since breaking above this key moving average a month or so ago. If we see a reversal in the group, then the following trade that I'm about to discuss has a much better chance of working.
ChartLists/Strategies
I've discussed in the past the strategy that I use in trading Strong AD ChartList (SADCL) stocks. First, you need to understand how these stocks make it on this ChartList. I run a scan to pick up all high SCTR stocks in every sector (usually SCTRs > 80) that average a minimum number of daily shares traded to ensure liquidity (normally > 200,000 shares daily). I also will sometimes include stocks with SCTRs that were > 80 a month or two ago, because it's quite possible that a stock has lost relative strength, but its AD line remains strong (suggesting possible accumulation). Once the scan is returned, I then review every stock individually to ensure that its AD line is trending higher. A higher trending AD line tells me that these stocks tend to finish the day in the upper end of their trading range. How a stock finishes in its trading range - that percentage - is then multiplied times that day's volume to determine whether the AD line goes higher or lower.
In other words, if a stock is on the Strong AD ChartList, it has a strong tendency to perform better later in the day. Therefore, I will many times review early morning weakness to find strong reward-to-risk trading candidates. I want to point out one such stock from my review this morning:
ABBV:
ABBV is down 4.15% as I write this. It's pulled back the past few days and today opened above the 20-day EMA, but is currently trading just beneath it. Check it out:
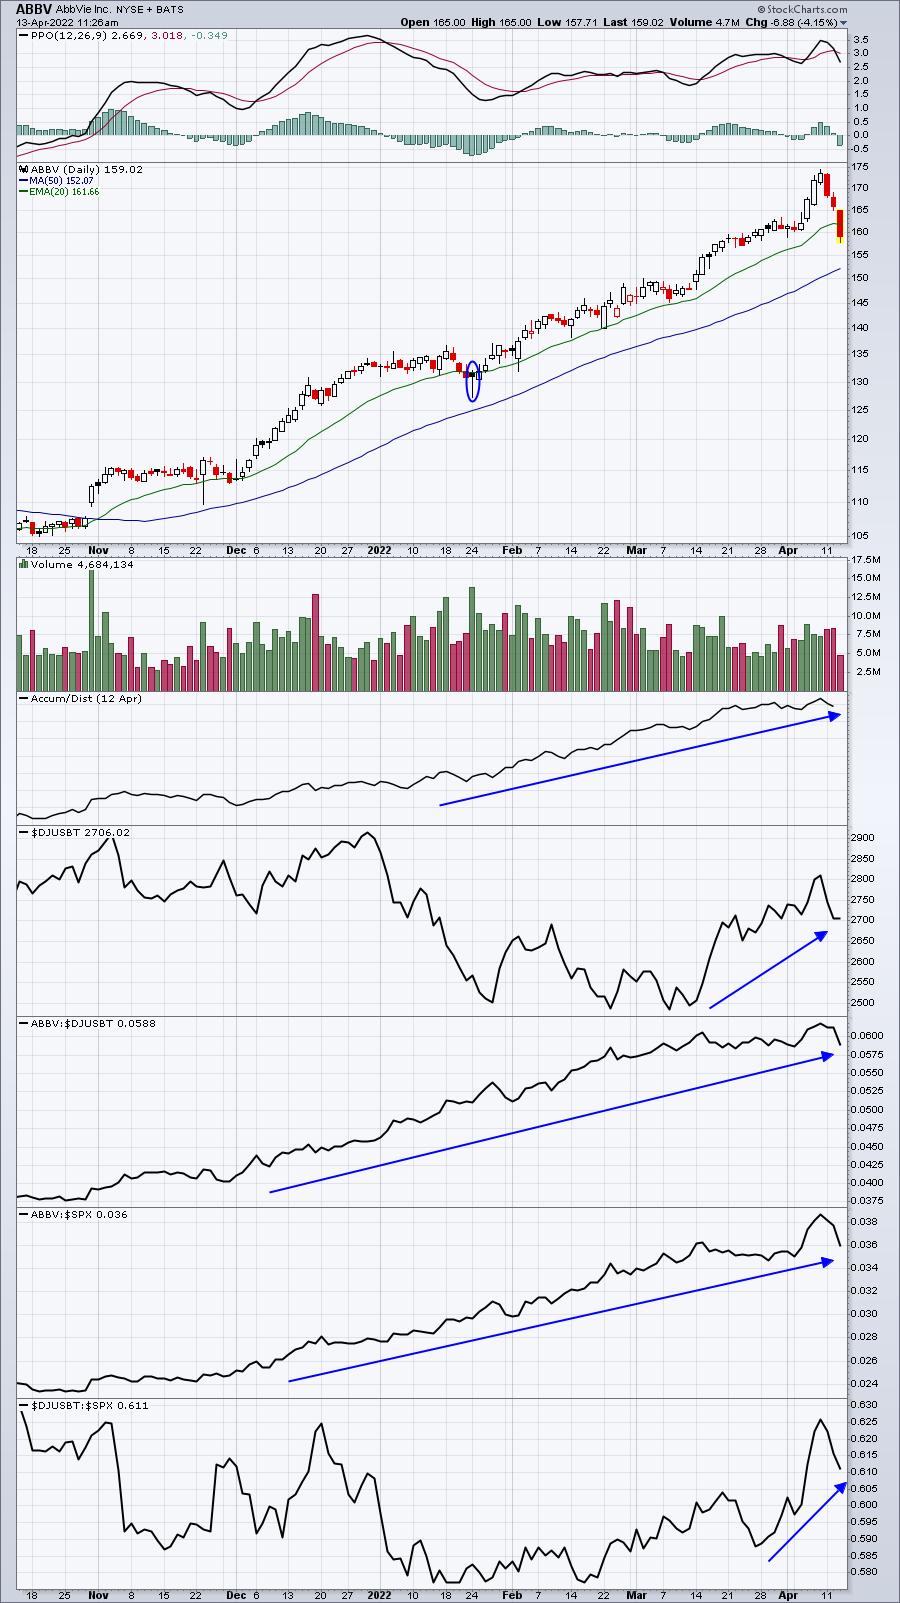
The biotechs ($DJUSBT) have improved recently (as I discussed above) and health care stocks generally perform better over the upcoming few months. ABBV is a leader in the DJUSBT space and it's testing its 20-day EMA. I circled a similar day back on January 24th when the overall market bottomed and I could have circled the big reversal on November 23rd from last year. These were both intraday breakdowns that reversed in the afternoon. An AGGRESSIVE trade would be to enter now - beneath the 20-day - anticipating a reversal. A more conservative approach would be to wait to see if ABBV reverses back above its 20-day EMA. I took the former approach and I've just entered this trade at 160. Placing a stop is up to each individual, but I do want to limit my exposure here, so I placed a 3% trailing stop. I'm willing to lose 3% for the potential opportunity to ride a reversal today. This type of reversal is what the Strong AD ChartList tells me is likely to happen - not a guarantee, however. I could easily be stopped out today, if the selling grows more intense. The past few days do show that most of ABBV's weakness ends in the morning:
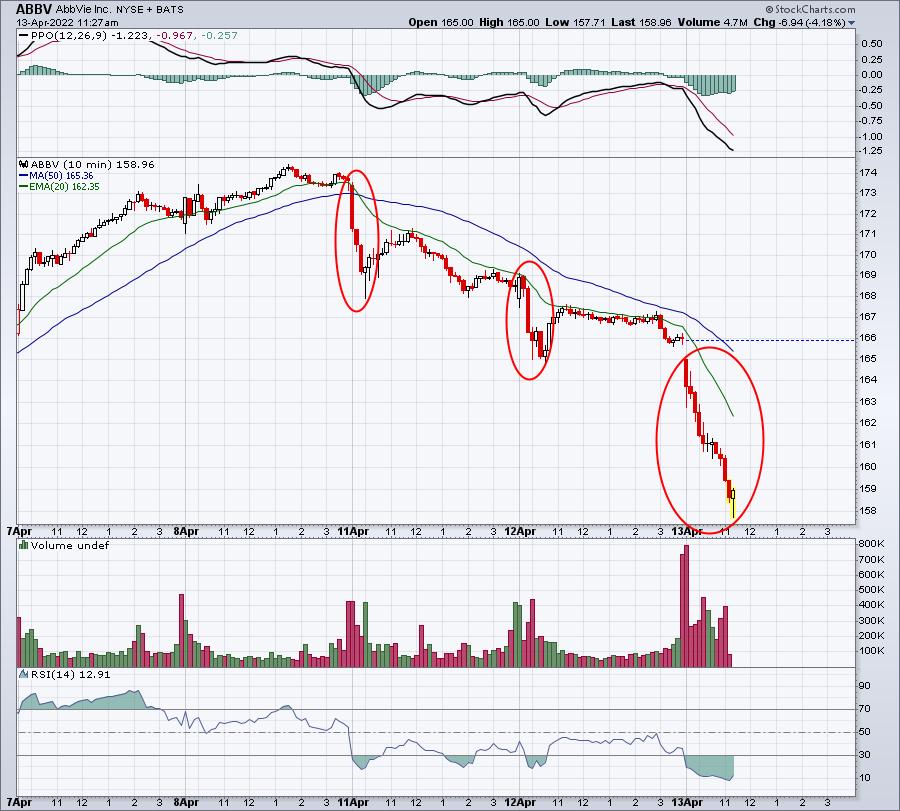
Maybe today's the day that it keeps dropping. The volume is accelerating, but that's how stops are triggered and inventories are built for market makers' institutional clients. I'll keep a stop in play, so I could become one of the "victims". The volume today could reach 10 million shares, the highest we've seen since February. Let's watch and see how this unfolds over the balance of the day, but given the increasing volume, that strong AD could be strengthened even further with a rally throughout the balance of the day.
Earnings Reports
Here are the key earnings reports for the next two days, featuring stocks with market caps of more than $10 billion. I also include a few select companies with market caps below $10 billion. Finally, any portfolio stocks that will be reporting results are highlighted in BOLD. If you decide to hold a stock into earnings, please understand the significant short-term risk that you are taking. Please be sure to check for earnings dates for any companies you own or are considering owning.
Wednesday, April 13:
JPM, BLK, INFY, FAST, FRC, DAL, SJR, SGHC, BBBY
Thursday, April 14:
UNH, WFC, MS, GS, C, PNC, USB, STT, ALLY
Economic Reports
March PPI: +1.4% (actual) vs. +1.1% (estimate)
March Core PPI: +1.0% (actual) vs. +0.5% (estimate)
Happy trading!
Tom