
EB Daily Market Report - Monday, April 18, 2022
Today's Event
Our "Sneak Preview: Q1 Earnings" webinar will be held at 4:30pm ET. I plan to cover the sectors and industry groups that I expect to see strong throughout earnings season. Also, I'll be providing individual stocks that look to report excellent results over the coming week, while also providing a handful where I wouldn't be surprised if we saw misses and/or warnings. The following is a link to the webinar room:
https://earningsbeats.zoom.us/j/89414845882
The room will open at 4:00pm ET. Hope to see you there!
If you can't make the live event today, we'll make sure the recording is available later this evening or the first thing tomorrow morning.
Executive Market Summary
- Futures were lower overnight, but did improve significantly before opening today just below the breakeven level
- There's a bit of relative weakness once again on the NASDAQ as communication services (XLC, -0.93%) is today's worst-performing sector
- Walt Disney (DIS, -2.34%) is testing key gap support and is the worst-performing Dow Jones component
- Energy (XLE, +1.80%) and financials (XLF, +0.68%) are the two best-performing sectors
- Crude oil ($WTIC, +2.50%) is nearing $110 per barrel, adding fuel to the energy fire
- Meanwhile, banks ($DJUSBK, +1.69%) are finally showing strength, lifting the XLF
- Bank of America (BAC, +4.30%) beat revenue and EPS estimates and that's aiding the entire banking group
- Most other commodities are higher, including gold ($GOLD, +0.74%) and copper ($COPPER, +1.62%)
- One troubling signal that has worsened today is the relationship between growth and value stocks - and it's occurring at the large, mid, and small cap levels
Market Outlook
There is still no sign of relative life in growth stocks. The following chart of the S&P 500 shows details of various growth to value ratios. None of them look good to me, suggesting that this market is not done moving lower:
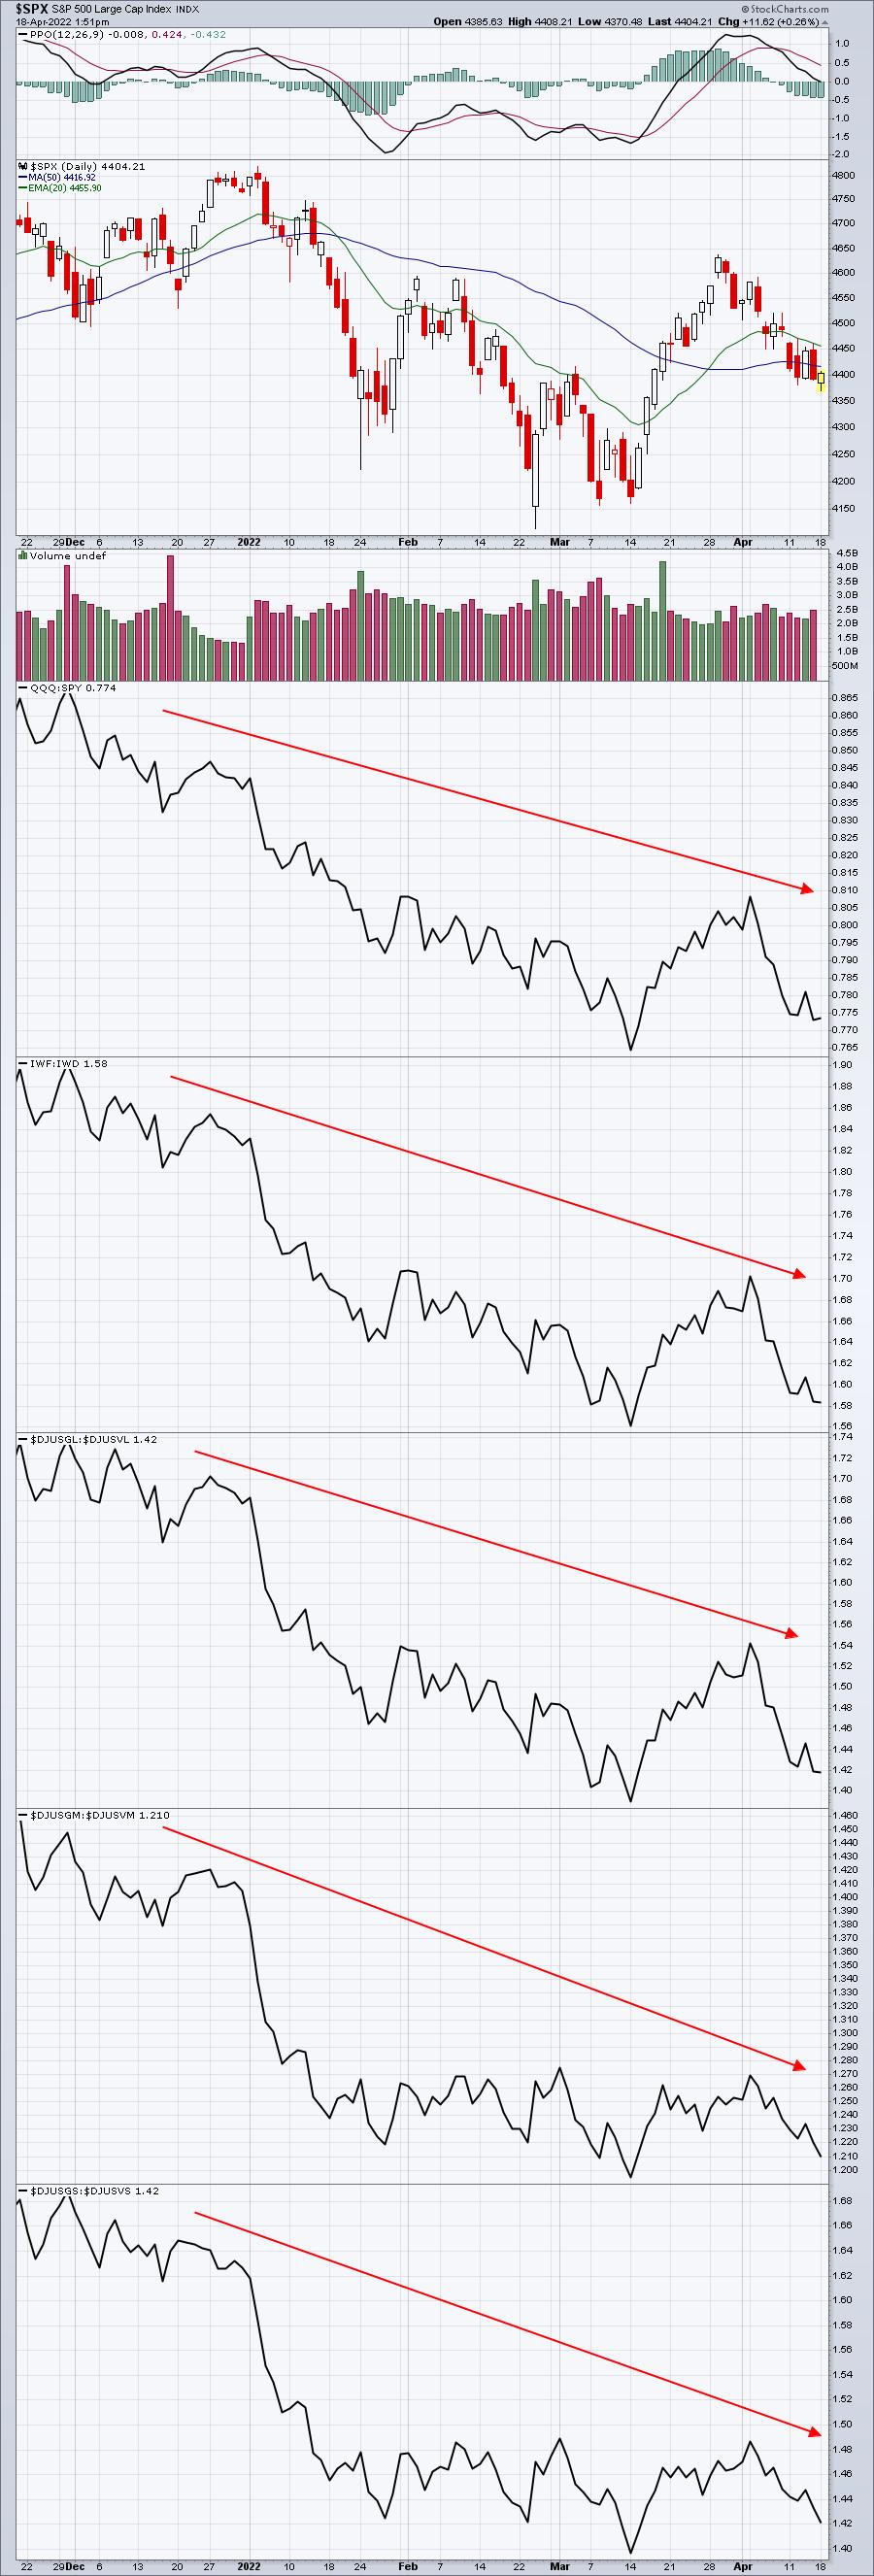
All 5 of the growth to value ratios above are closing in on their February lows. The S&P 500 is holding up better, because of value stocks. The problem is that value stocks can only carry the market for so long. When the weight of underperforming growth stocks becomes too much pain, the S&P 500 will likely roll over HARD. It already appears to be teetering.
Sector/Industry Focus
Let's talk historical performance. Today is April 18th. On the S&P 500 since 1950, April 1st through April 18th has been the strongest period of the month, producing an annualized return of +32.75% during this span. The S&P 500 ended March 2022 with a close of 4530.41. At last check at just before 2pm ET, the S&P 500 was trading at 4409.49, down close to 3% this month thus far. April 2022 isn't exactly living up to historical standards. The next 10 calendar days through April 28th has been historically flat over the past 7 decades. So unless the bulls can pull a surprise, there's not much seasonal hope right now as more and more earnings are released. If Wall Street's not buying companies ahead of their earnings reports, that tells me one thing. They don't anticipate a strong earnings season - or at least they're concerned about possible warnings.
Since the secular bull market began on April 10, 2013, the XLK and XLY have performed rather poorly from April 19th through the 21st. While I don't necessarily want to sugar coat this dismal performance, it is worth mentioning that both the XLK and XLY have historical tendencies of performing exceptionally well leading up to the 19th. So the 19th through 21st could be the start of the "sell on news" as earnings begin to pour out. Given the lack of "buy on rumor", maybe the 19th through 21st weakness doesn't hold true this year? Or maybe it's worse?
I don't have the answers, but I do know that the XLK and XLY house many growth stocks and they're simply not performing well right now. I'm afraid we're about to get some warnings from major technology and discretionary names - at least that's how the market seems to be trading. We'll soon find out.
ChartLists/Strategies
I have several charts to show you today. First, let's look at Walt Disney (DIS):
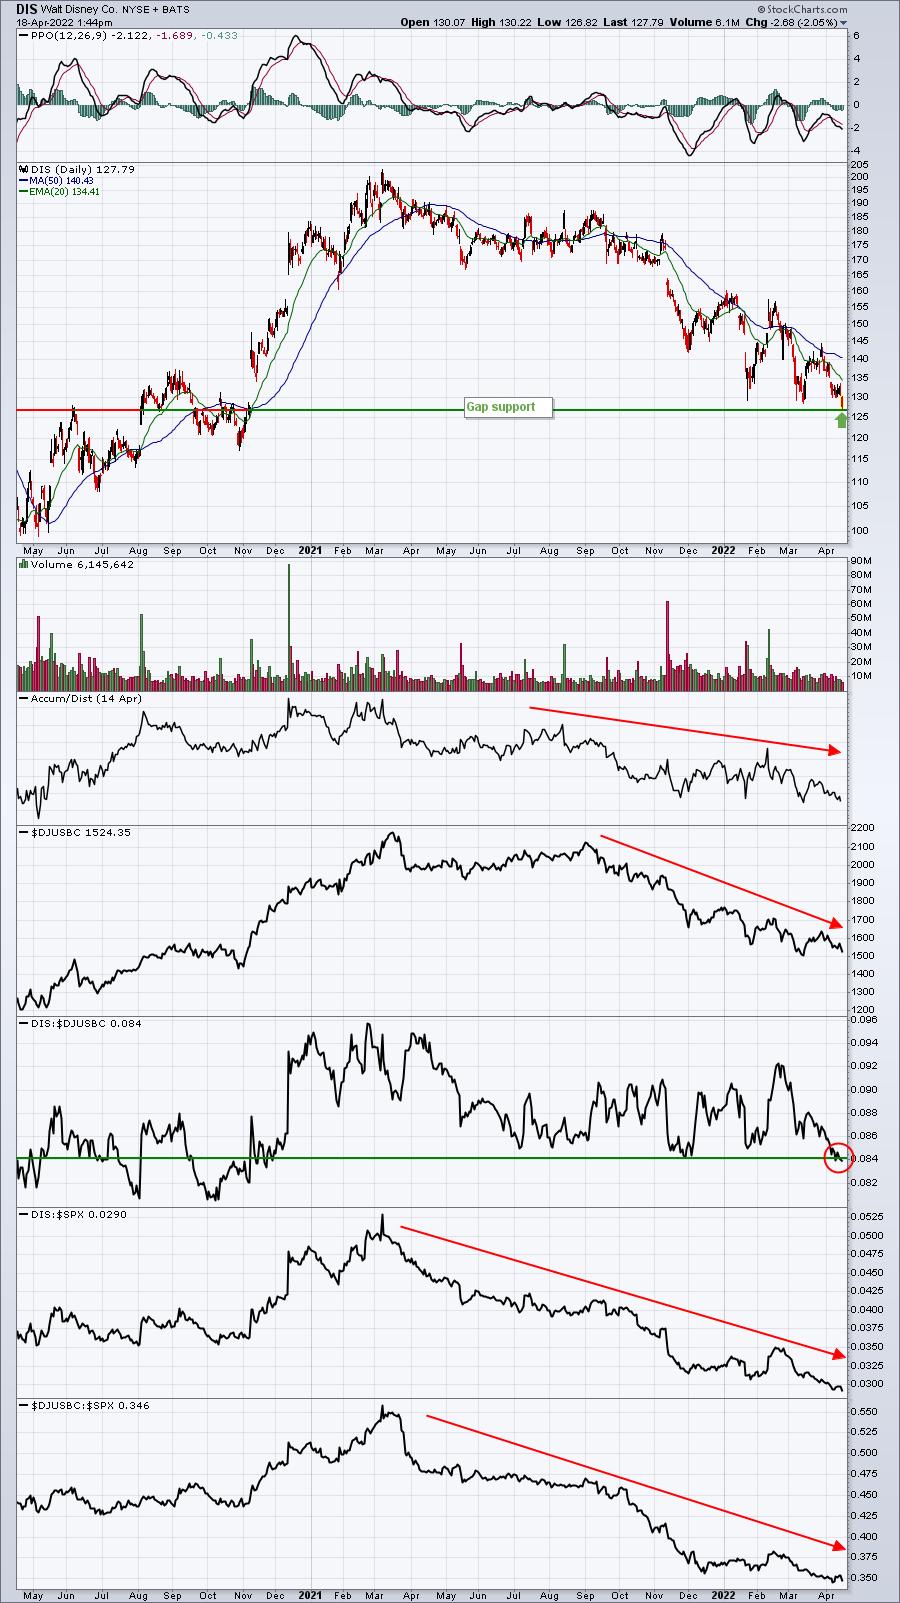
I mentioned earlier that it was testing key gap support and you can see that visually on this chart. If it fails to hold gap support, then obviously there's likely more downside ahead. All other signals on this chart point to weakness. DIS doesn't report earnings until May 11th, so can it hold support without an earnings catalyst?
I have a few other stocks testing key support from the Strong AD ChartList (SADCL). I'm much more drawn to trading stocks showing relative strength and a strong AD line (unlike DIS), especially if they're pulling back to test price support. Check out these 3:
IRTC (health care):
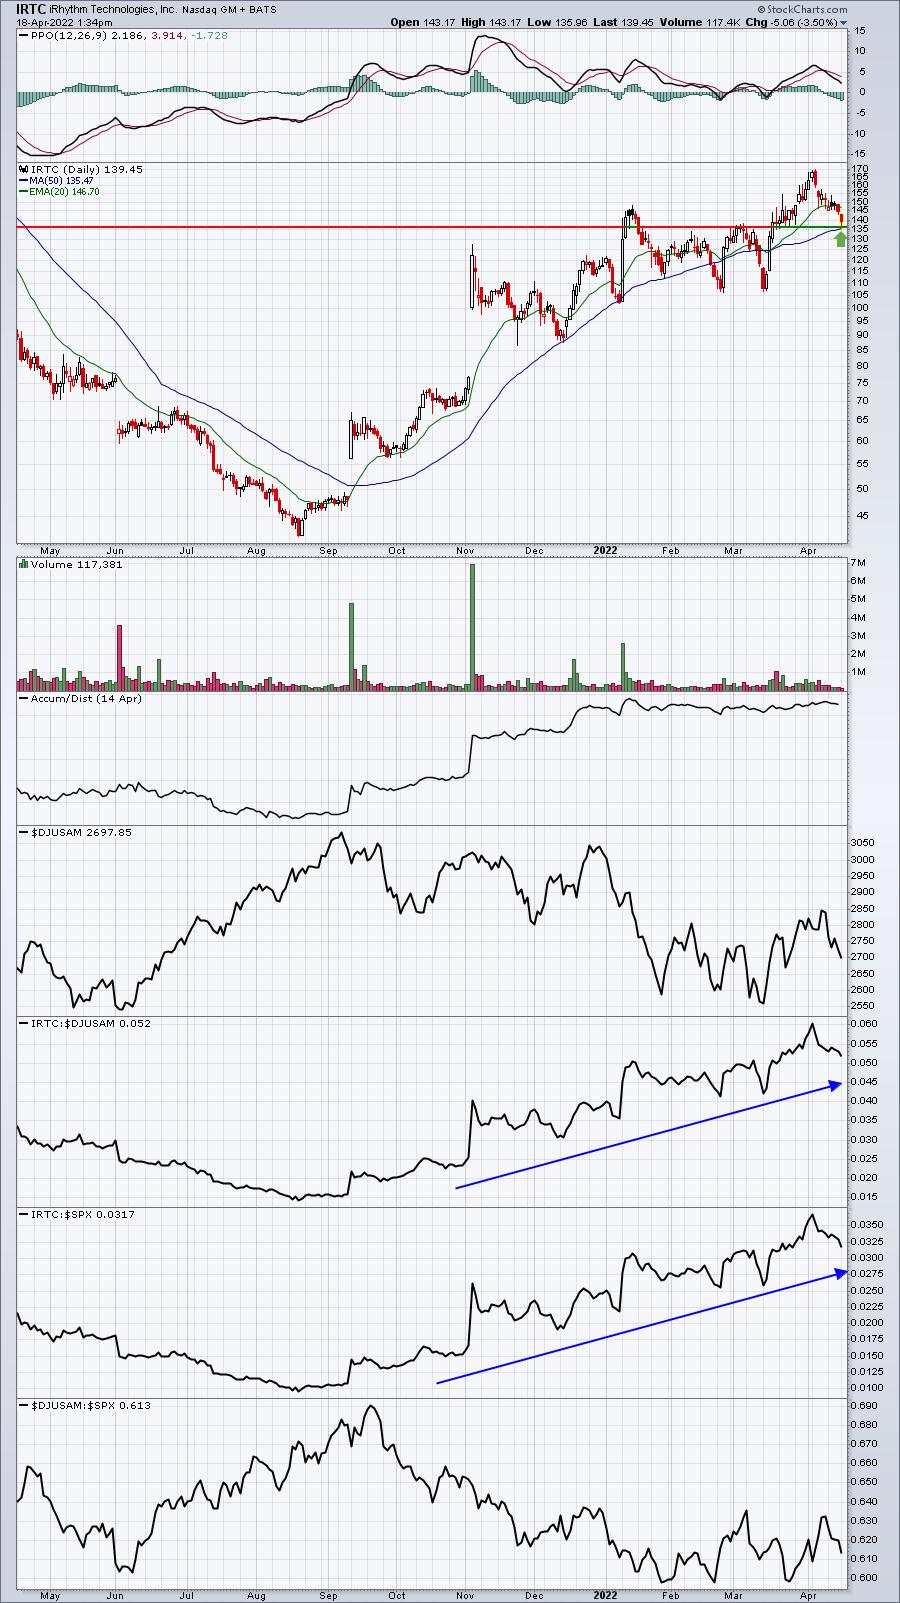
Health care is pulling back today and this could be providing a solid entry into a medical equipment leader, IRTC. I'd keep a tight closing stop beneath 135 and look for another test of the recent price high at 170.
CTRE (real estate):
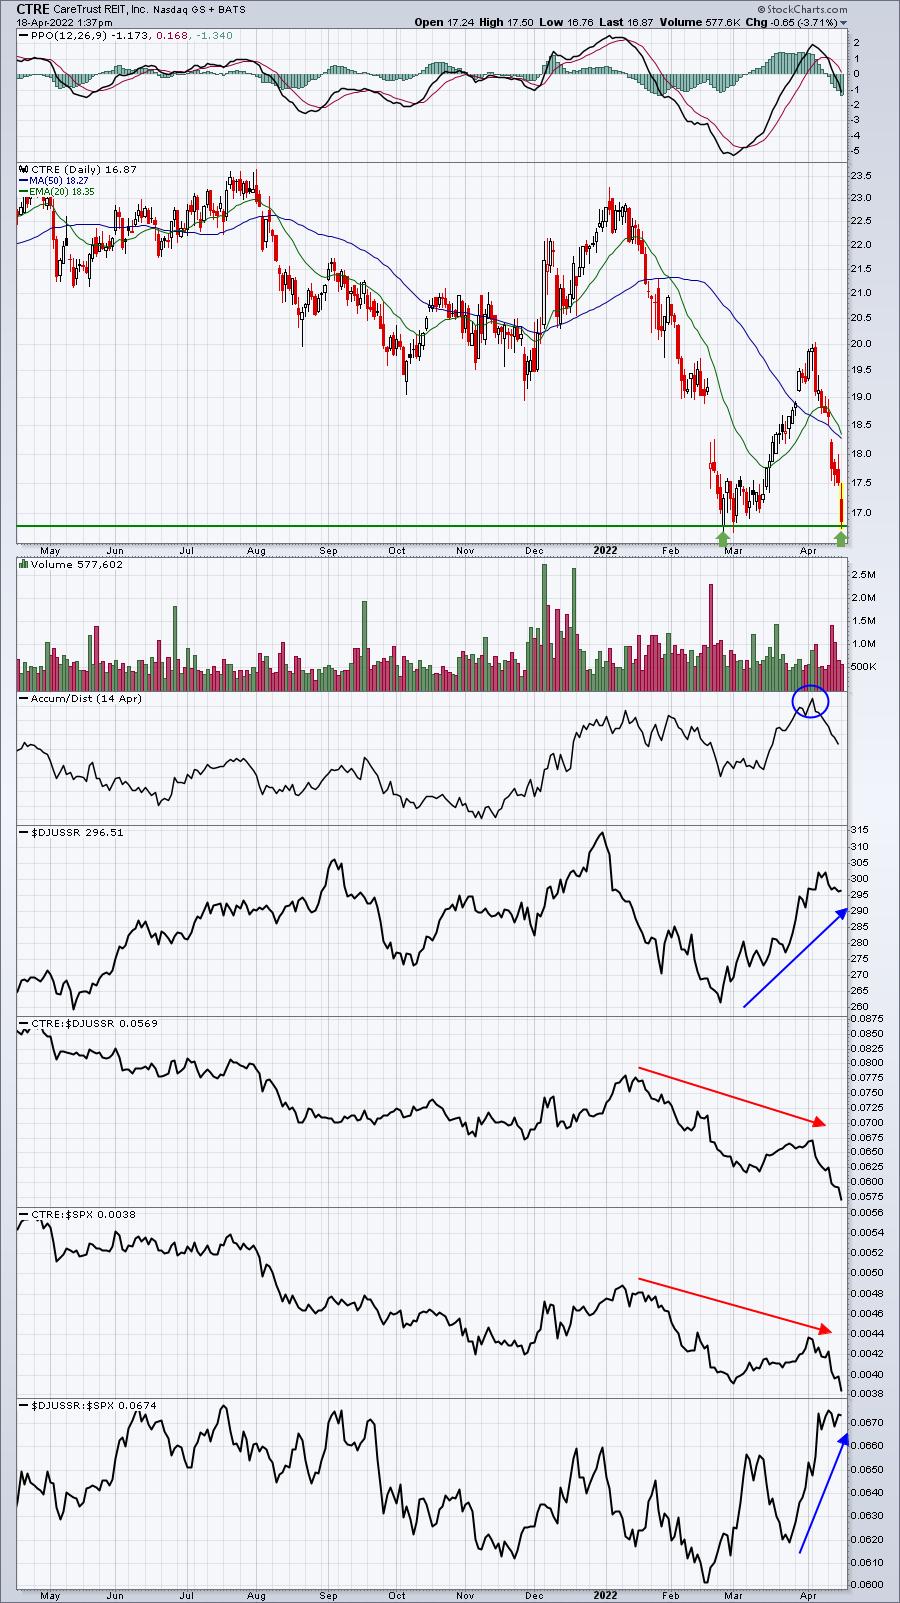
This is clearly a much riskier trade, in my opinion. I like the test of price support with an AD line that recently set a 52-week high. But I definitely would not ignore the relative weakness on this chart - and it's in real estate, and this sector has been seeing money rotate INTO it. So why isn't CTRE participating? I don't know, but if the stock closes beneath 16.75, I'd let someone else figure out why.
MP (materials):
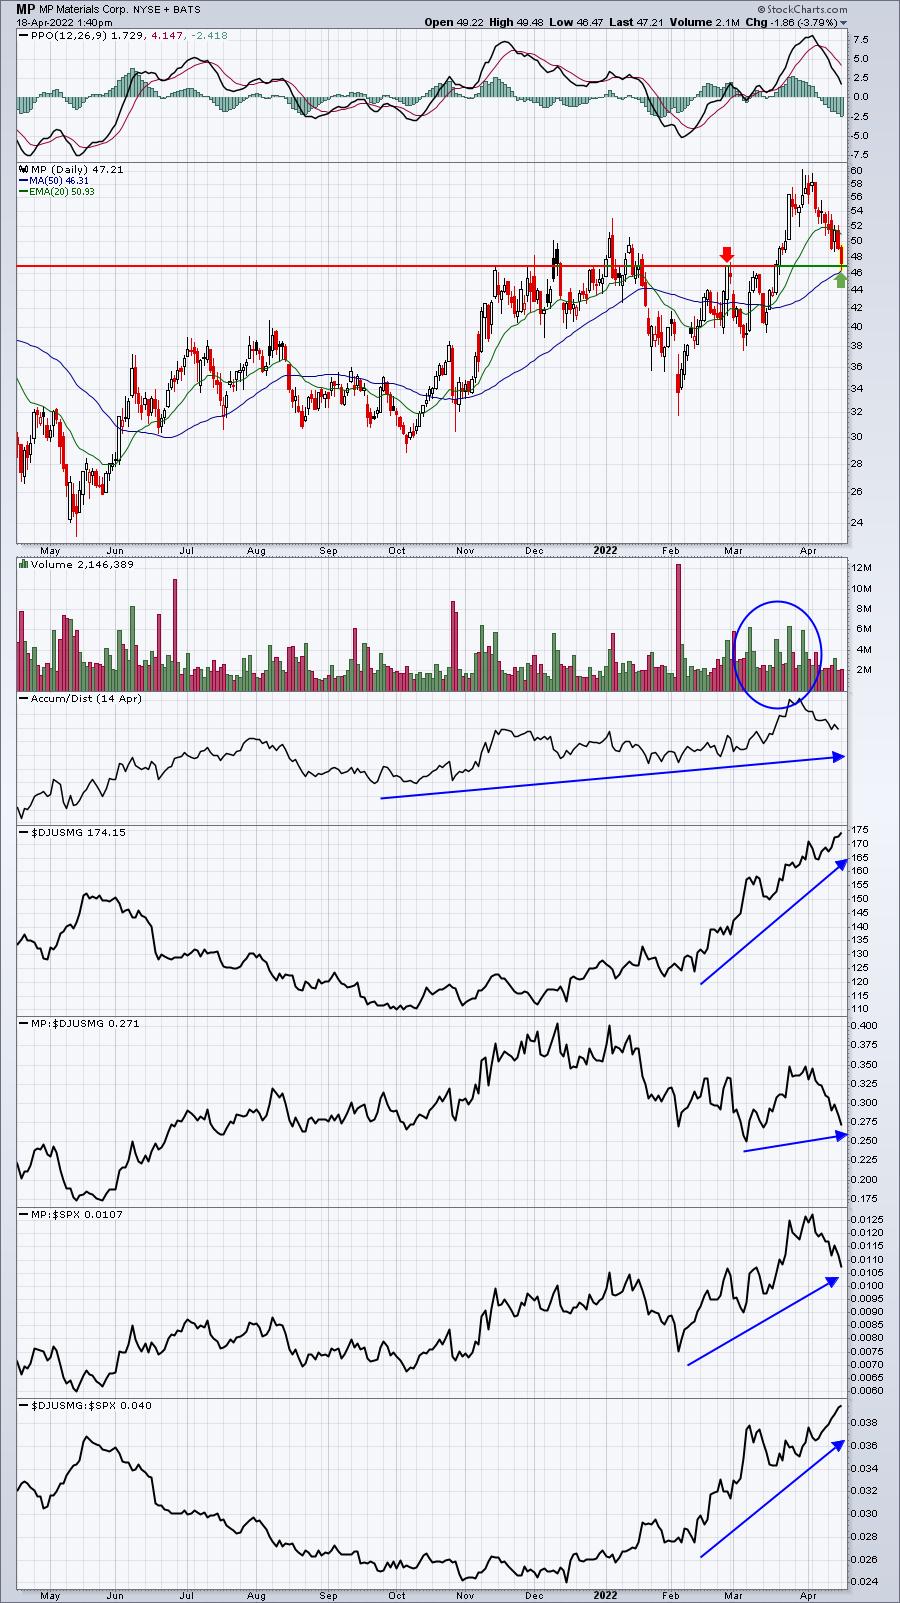
MP was at 60 at the beginning of the month, before falling back 20% to nearly test its 50-day SMA today. While MP certainly could just break down beneath its 50-day SMA, I find the reward to risk much more appealing at this level. Money continues to rotate into mining stocks, so MP has a case for returning back to its recent price high.
I deliberately selected stocks from sectors that are showing outperformance of late. Personally, I'd stick to what's working in this market - if I'm trading from a long perspective.
Earnings Reports
Here are the key earnings reports for the next two days, featuring stocks with market caps of more than $10 billion. I also include a few select companies with market caps below $10 billion. Finally, any portfolio stocks that will be reporting results are highlighted in BOLD. If you decide to hold a stock into earnings, please understand the significant short-term risk that you are taking. Please be sure to check for earnings dates for any companies you own or are considering owning.
Monday, April 18:
BAC, SCHW, BK, SYF, JBHT, ELS, PNFP
Tuesday, April 19:
JNJ, NFLX, LMT, PLD, IBM, TFC, TRV, HAL, IBKR, FITB, CFG, OMC, SBNY, FHN, REXR, HAS, CBSH, IRDM, WTFC, MAN, PACW, HWC, SI, UCBI, BMI, FULT, LRN, MRTN
Economic Reports
April housing market index: 77 (actual) vs. 78 (estimate)
Happy trading!
Tom