
EB Daily Market Report - Tuesday, April 19, 2022
It's Draft Day!
At 5:30pm ET today, I'll announce the ETFs that will comprise our Model ETF Portfolio for the next 90 days. At the beginning of the year, I discussed the difficulties that the market faced in early 2022 and our Model ETF Portfolio was designed (and ETFs were "drafted") with that in mind. Not a whole lot has changed in terms of market strength and the difficulties that lie ahead, so today will mark a second ETF draft day where safety is going to be a primary theme. It worked over the past three months as our Model ETF Portfolio is up 0.85% during that period, while the benchmark S&P 500 has fallen 3.11%. We'll do our best to achieve another quarter of outstanding relative performance and it all begins TODAY! Below is a link where you can join me for our 5:30pm ET Draft:
https://earningsbeats.zoom.us/j/85349429243
The room will open by 5:00pm ET. If you cannot make this event live, no worries. We record all of our events and we'll make sure you get a copy of today's session for viewing at your leisure.
Executive Market Summary
- Futures were relatively flat and we opened with little fanfare
- We've since seen a lot of morning strength, but can we hold the gains throughout the afternoon?
- Consumer discretionary (XLY, +2.24), led by gambling stocks ($DJUSCA, +4.60%), is the best-performing sector
- Real estate (XLRE, +1.81%) and communication services (XLC, +1.45%) are also performing well
- Energy (XLE, -0.58%) is the only sector out of 11 that is in negative territory
- Commodities are having a rough day with crude oil ($WTIC, -3.96%) and gold ($GOLD, -1.49%) leading the way
- The 10-year treasury yield ($TNX) is up 4 basis points to 2.90% - not far from another psychological level at 3%
- IMF cut its global growth forecast, citing the Russia-Ukraine war, and says risks to the economy have risen sharply
- Johnson & Johnson (JNJ, +3.35%) lowered its revenue and EPS forecast for 2022, but leads the Dow Jones higher
Market Outlook
There is no disputing the fact that economic conditions for homebuilders ($DJUSHC, +3.85%) has worsened in 2022. Rising interest rates alone can dampen enthusiasm for the group. Throw in falling consumer sentiment and you the recipe for a struggling group. But, at least for a day, we've received good news for the group. March housing starts and building permits both exceeded expectations and we're seeing an expected bounce in the DJUSHC:
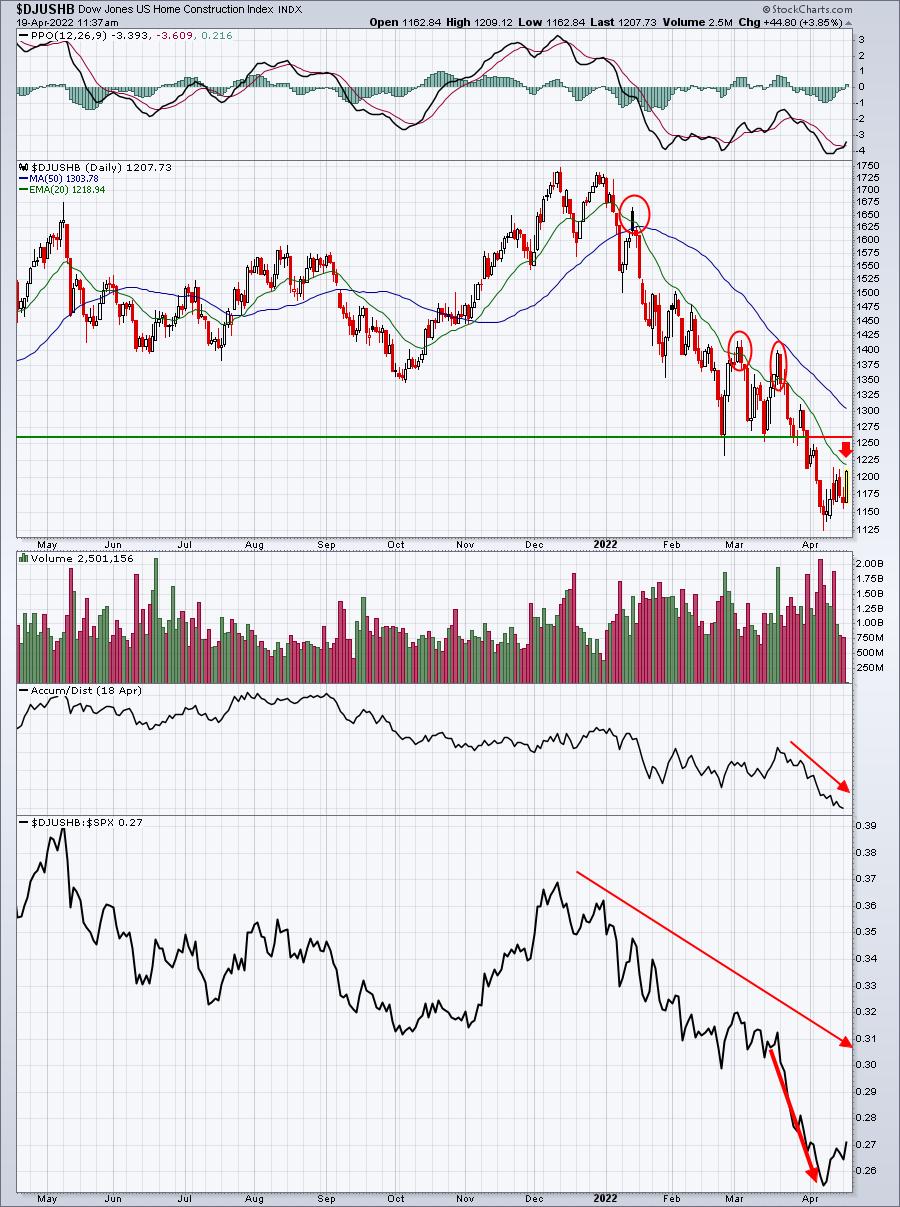
We've seen 3 failed attempts at clearing the declining 20-day EMA since the start of the year. Today's rally is awesome, BUT we haven't seen anything of technical significance. The DJUSHB relative strength panel beneath the price chart shows that the group absolutely was crushed on a relative basis from mid March through early April. It makes sense that the group show at least a small short-term relative bounce and today's news is helping the group to achieve that.
I'm not sold on a longer-term basis, however. Price resistance near 1260 is the most important level on the chart. Unless/until the DJUSHB can clear that level, I'd remain cautious the group, viewing rallies as nothing more than short-term oversold bounces.
Sector/Industry Focus
Is there an appetite for defensive stocks? Well, one look at the reaction to Johnson & Johnson's (JNJ) quarterly earnings report and 2022 guidance should answer that question. On a positive note, JNJ did beat its quarterly EPS consensus estimate and it did raise its quarterly dividend. However, revenues came up short, guidance was reduced, and JNJ suspended its COVID-19 vaccine sales guidance based primarily on demand uncertainty. Yet the stock and its pharmaceutical industry peers ($DJUSPR) continue to find lots of buyers. Check out this chart:
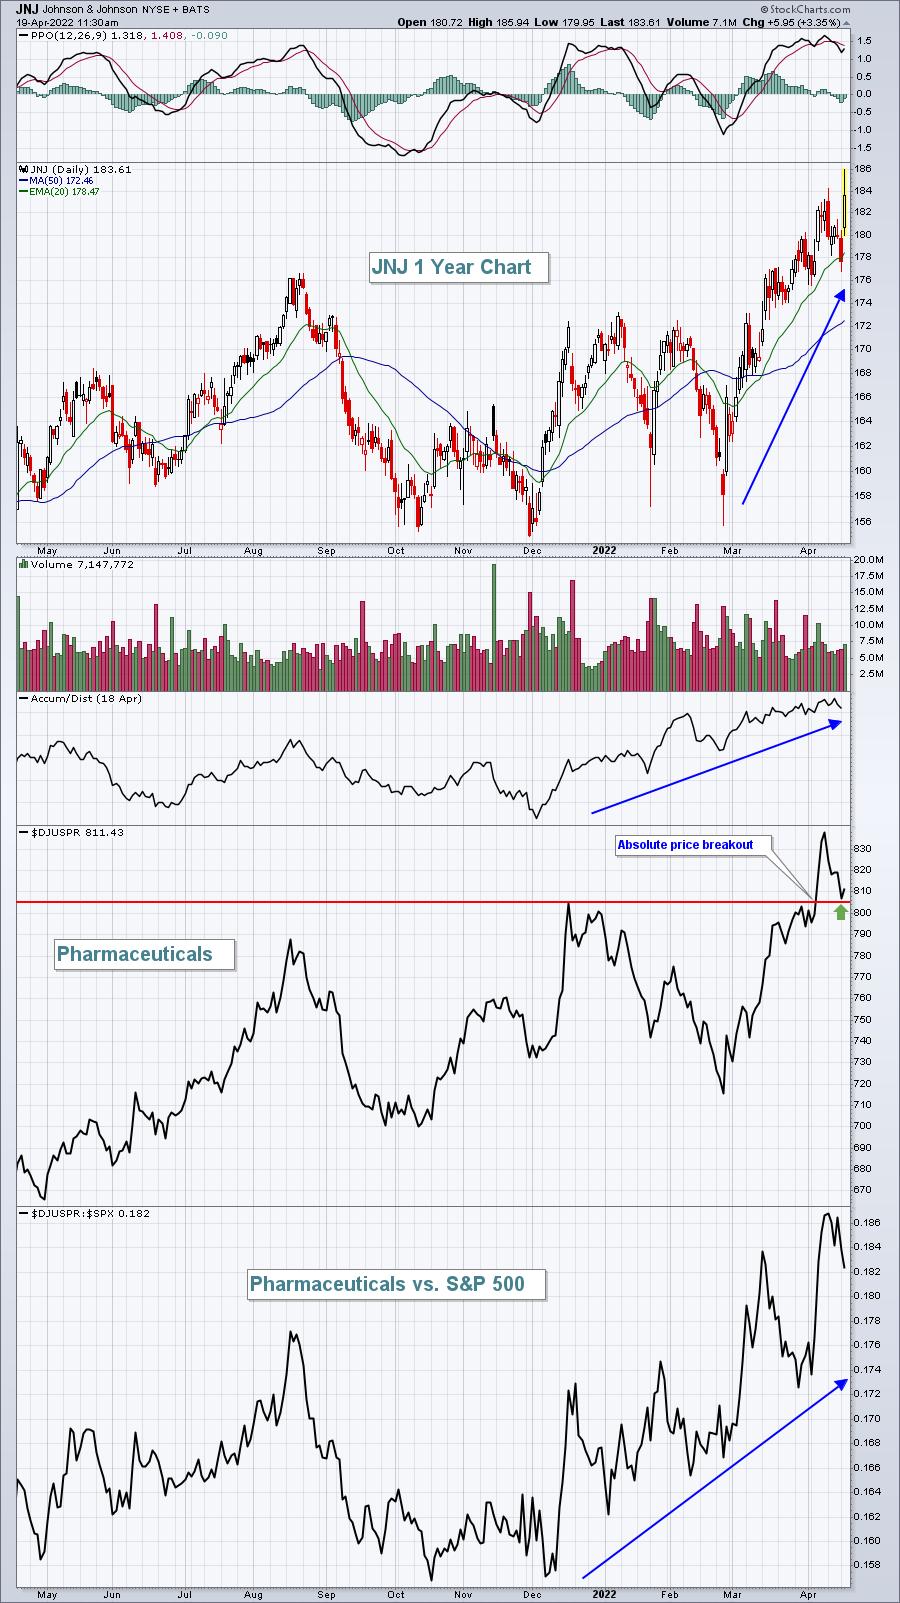
I don't argue with relative strength. Wall Street has been pouring resources into defensive areas, including pharmaceuticals and JNJ's mixed report has done nothing to change that.
ChartLists/Strategies
The number of companies slated to report quarterly results will continue to grow over the next 2-3 weeks. Currently, many of the behemoths are reporting, including dozens and dozens of banks. Beginning next week, and especially the following week, we'll see more and more of the growth stocks report results. THAT is going to be extremely interesting given that many seem to be pricing in slowing growth rates. If they do report bad news, how will the market react? Will Wall Street begin accumulating shares as bad news hits? The answers will go a LONG way towards determining whether a bottom is in.
In the meantime, and as I discussed at last night's "Sneak Preview: Q1 Earnings" webinar, I will follow relative strength and AD lines to help me forecast the type of report companies are most likely to provide. Unitedhealth Group (UNH) looked exceptionally strong heading into earnings and it reported better-than-expected revenues and EPS. Yet the stock is trading almost exactly where it was when the news came out. Think "buy on rumor, sell on news." I really like UNH, but we could see a better entry before it moves up again and breaks out.
Halliburton (HAL) was another that looked exceptionally strong heading into its earnings report this morning and the company came through. It reported revenues and EPS ahead of consensus estimates, but its price chart already looks a bit like UNH. Check this out:
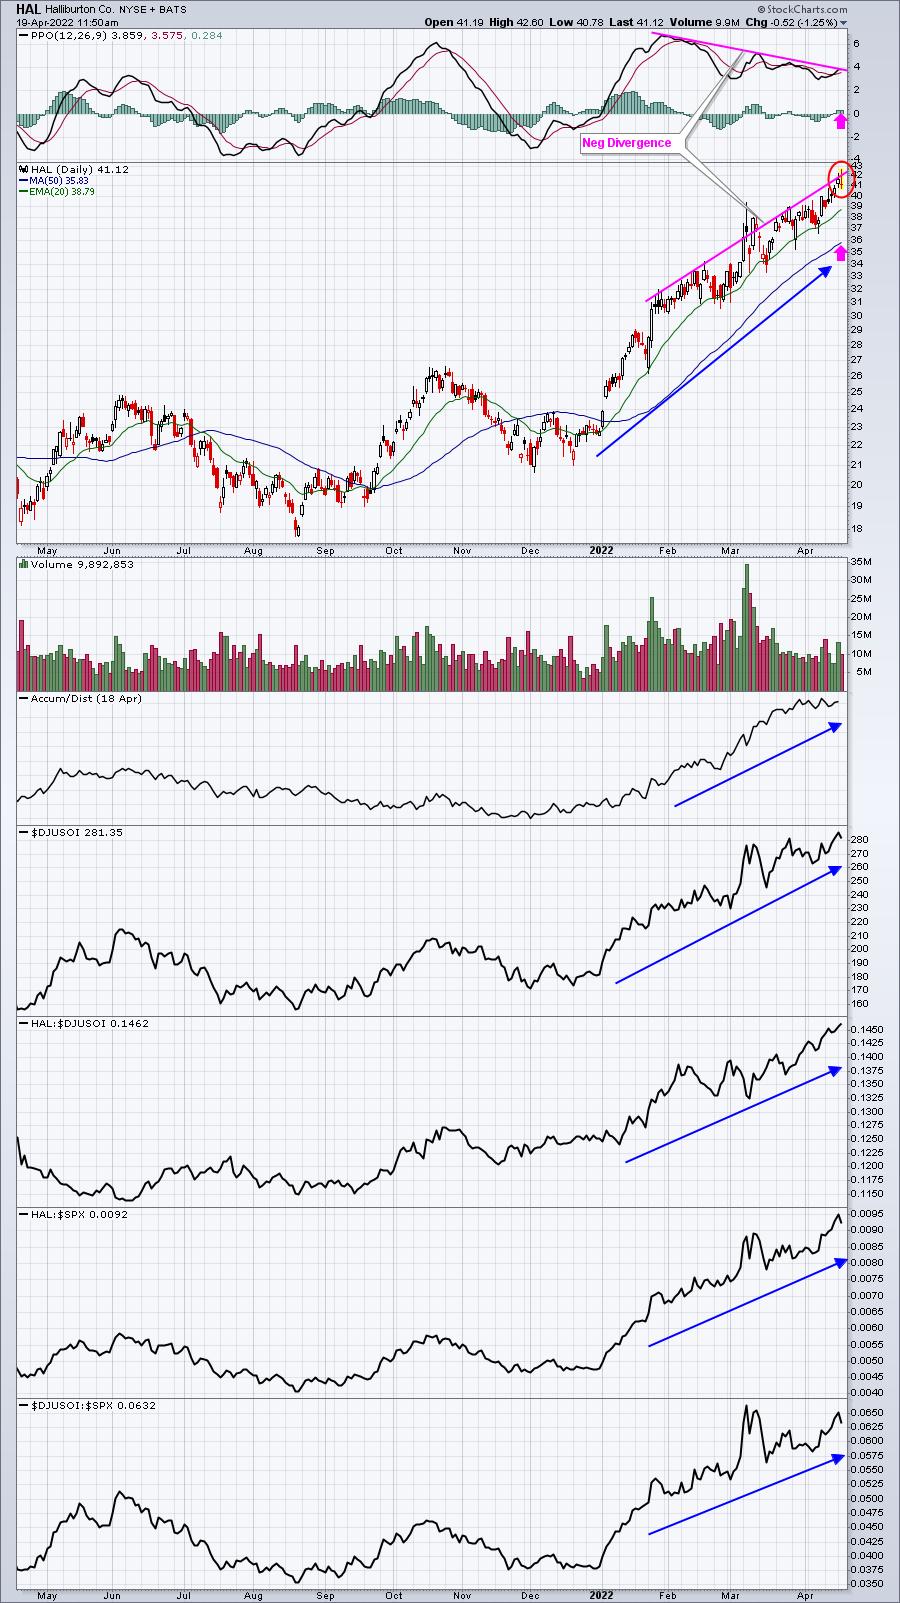
This is a superb-looking chart, but price momentum appears to be slowing and we could see a "sell on news" scenario develop. Already, HAL has fallen 1.48 from its intraday high. Volume is strong, so profit taking could be the culprit near-term. I like HAL in the 36-38 range, if it were to fall that far.
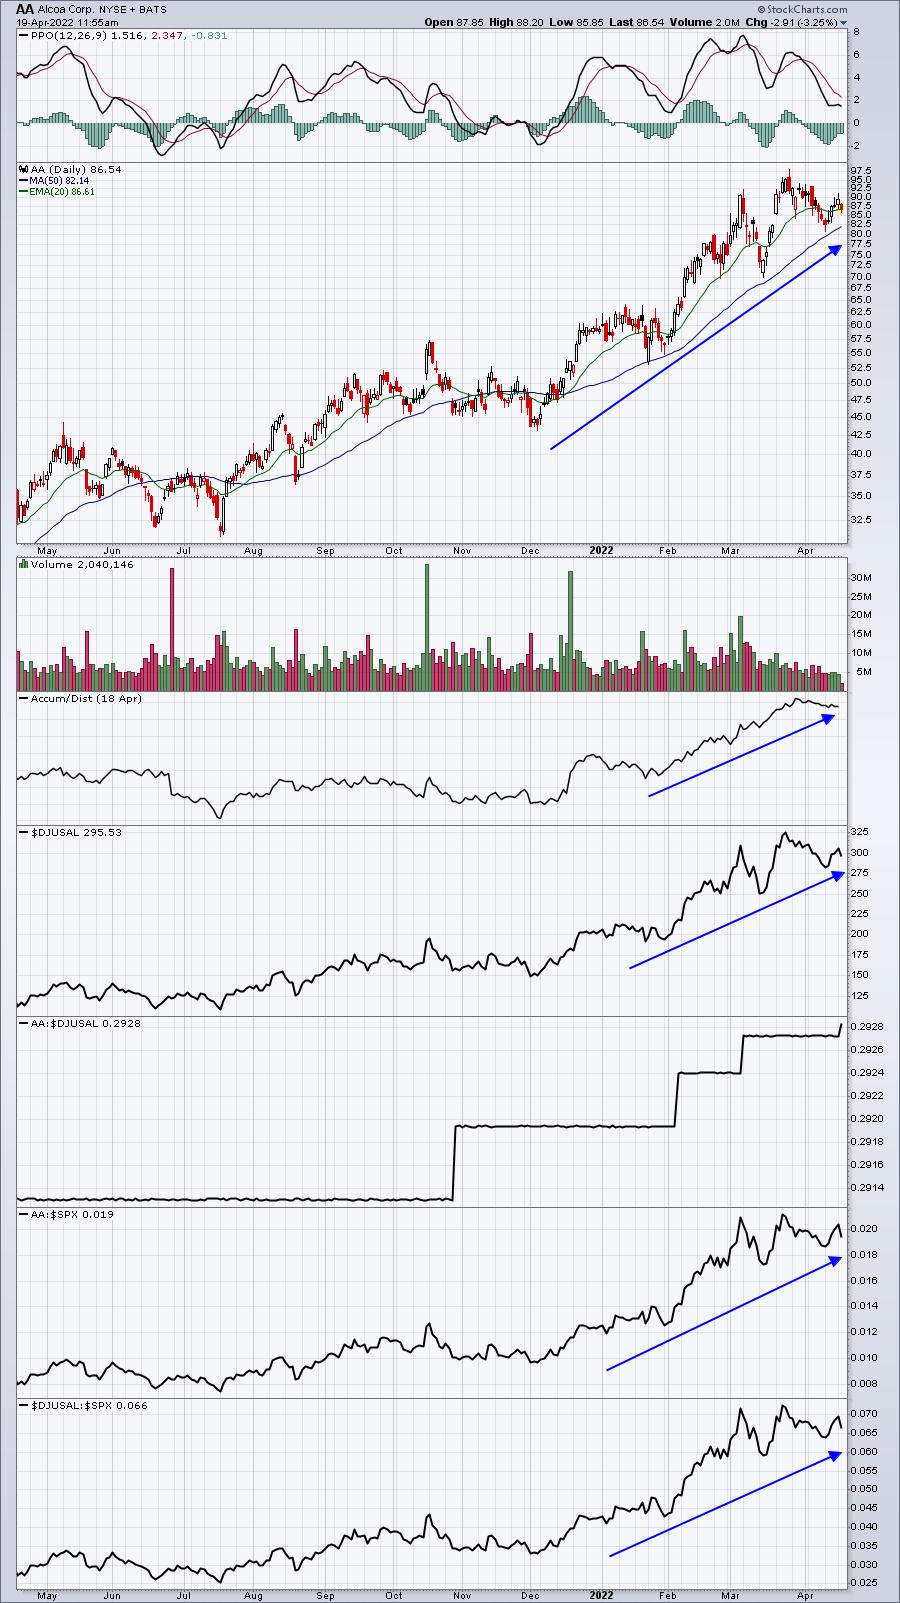
Below are two companies reporting quarterly results on Wednesday. One (AA) looks to report blowout numbers, while the other (CVNA) could drop a bomb. Wall Street has been accumulating AA and distributing CVNA, which I believe is quite evident from these two charts:
AA:
CVNA:
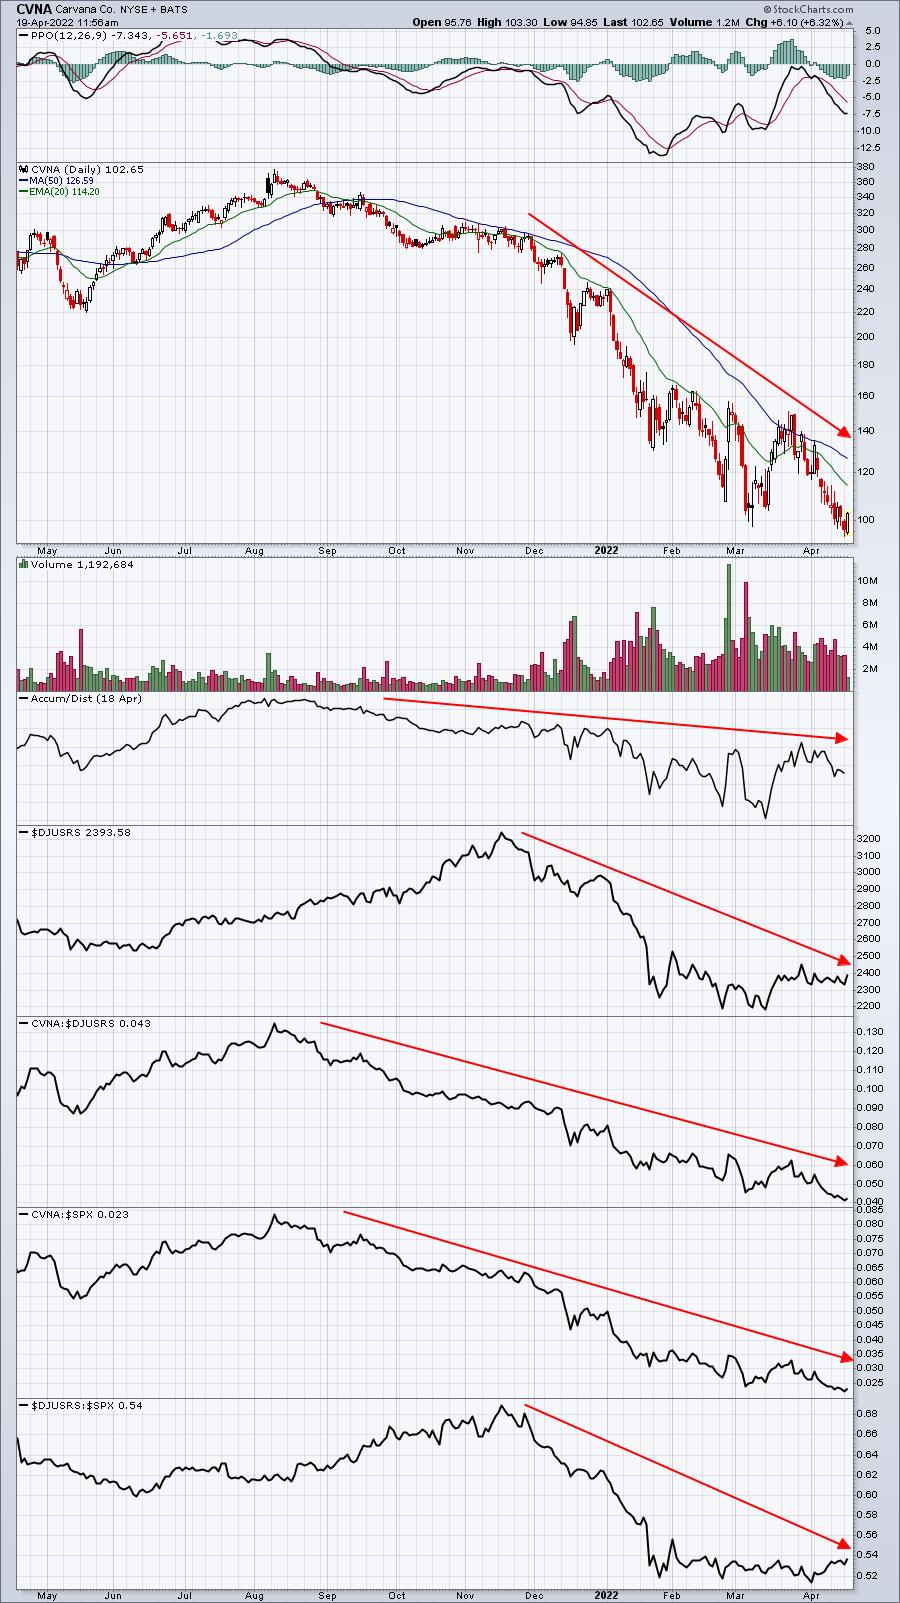
Why is AA rising strongly into its earnings report, while traders can't escape CVNA fast enough? Well, there are NEVER any guarantees, but from these two charts, I'd say that Wall Street has met with company management teams and expects excellent news tomorrow from AA. I can't say the same for CVNA. It'll be fun to see the actual results tomorrow and then to watch the reactions from Wall Street. CVNA, because it's so oversold, might see a relief rally for a brief period - think "sell on rumor, buy on news." But beyond that, I'd be very, very careful with CVNA. On the other hand, any "sell on the news" for AA could represent a great buying opportunity.
Earnings Reports
Here are the key earnings reports for the next two days, featuring stocks with market caps of more than $10 billion. I also include a few select companies with market caps below $10 billion. Finally, any portfolio stocks that will be reporting results are highlighted in BOLD. If you decide to hold a stock into earnings, please understand the significant short-term risk that you are taking. Please be sure to check for earnings dates for any companies you own or are considering owning.
Tuesday, April 19:
JNJ, NFLX, LMT, PLD, IBM, TFC, TRV, HAL, IBKR, FITB, CFG, OMC, SBNY, FHN, REXR, HAS, CBSH, IRDM, WTFC, MAN, PACW, HWC, SI, UCBI, BMI, FULT, LRN, MRTN
Wednesday, April 20:
TSLA, PG, ASML, ABT, ANTM, CCI, CSX, LRCX, KMI, BKR, RCI, NDAQ, EFX, MTB, CVNA, STLD, AA, UAL, CMA, MKTX, THC, LAD, FR, SEIC, KNX, LSTR, VMI, RLI, SLG, GATX, UMPQ, LBRT, HCSG, SNBR
Economic Reports
March housing starts: 1,793,000 (actual) vs. 1,750,000 (estimate)
March building permits: 1,873,000 (actual) vs. 1,830,000 (estimate)
Happy trading!
Tom