
EB Daily Market Report - April 21, 2022
Executive Market Summary
- Futures surged after Tesla (TSLA, +5.81%) reported better-than-expected revenues and earnings
- Unfortunately, that early buying has been followed by more selling
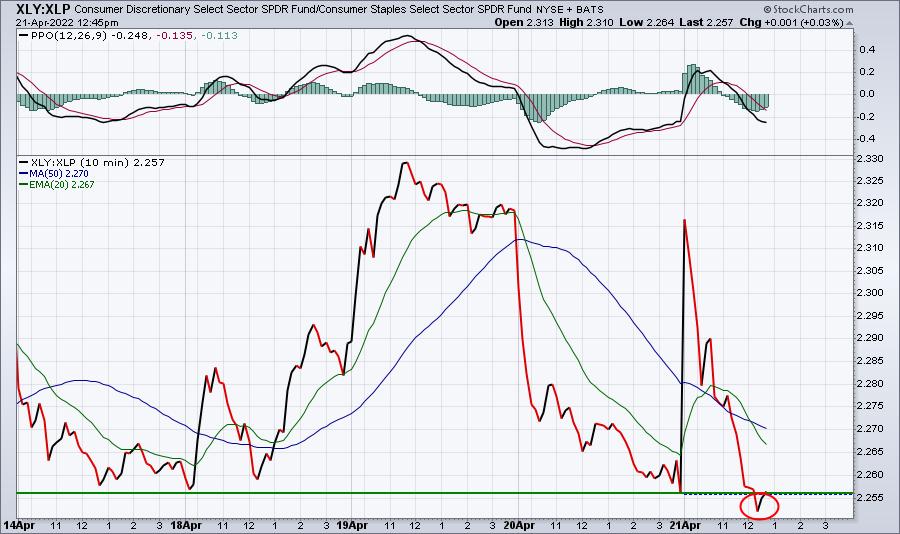
- Shockingly, consumer staples (XLP, +0.46%), at last check, had overtaken consumer discretionary (XLY, +0.44%) in terms of sector leadership
- The two consumer sectors are the only sectors in positive territory; communication services (XLC, -2.01%) is the worst-performing sector today
- Crude oil ($WTIC, +1.34%) is up slightly, but most other commodities are lower
- The 10-year treasury yield ($TNX) has surged another 11 basis points to 2.95%, spooking many aggressive growth-oriented areas of the market
- Growth stocks (IWF, -0.57%) are now underperforming value stocks (IWD, -0.46%) after having a HUGE lead at the opening bell
- Airlines ($DJUSAR, +4.58%) are among the strong industry groups today, while aluminum ($DJUSAL, -17.15%) takes a huge hit
- Alcoa (AA, -16.75%) is one of the day's biggest laggards after falling short of revenue expectations
Market Outlook
Today's action is another great example of the difference between "on the surface" action and "beneath the surface" action. Let's start with "on the surface."
All of our major indices opened much higher, led earlier by the more-aggressive NASDAQ. Consumer discretionary (XLY), in particular, soared at the open after a strong earnings report by Tesla (TSLA). So the good news was the positive reaction to a leading stock's earnings report. HOWEVER, the "beneath the surface" action since the open is telling us a completely different story. You know that I like to follow the relationship between discretionary and staples stocks (XLY:XLP). We've seen two sizable gaps higher in the NASDAQ the past two days, but as soon as the opening bell rings, Wall Street sells the aggressive discretionary stocks. Check out this 5-day, 10-minute relative chart:
It's very disheartening to see TSLA's great report result in further intraday selling of discretionary stocks. If I pull up the same 5-day chart of TSLA, look at the last two days - it's been selling all day. Even the two days prior, the only buying really occurred during the first hour of the day with no follow-through:
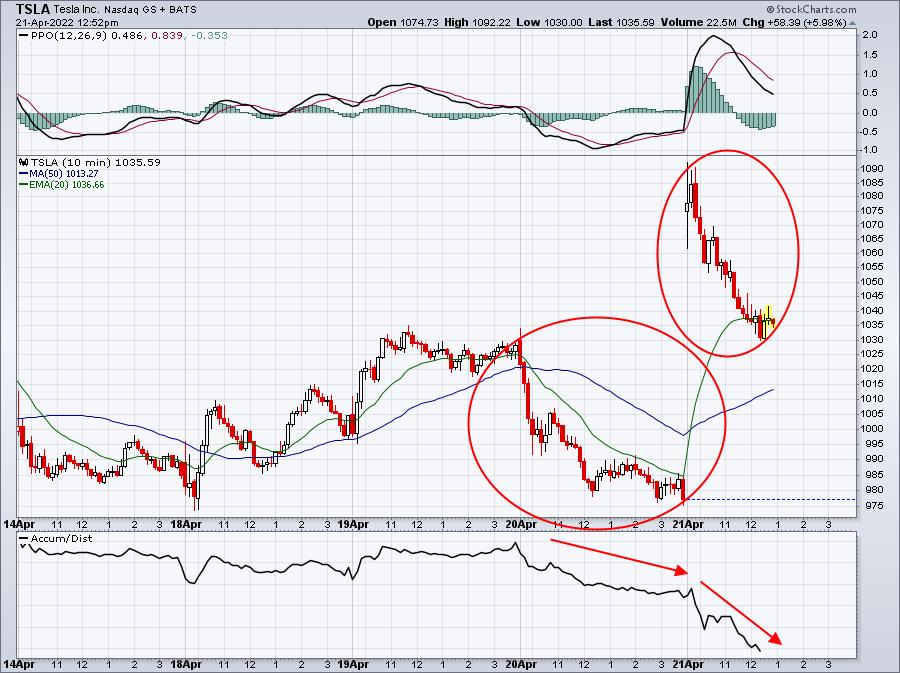
I don't usually pay much attention to a 10-minute AD line, but in this case, I believe it does help to paint a rather bearish picture here that's worth noting.
Again, on the surface, TSLA reports great earnings, gaps up 100 bucks and sees early strength. But since then, there have been nothing but sellers and that, in a nutshell, is the problem with the stock market in 2022. Every piece of good news is an opportunity for institutions to sell and move into the more defensive staples area.
Sector/Industry Focus
Materials (XLB) have been on quite a run since the first week of March, rising from 79 to yesterday's close of 90.64 - the highest close ever on the XLB. Here's the 1-year daily chart to visualize the advance:
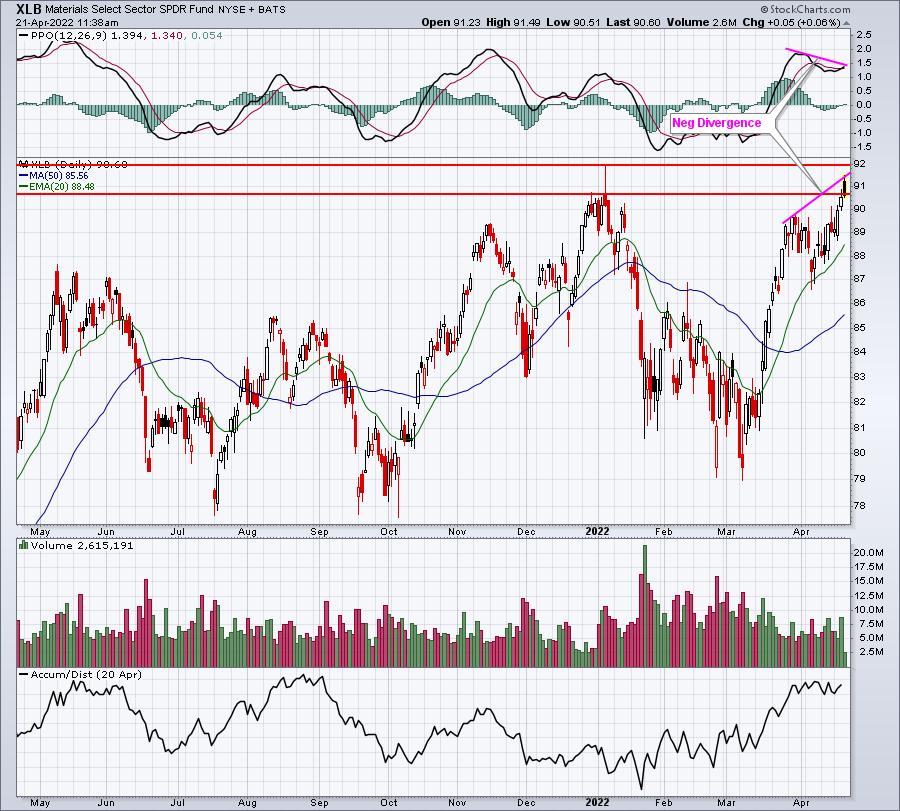
Momentum has been weakening on the XLB and it is at a key resistance level, so I'd suggest the short-term reward to risk is not very good. After gapping higher this morning, the XLB has reversed and is printing a filled candle. I'd be even more concerned if the selling intensifies later today and a bearish engulfing (reversing) candle prints.
Looking at a daily RRG chart of the various industry groups within materials, we can visualize the relative (vs. the S&P 500) short-term strength and momentum of each industry:
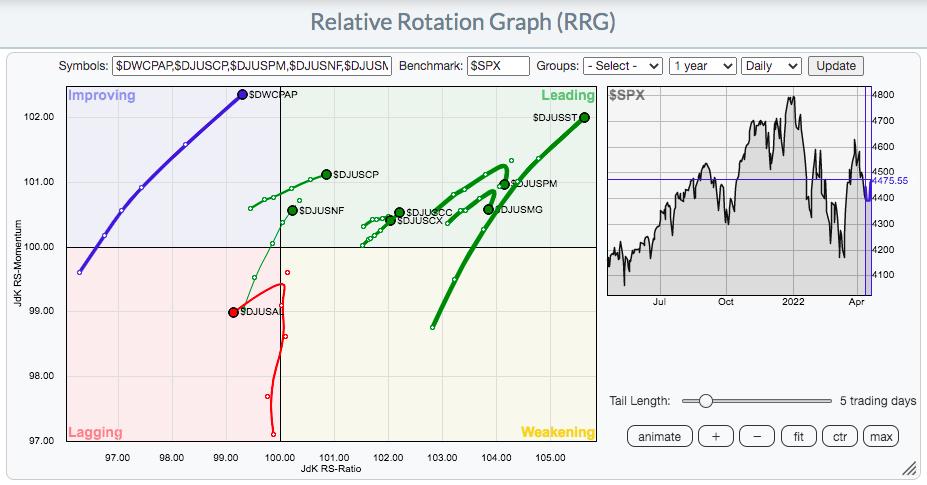
As I look at this, I see steel ($DJUSST) exploding to the upside and leading materials right now. To a lesser degree, I see commodity chemicals ($DJUSCC) and specialty chemicals ($DJUSCX) leading as well, though not as drastically. Aluminum ($DJUSAL), meanwhile, is taking a breather. It looks bad on this daily RRG chart, but it had shown so much relative strength earlier in 2022 that it simply needs a rest.
ChartLists/Strategies
Let's focus on the two industry groups in materials that I indicated are improving and see what individual stocks might be attractive in those two groups. First, I'll dive into the DJUSCC:
One quick way to identify all stocks in our key ChartLists within these two industry groups is to run a scan against our ChartLists. Here's what this scan would look like in my StockCharts.com account:
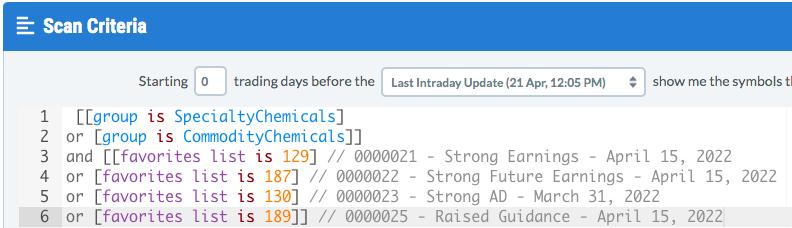
Now remember the favorites list shown above come from MY StockCharts.com account. If you type the above scan syntax EXACTLY as it appears above into YOUR StockCharts.com account, it will likely come back with ZERO results, because YOUR StockCharts.com account will not recognize MY favorites lists. You need to make sure that when you set your scan up, you're asking StockCharts.com to look at these lists in YOUR StockCharts.com account.
When I ran this scan, 36 companies were returned. I've provided you a picture of those with SCTR scores above 80 and the list is in SCTR score, from highest to lowest:
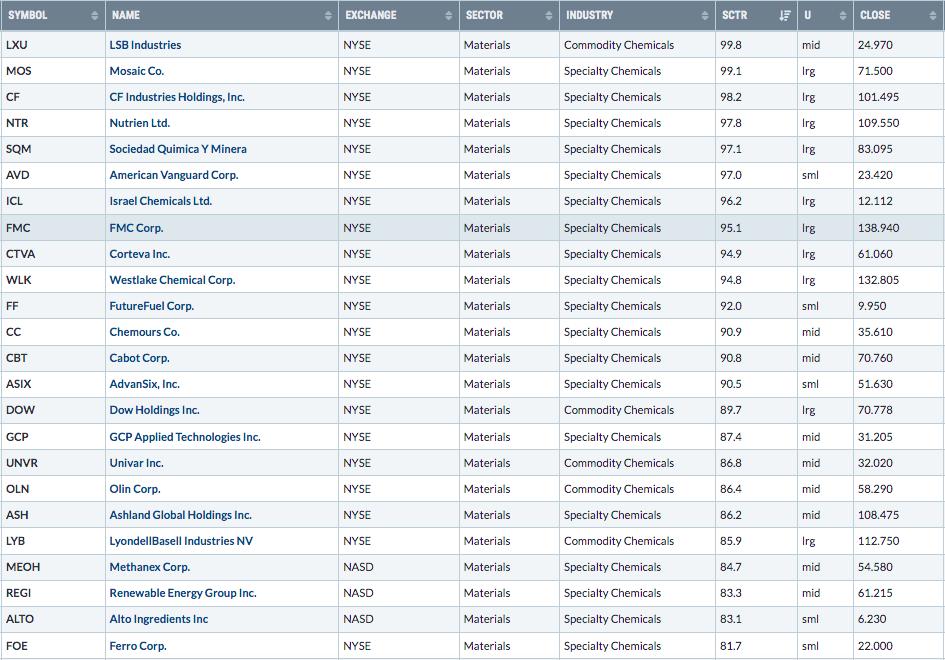
As I looked at these Top 24 stocks, here are two that I thought looked very interesting technically:
LXU:
There's a reason why LXU has a SCTR score of 99.8. It's been one of the strongest stocks in 2022, up more than 150% year-to-date. Its AD line has been unbelievably strong, so any day of significant morning selling has generally provided an excellent opportunity for entry. Today, LXU is down nearly 7%:
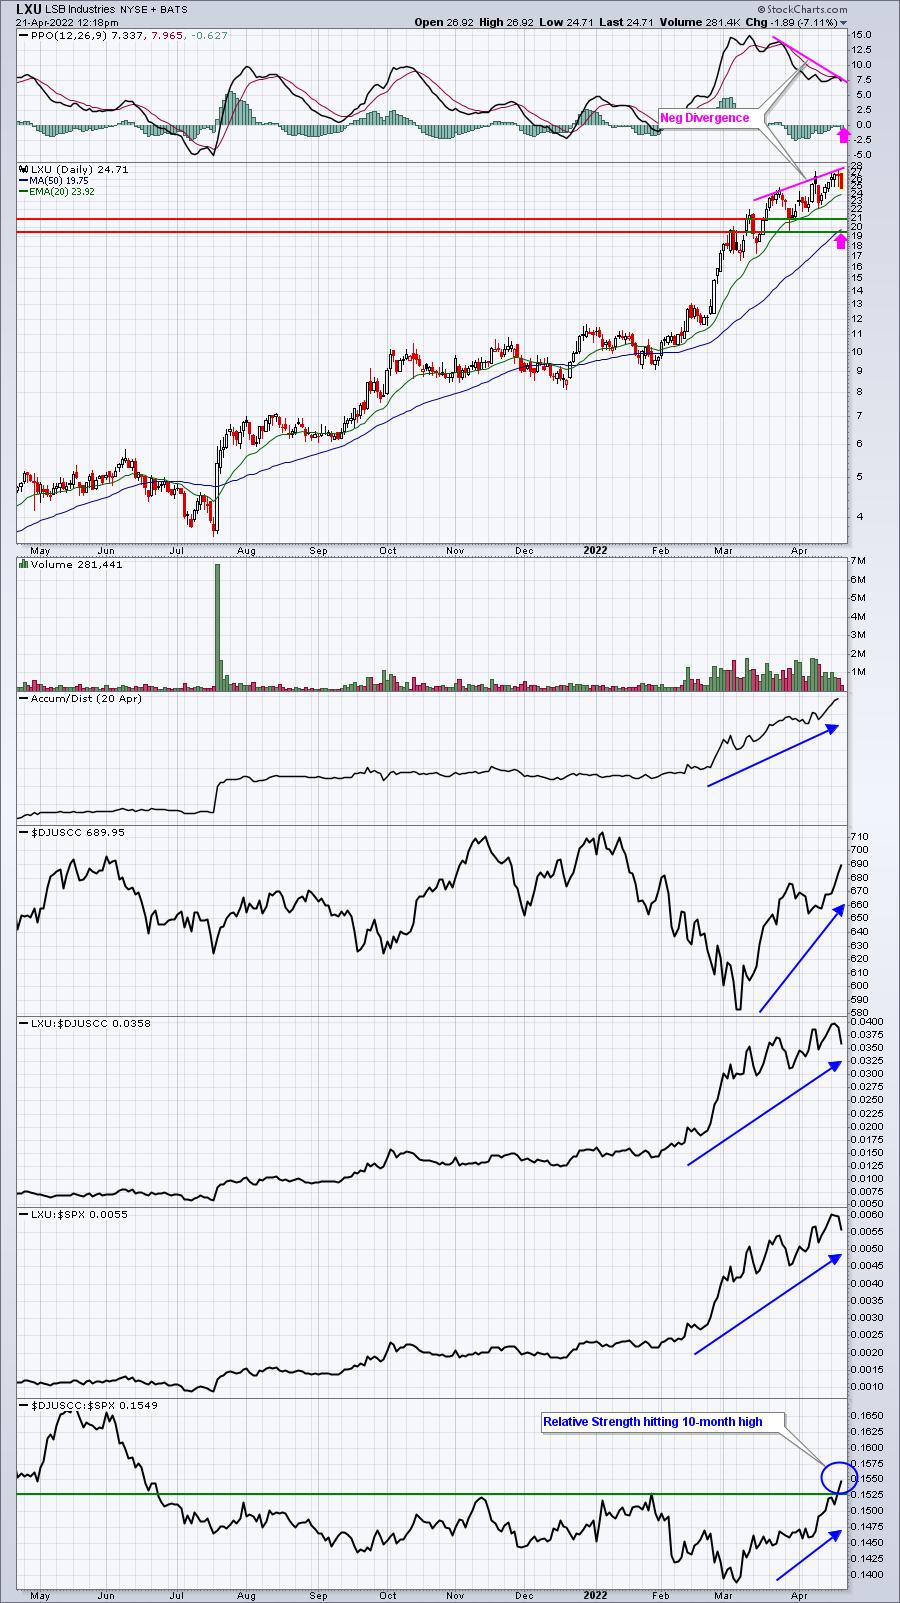
The negative divergence does give me reason for pause. If LXU closes beneath its 20-day EMA, I wouldn't be surprised if it were to quickly drop to one or both of the horizontal price support lines provided. Negative divergences can result in rapid price drops. However, I LOVE the relative breakout in chemical commodities in the bottom panel and LXU is the leader in the space. We might very well see it bounce off the 20-day EMA with the AD line so strong. The stock certainly doesn't come without a lot of risk, but it's the leader.
MOS:
MOS is very similar to LXU. It's the leader in specialty chemicals ($DJUSCX), but shows a negative divergence. Its AD line too is quite strong and the intraday selling like we've seen thus far today has recently resulted in great buying opportunities:
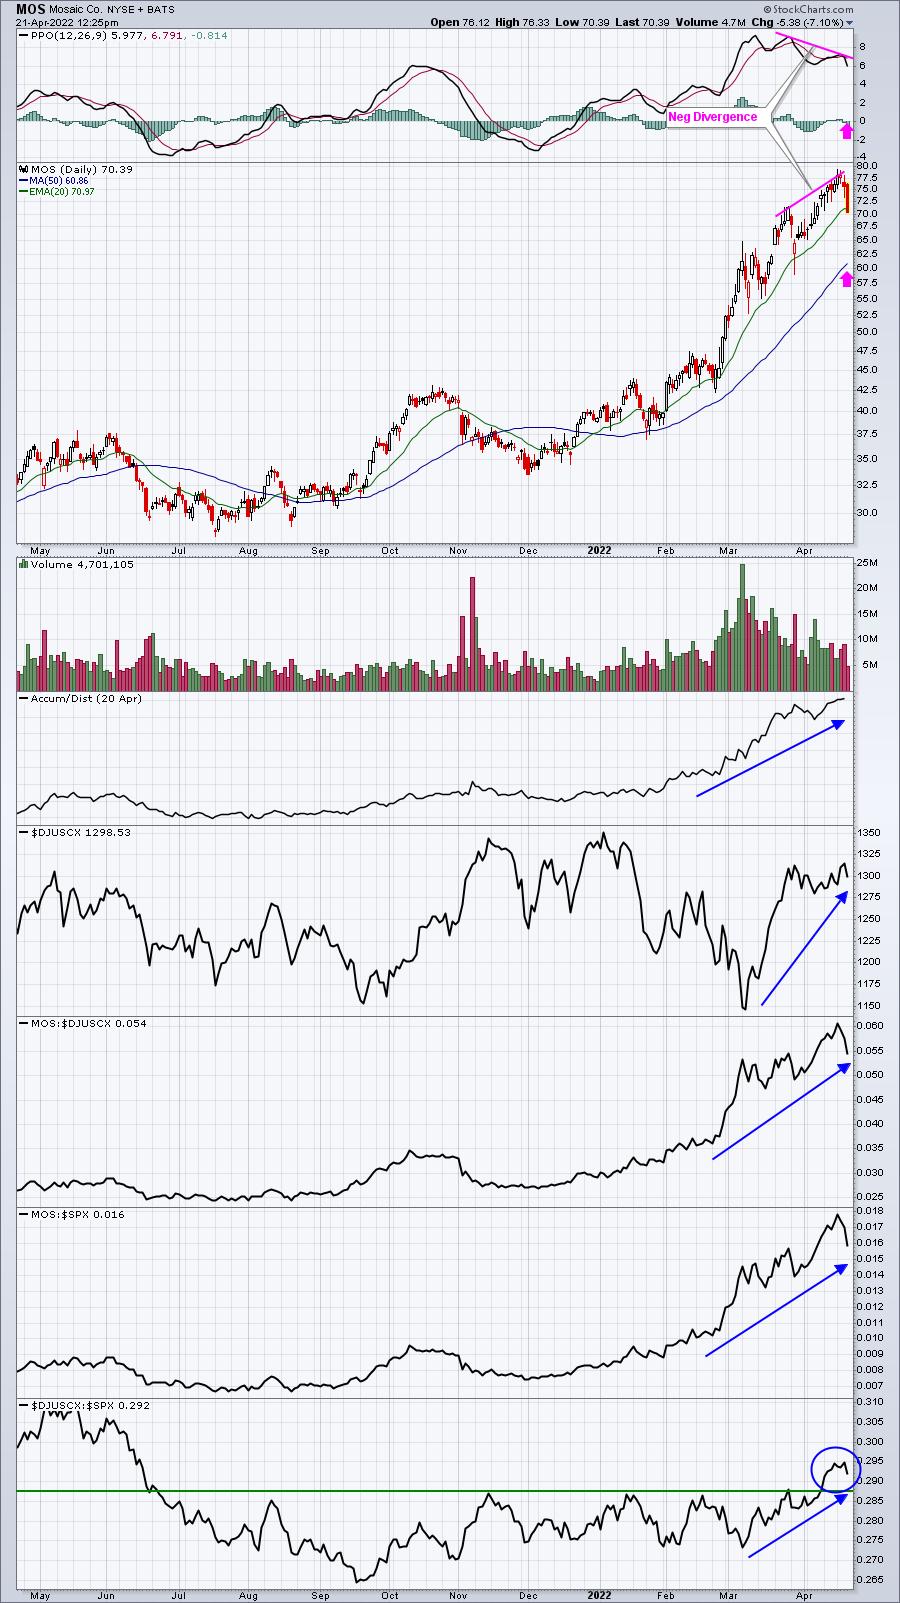
Again, the negative divergence suggests we could see a very quick selloff on MOS, but I do believe the 50-day SMA would present quite an opportunity if today's selling continues or even escalates. If MOS can recover by today's close back above the 20-day EMA, then perhaps the short-term selling can be pushed down the road.
Earnings Reports
Here are the key earnings reports for the next two days, featuring stocks with market caps of more than $10 billion. I also include a few select companies with market caps below $10 billion. Finally, any portfolio stocks that will be reporting results are highlighted in BOLD. If you decide to hold a stock into earnings, please understand the significant short-term risk that you are taking. Please be sure to check for earnings dates for any companies you own or are considering owning.
Thursday, April 21:
DHR, NEE, PM, UNP, T, ISRG, MMC, BX, FCX, ABB, SNAP, DOW, NUE, WIT, PPG, SIVB, FE, TSCO, DOV, HBAN, KEY, GPC, POOL, DGX, XM, AAL, SNA, WSO, EWBC, PNR, WAL, ALK, SNV, AN, NEP, SON, OZK, DQ, XRX, HTH, TPH
Friday, April 22:
VZ, AXP, HCA, NEM, SLB, KMB, RF, CLF, ALV, GNTX, AZZ
Economic Reports
Initial jobless claims: 184,000 (actual) vs. 175,000 (estimate)
April Philadelphia Fed Manufacturing Index: 17.6 (actual) vs. 20.5 (estimate)
March leading indicators: +0.3% (actual) vs. +0.3% (estimate)
Happy trading!
Tom