
EB Daily Market Report - Friday, April 22, 2022
Executive Market Summary
- Futures were weak overnight, looking to continue the selling that engulfed Wall Street most of Thursday
- Our major indices gapped lower and have continued trading lower throughout the session
- All 11 sectors are lower, though consumer staples (XLP, -0.64%) and real estate (XLRE, -0.90%) are showing relative strength
- Health care (XLV, -2.97%) and materials (XLB, -2.96%) are the worst-performing sectors today
- Cryptocurrencies are weak as bitcoin ($BTCUSD, -5.22%) drops more than $2000
- Treasuries are just about the only thing higher today as the 10-year treasury yield ($TNX) drops 2 basis points
- Medical equipment ($DJUSAM, -4.30%) and health care providers ($DJUSHP, -3.61%) are both weak, suffering from weakness in Intuitive Surgical (ISRG, -12.32%) and HCA Heathcare (HCA, -17.99%), respectively
- 29 of 30 Dow Jones component stocks are lowering with just Dow Holdings (DOW, +0.12%) higher
Market Outlook
As our major indices continue to push lower, I thought it might be a good time to simply review the 60-minute chart of the S&P 500 to see if a positive divergence has begun to emerge. Check this out:
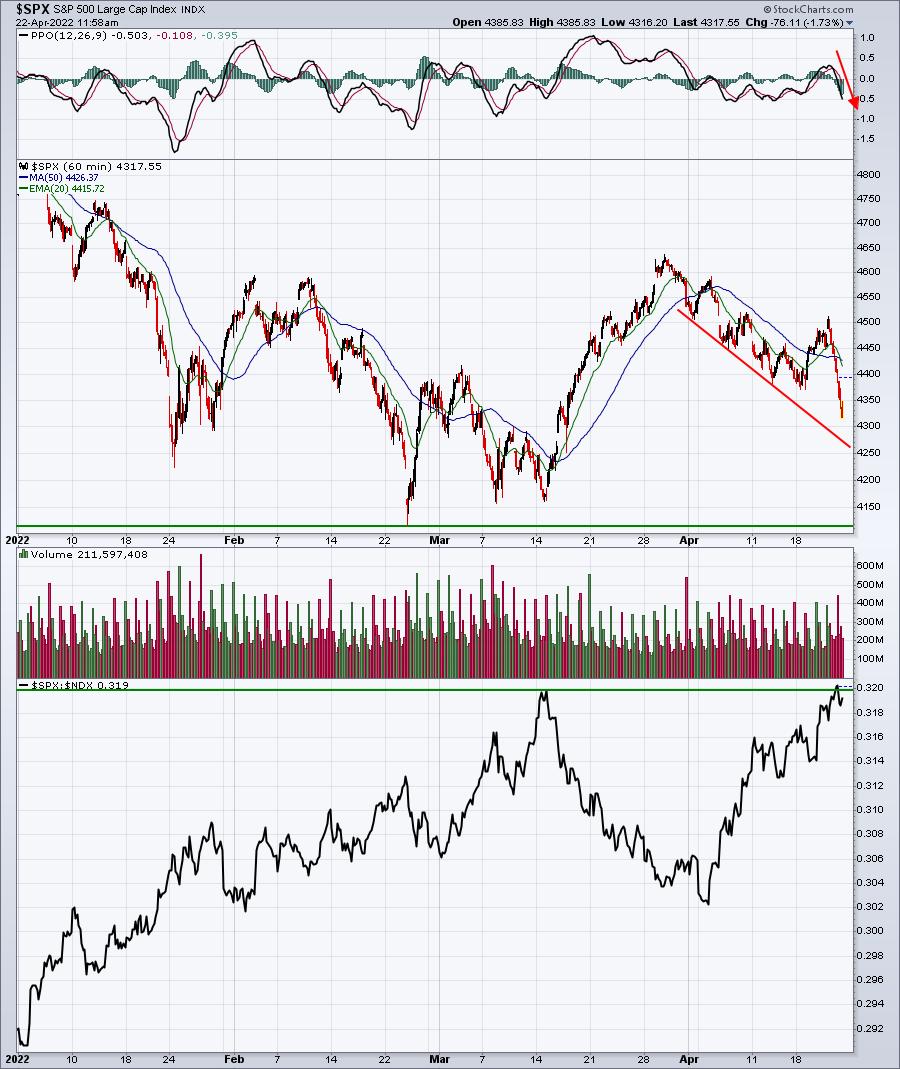
This is a year-to-date hourly chart of the S&P 500, with a panel below that shows the relative performance of the S&P 500 vs. the NASDAQ 100 ($NDX). A positive divergence (higher PPO with lower price action) could help us mark a short-term bottom, but I'm seeing nothing there yet. In fact, the PPO is pointing straight down as price continues falling. One thing that I am continually watching for is a price low that shows money rotating back towards NASDAQ stocks. This chart shows us the exact opposite action - the S&P 500 recently broke to a new relative high vs. the NASDAQ 100, which tells us that Wall Street continues rotating more towards safety and value. In my opinion, that increases the odds that we head lower.
Remain cautious.
Sector/Industry Focus
Apparel retailers ($DJUSRA) had shown enough relative strength recently that I began wondering if maybe, just maybe, the worst was behind this group. And then last night happened. Gap, Inc. (GPS) lowered its revenue guidance and the entire group has fallen in sympathy. Here's the chart of the DJUSRA, highlighting both its absolute price performance and its relative price performance:
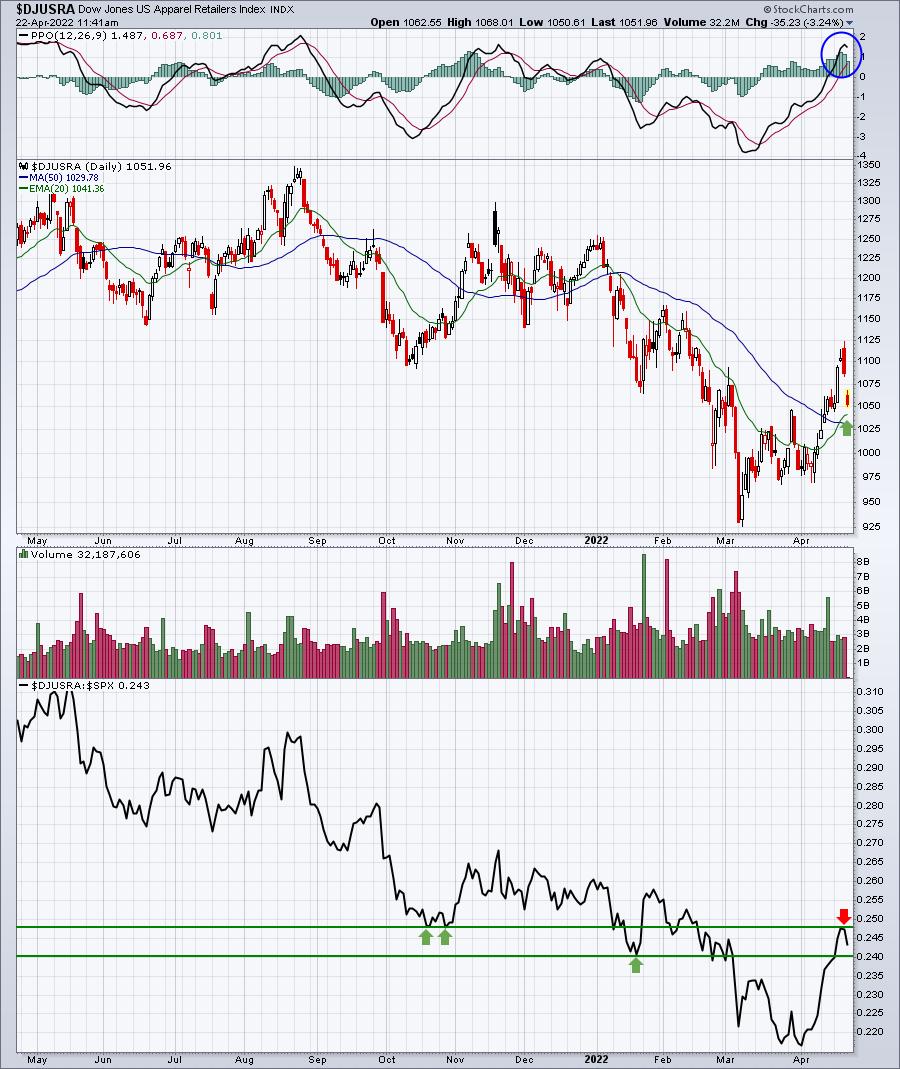
The good news is that absolute price action has yet to reach the key rising 20-day EMA. A bounce off this moving average would be bullish. Unfortunately, the relative strength has reached a key level and it appears to be rolling over. If the DJUSRA can strengthen and move back above the recent relative high, then prospects here brighten. Until then, remain cautious.
ChartLists/Strategies
Earnings are a big deal and, many times, Wall Street's reaction to those earnings help to shape a company's prospects for the next quarter. Below are two stocks that are currently breaking to new 52-week relative lows after reporting quarterly earnings and/or warning about future prospects:
ISRG:
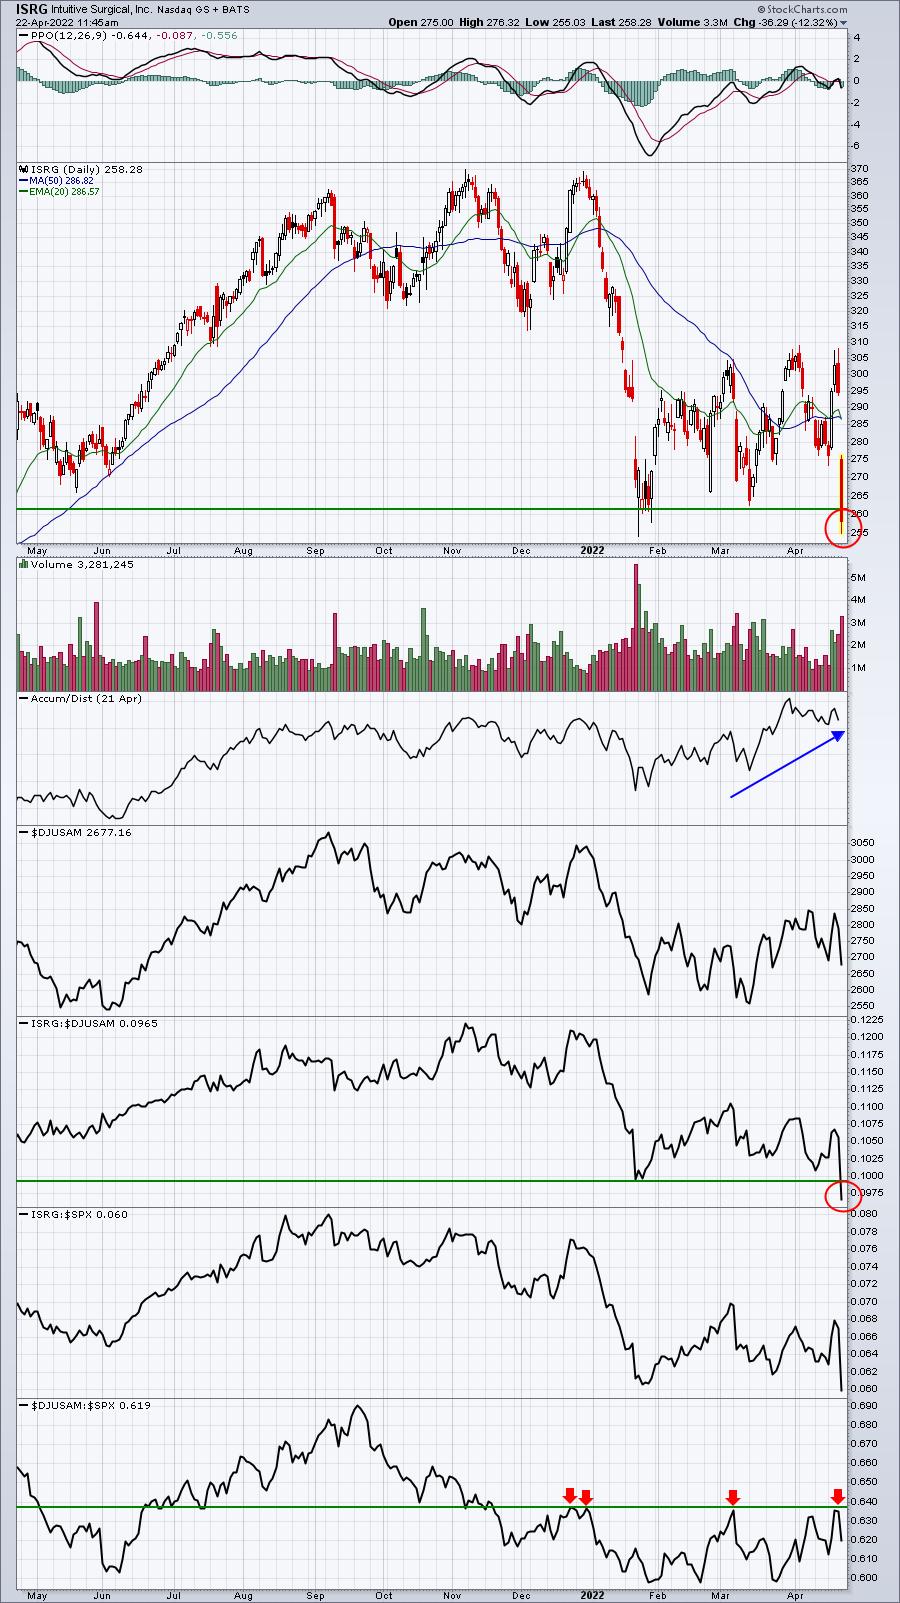
There is a disconnect at times between news and price action. After the closing bell yesterday, ISRG reported better-than-expected quarterly revenues and EPS, yet the company is being trounced. I try not to ask WHY questions and simply focus on the price performance. In this case, ISRG is threatening a breakdown in absolute price and its relative strength is breaking down vs. the medical equipment group ($DJUSAM). Finally, the DJUSAM is struggling to make a key relative breakout. If the group turns lower and ISRG is underperforming the group, well it's not rocket science. If there's a silver lining, it's that Wall Street still appears to be accumulating ISRG, despite the short-term troubles. Perhaps that's a signal that ISRG bounces back quickly after the overall market selling diminishes. Right now, however, it makes sense to be cautious.
GPS:
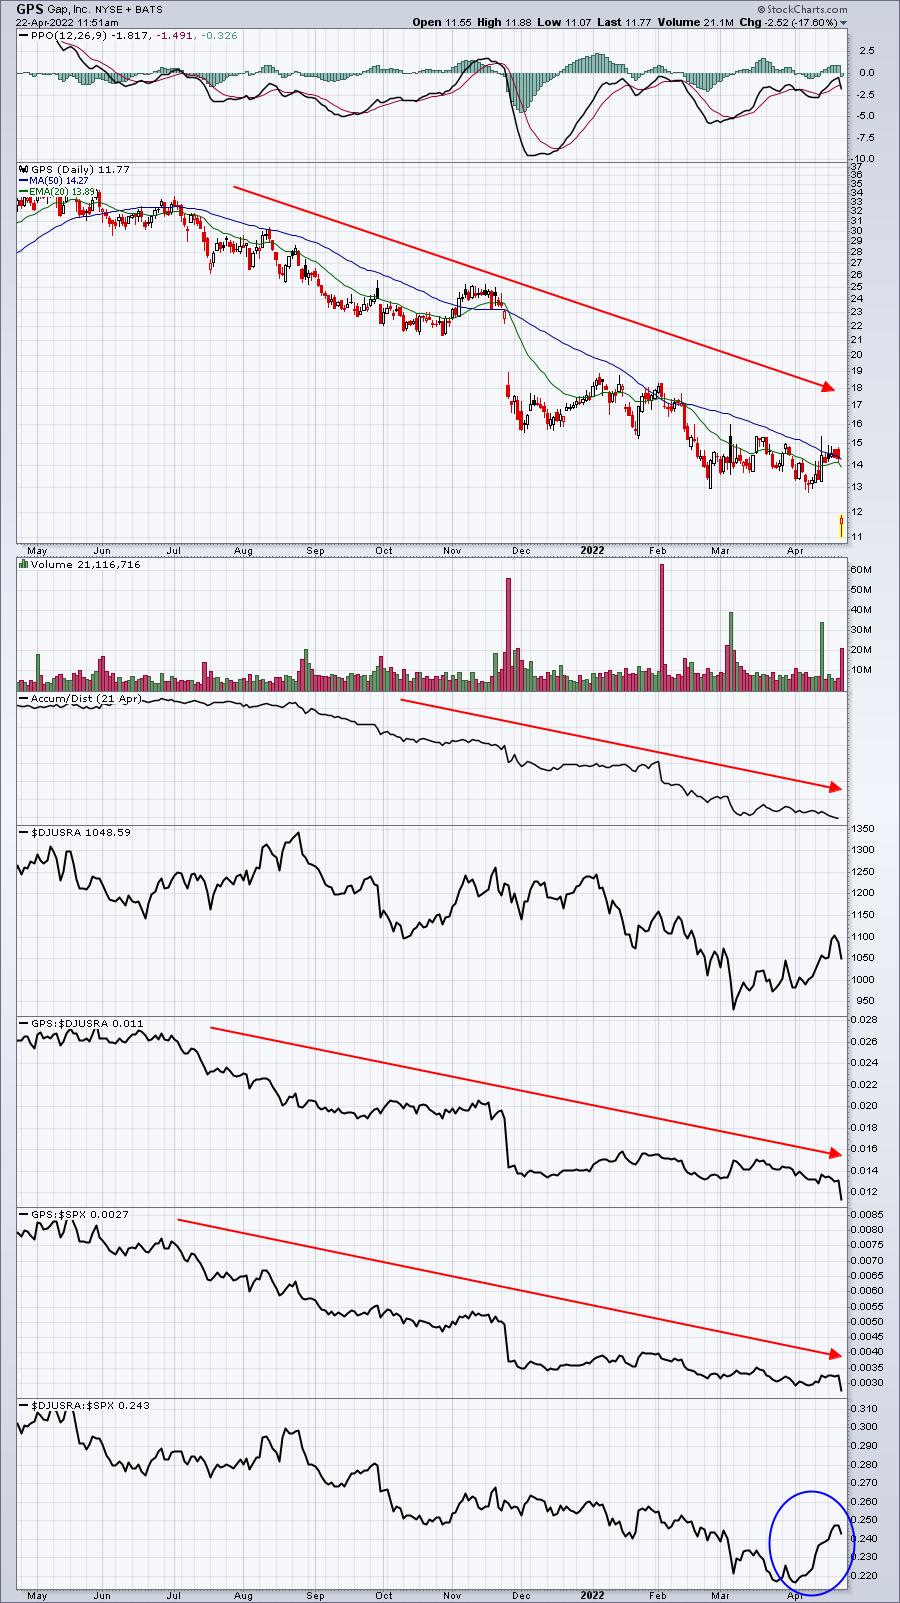
In the bottom panel above, apparel retailers ($DJUSRA) were showing relative strength throughout April, but the group appears to be rolling back over. And even while the group showed some relative strength, GPS didn't. Those red directional lines show a TON of weakness in GPS, providing little hope to a sudden surge in the stock. With last night's revenue warning, the downtrending chart now makes a lot of sense. Wall Street was expecting bad news and last night we saw it. Is this capitulatory selling to mark a major bottom? Well, we won't know until we see how it trades moving forward, but in this market environment, I have absolutely no desire to try to catch market bottoms. I'll gladly wait for GPS and others like it.
Earnings Reports
Here are the key earnings reports for the next two days, featuring stocks with market caps of more than $10 billion. I also include a few select companies with market caps below $10 billion. Finally, any portfolio stocks that will be reporting results are highlighted in BOLD. If you decide to hold a stock into earnings, please understand the significant short-term risk that you are taking. Please be sure to check for earnings dates for any companies you own or are considering owning.
Friday, April 22:
VZ, AXP, HCA, NEM, SLB, KMB, RF, CLF, ALV, GNTX, AZZ
Monday, April 25:
KO, ATVI, CDNS, SBAC, AMP, ARE, OTIS, SUI, BRO, WRB, PKG, CCK, UHS, WHR, ZION, LII, ACC, CR, AXTA, MEDP, HXL, SSD, PCH, DORM, CALX
Economic Reports
April PMI composite: 55.1 (actual) vs. 57.5 (estimate)
Happy trading!
Tom