
EB Daily Market Report - Monday, April 25, 2022
Market Timing Series
Many of you are most likely aware of key historical trends as I discuss them frequently. But I have recently written a 3-part Market Timing Series to discuss 3 key historical trends that all traders should be aware of. I want to make sure that all of our members are aware of this series as you may be interested in learning more about historical trends or you just may want a refresher. You can sign up for this series by CLICKING HERE and providing your name and email address.
Executive Market Summary
- Futures were weak overnight and our major indices gapped lower this morning
- The NASDAQ has just turned green and is showing relative strength, but we still have a lot of the trading session left
- Aggressive sectors are leading today with communication services (XLC, +0.36%) and technology (XLK, +0.34%) the only two sectors in positive territory
- Energy (XLE, -4.33%) is the primary laggard as crude oil prices ($WTIC, -5.60%) tumble nearly $6 per barrel
- Cryptocurrencies are lower, led by etherium's ($ETHUSD) 2.51% decline
- Gold ($GOLD, -2.11%) is back beneath $1900 per ounce, while copper ($COPPER, -3.37%) falls further below its 50-day SMA, which it lost on Friday
- Energy names like Schlumberger (SLB, -7.03%) and Halliburton (HAL, -6.30%) are the worst performers on the S&P 500
- Meanwhile, more aggressive names like Etsy, Inc. (ETSY, +4.71%) and Moderna (MRNA, +3.95%) are being bought
Market Outlook
Today is the FIRST potential signal of money rotating back in bullish fashion. And I'm only talking about the first hour of trading today, so it's nothing to get overly excited about. However, we are seeing a possible "swoosh" to the downside in the S&P 500 with Volatility on the rise....and money is rotating back into the 3 aggressive sectors. Hhhhmmmm. Check this out:
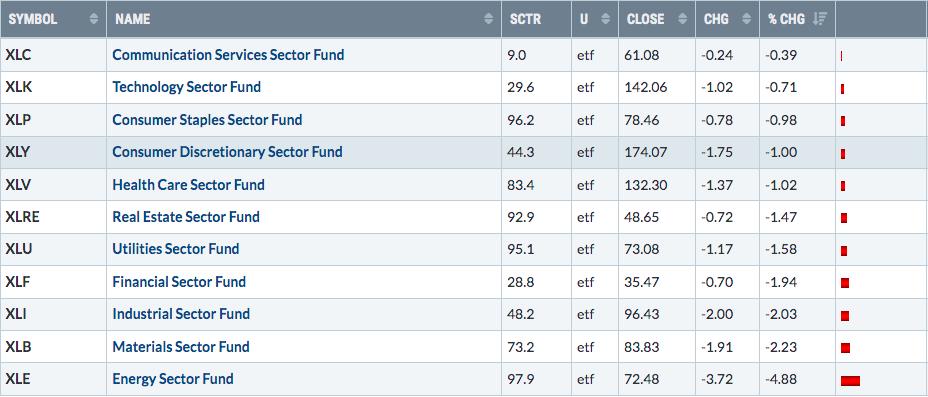
The "on the surface" look today is one of more fear and lower prices. But the "under the surface" signal is more bullish and it's at least a start to a potential tradable bottom.
In my "perfect world", I'd like to see the S&P 500 ultimately break beneath 4000 and most everything move lower with it, but with a subtle little twist. I want to see the relative strength of the XLK, XLY, and XLC begin to turn higher. Let's see how this develops during a VERY important earnings week. Apple (AAPL), Microsoft (MSFT), Alphabet (GOOGL), Meta Platforms (FB), and Amazon.com (AMZN) all report their quarterly results this week. Their market reactions will go a LONG way toward determining whether the February price support on our major indices holds.
Sector/Industry Focus
The Volatility Index ($VIX) has once again become very problematic. When fear escalates and we see the VIX move into the 30s, literally ANYTHING can happen. My biggest fear becomes irrational, impulsive selling, which makes holding stocks on the long side very difficult - for a trader. Let me again say that, from a long-term buy-and-hold perspective, I believe equities will be much higher a year from now. Therefore, in my opinion, those with a long-term mindset that do not want to trade should simply stay the course and just realize things could be painful short-term. 3500-3800 is quite possible on the S&P 500 under very bearish conditions, especially when there is impulsive selling. Check out the S&P 500 with the VIX beneath it:
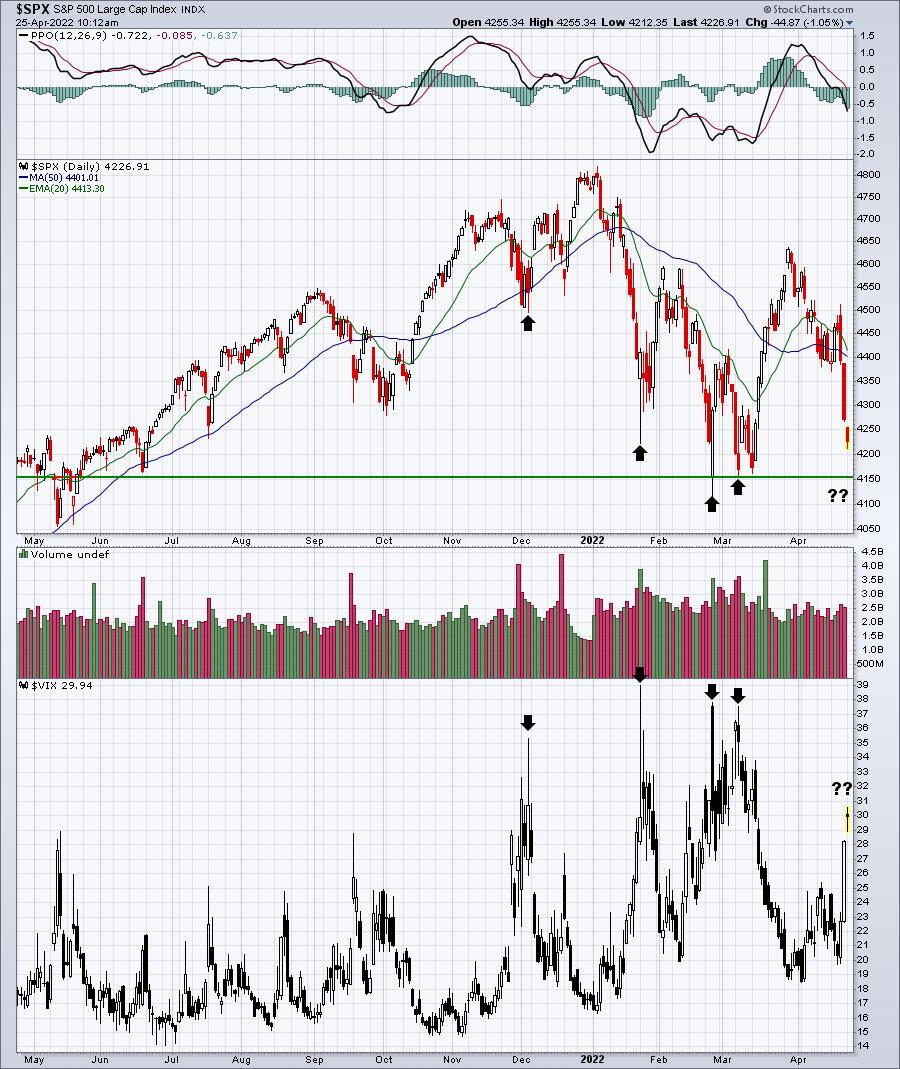
When the VIX gets this high, you need to expect significant whipsaw action. It'll look like a major recovery is underway sometimes, then the next shoe drops. Then just when you think we'll never see another bid in the market, a huge rebound occurs. If you can time these volatile periods and reversals, you'll make a mint. If you can't, well....
ChartLists/Strategies
Given the VIX move into the 30s, I believe trading risks have increased immensely. I prefer sitting in cash during such periods. Yes, the opportunities for higher profits increase, but so do the risks. And managing risk is one of the most important aspects of trading.
I'm sitting this out right now.
Earnings Reports
Here are the key earnings reports for the next two days, featuring stocks with market caps of more than $10 billion. I also include a few select companies with market caps below $10 billion. Finally, any portfolio stocks that will be reporting results are highlighted in BOLD. If you decide to hold a stock into earnings, please understand the significant short-term risk that you are taking. Please be sure to check for earnings dates for any companies you own or are considering owning.
Monday, April 25:
KO, ATVI, CDNS, SBAC, AMP, ARE, OTIS, SUI, BRO, WRB, PKG, CCK, UHS, WHR, ZION, LII, ACC, CR, AXTA, MEDP, HXL, SSD, PCH, DORM, CALX
Tuesday, April 26:
MSFT, GOOGL, V, PEP, NVS, UPS, TXN, RTX, GE, MDLZ, CB, CNI, MMM, EW, WM, SHW, UBS, AMC, COF, ADM, ECL, CNC, ROP, VLO, CMG, MSCI, EQR, PCAR, GLW, DHI, CSGP, ESS, NTRS, TECK, ENPH, MKL, UDR, AGR, TER, TRU, ENTG, IEX, AVY, RHI, FFIV, JNPR, ARCC, WBD, EXAS, HUBB, IVZ, TX, MANH, RRC, WH, ST, CHE, BYD, QS, GPK, MKSI, MTDR, TENB, SKX, PII, BPOP, TNET, JBLU, NSP, SSTK, NAVI, TRMK, EDU, USNA
Economic Reports
None
Happy trading!
Tom