
EB Daily Market Report - Friday, April 29, 2022
ChartLists Updated:
I have been able to update several ChartLists over the past day or so. The Strong Earnings ChartList (SECL) has been updated through Monday's earnings reports. Here's a complete list of the recently updated ChartLists:
- Strong Earnings ChartList (SECL)
- Strong Future Earnings ChartList (SFECL)
- Raised Guidance ChartList (RGCL)
- Bullish Trifecta ChartList (BTCL)
- Short Squeeze ChartList (SSCL)
The SSCL has bene updated on our website, while the others should be updated later today (or over the weekend, at the very latest).
Executive Market Summary
- Futures were significantly lower, particularly on the NASDAQ, after two NASDAQ behemoths reported quarterly results that didn't exactly impress Wall Street
- Apple (AAPL, -2.51%) had an exceptional quarter, raised its dividend by a penny, and authorized additional buybacks, but it suspended revenue guidance, indicating that the Russia-Ukraine war would have a bigger impact in Q2
- Amazon.com (AMZN, -15.28%) was very disappointing, missing estimates and lowering guidance
- AMZN's results and price drop are heavily influencing the consumer discretionary sector (XLY, -4.71%), which is today's worst
- Real estate (XLRE, -4.00%) and technology (XLK, -3.26%) are also suffering through rough sessions
- All 11 sectors are lower today, though materials (XLB, -1.36%) is the best relative performer
- Crude oil ($WTIC, -0.90%) is down, but natural gas ($NATGAS, +5.40%) is surging; gold ($GOLD, +0.91%) is climbing as volatility ($VIX, +9.17%) rises
- AMZN is today's worst S&P 500 performer, followed closely by Verisign (VRSN, -13.68%), which also fell short of EPS estimates
Market Outlook
With a little more than 30 minutes left in the trading day and week, it appears as if the S&P 500 might close at its lowest level of 2022 and its lowest level since May 2021. The 2022 low close is 4170.70 on March 8th. We're just beneath that level now:
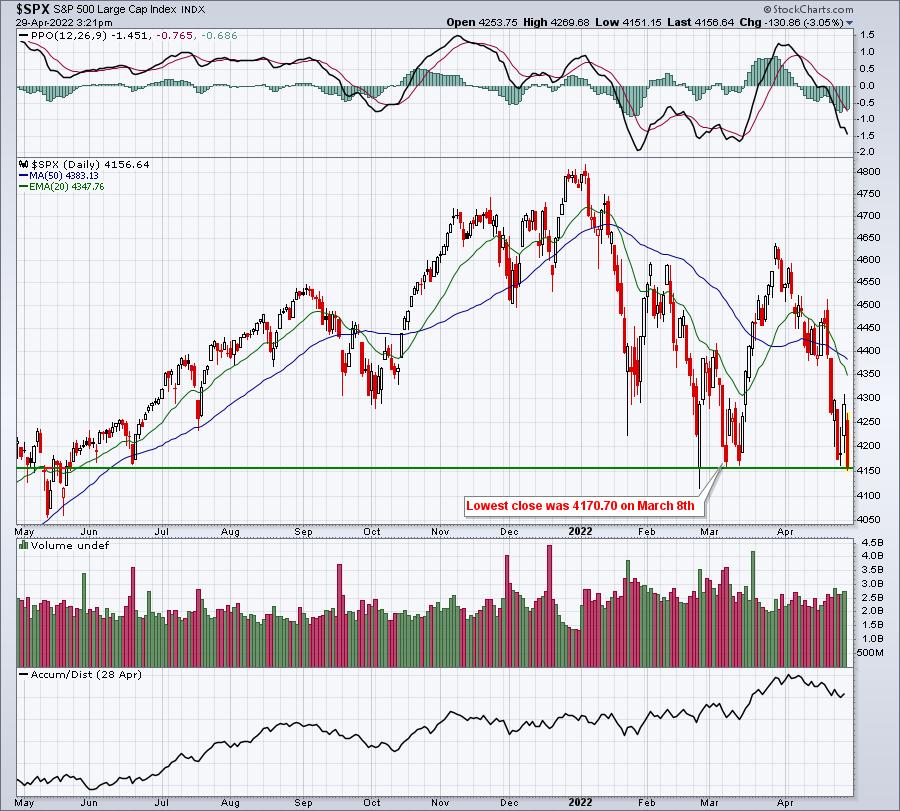
The warning signs that I've been discussing have kept me from chasing any of these short-term rallies, including yesterday's. It's very unusual to see the S&P 500 close out a month on such a sour note as we typically finish calendar months strong, leading to more strength as we open the next month. But technical conditions ALWAYS trump historical tendencies and it's very difficult to put any kind of positive spin on the current action.
Remain very cautious and remember that some of the biggest drops can occur on breakdowns with high VIX readings. Another 5% to 10% selloff can occur in just a few days. The good news is that every 1% decline gets us closer and closer to a market bottom.
Sector/Industry Focus
Broadline retail ($DJUSRB) is taking a BIG hit on the heels of AMZN's dismal quarterly earnings report. The group is breaking down to another fresh 52-week low and there aren't any technical signals suggesting that the bottom is in:
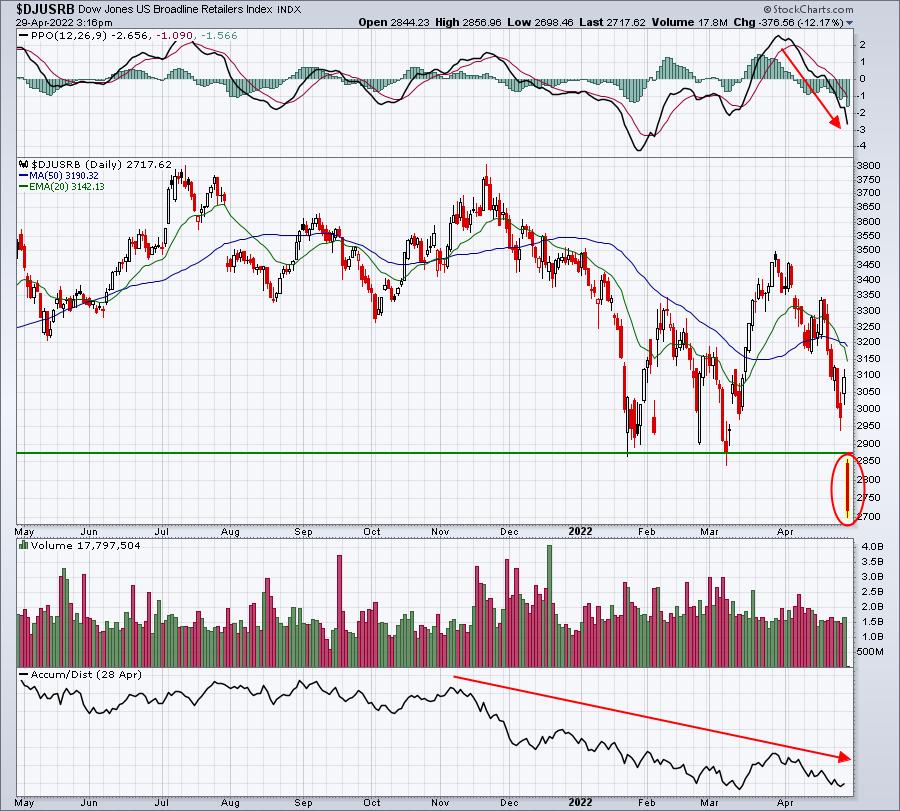
Momentum is accelerating to the downside, the AD line is quite likely to be at a new low at the close, and today's action has all taken place beneath prior lows. If you needed an image to describe "ugly chart", this one might be perfect.
ChartLists/Strategies
If you had told me that our major indices would explode higher after Meta Platforms (FB) and PayPal Holdings (PYPL) reported quarterly results and then would give it all back after Apple (AAPL) and Amazon.com (AMZN) reported, I'd have thought NO WAY. But that's how crazy the market is right now and illustrates the extreme volatility that accompanies VIX readings in the low 30s.
Here are a couple companies that recently reported results where their charts interest me:
GD:
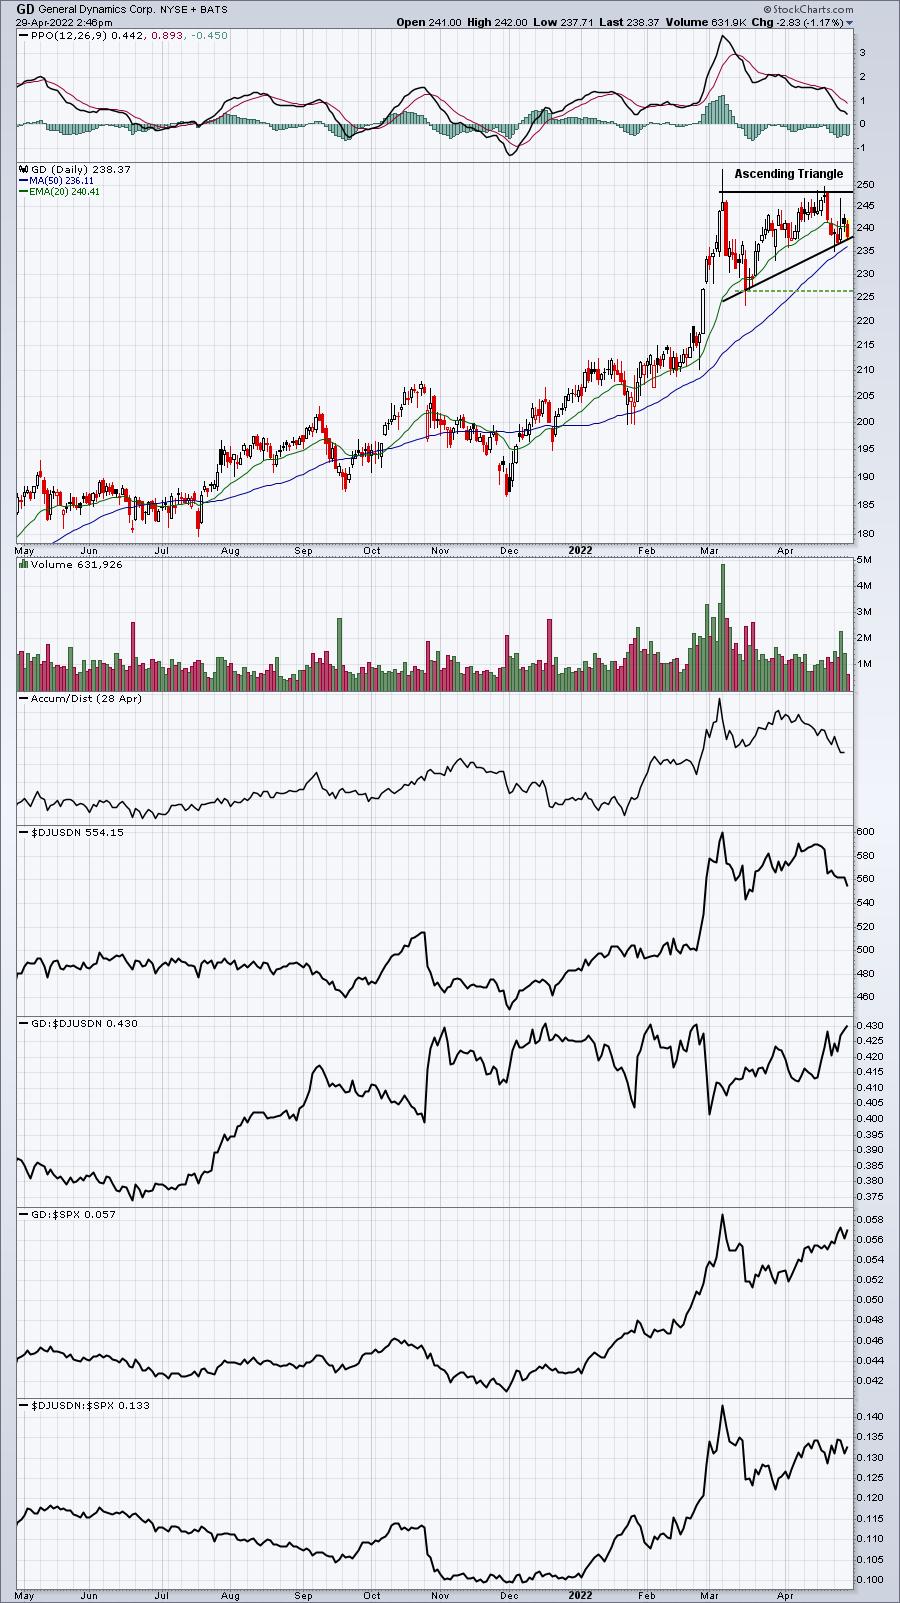
Defense stocks are trending higher vs. the S&P 500 and GD is on the verge of breaking out relative to the group. It's also in a very bullish ascending triangle pattern. If it breaks out, it would initially measure to roughly 270, which would be a nice 13% - especially in this market.
CDNS:
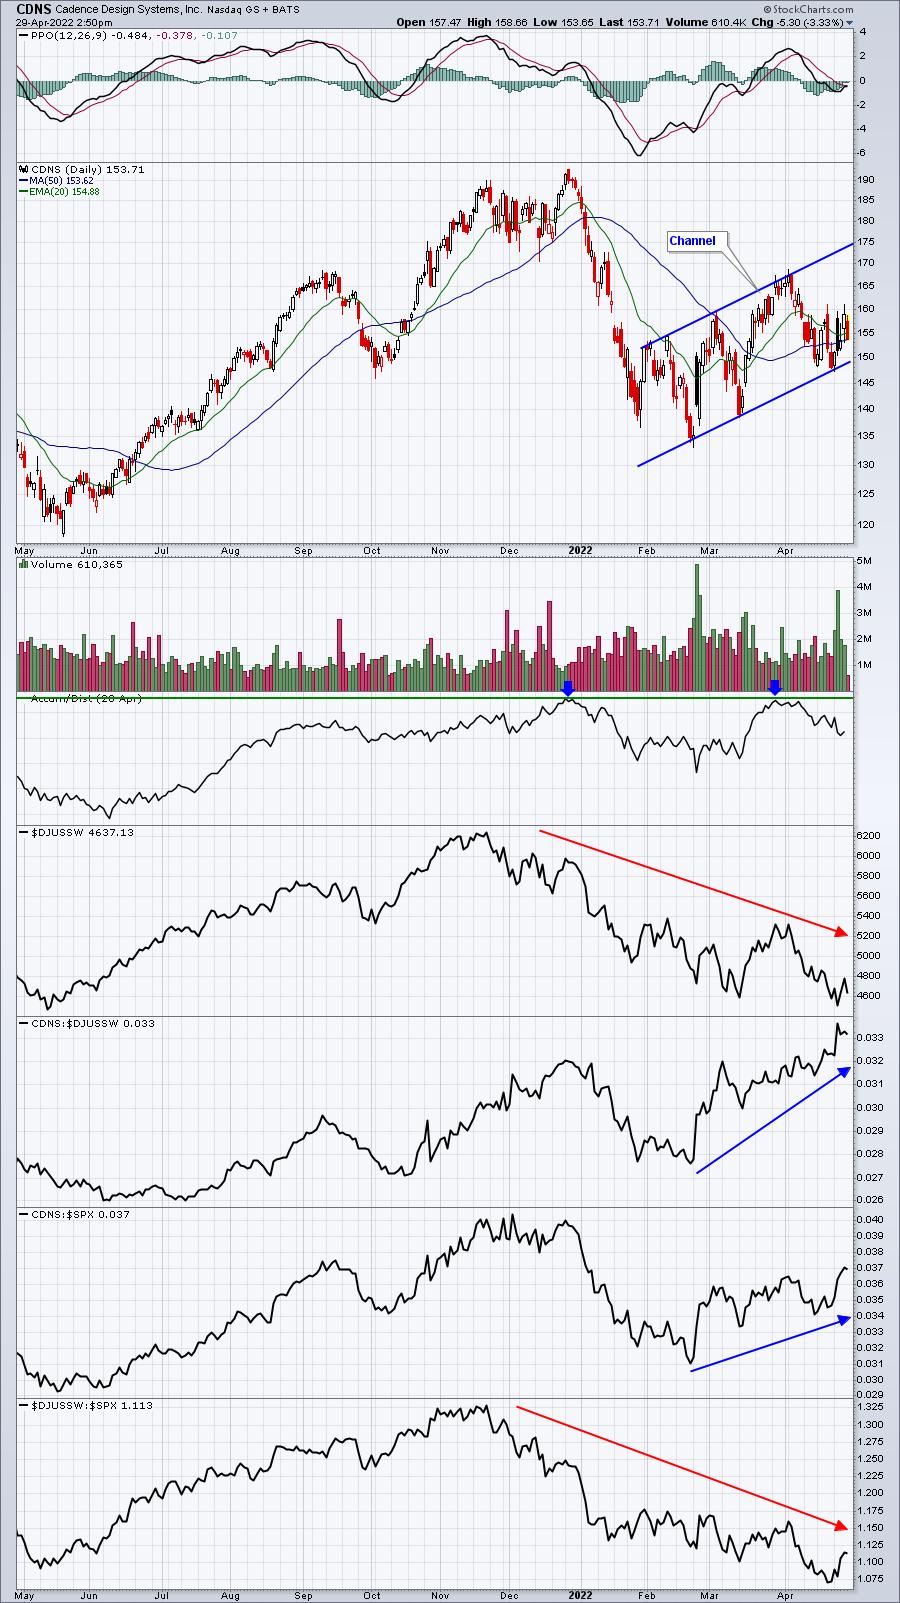
When a group has been as bad as the software group ($DJUSSW) has been, relative leadership really stands out. CDNS is showing excellent relative strength vs. the DJUSSW, even trending higher in a channel while the group sets new lows. Also, note that the AD line tried breaking to a new high recently, indicative of accumulation. Finally, the February to April trend higher has been accompanied by heavier volume. CDNS certainly appears to be worthy of being on a Watch List, even if it's still a bit risky to own it.
Earnings Reports
Here are the key earnings reports for the next two days, featuring stocks with market caps of more than $10 billion. I also include a few select companies with market caps below $10 billion. Finally, any portfolio stocks that will be reporting results are highlighted in BOLD. If you decide to hold a stock into earnings, please understand the significant short-term risk that you are taking. Please be sure to check for earnings dates for any companies you own or are considering owning.
Friday, April 29:
XOM, CVX, ABBV, NVO, AZN, BMY, HON, CHTR, AON, CL, TRP, E, PSX, LYB, BBVA, IMO, WY, NWG, MGA, WPC, CBOE, NWL, SYNH, NVT, GTLS, LNTH, AB, CRI, BLMN, TAL, B, SLCA
Monday, May 2:
MCO, EPD, NTR, NXPI, WMB, GPN, DVN, ANET, WEC, EXPE, FMX, MOS, CTRA, FANG, ON, ZI, BXP, MPWR, CLX, MGM, FMC, CAR, SEDG, CNA, AIRC, VNO, OHI, AGNC, SAIA, AMG, LEG, VRNS, AMKR, FRPT, OUT, CBT, FN, CHGG, QTWO, CNO, RMBS, RIG, SANM, KMT, ITRI, FSS, MWA, KFRC, BIGC, IPI, CDLX
Economic Reports
March personal income: +0.5% (actual) vs. +0.4% (estimate)
March personal spending: +1.1% (actual) vs. +0.6% (estimate)
April Chicago PMI: 56.4 (actual) vs. 61.3 (estimate)
April consumer sentiment: 65.2 (actual) vs. 65.6 (estimate)
Happy trading!
Tom