
EB Daily Market Report - Tuesday, May 3, 2022
Executive Market Summary
- Futures were relatively flat for the second straight day
- U.S. equities have been fairly calm as traders await the latest from the Federal Reserve on Wednesday; it's widely anticipated that they'll raise the fed funds rate by 50 bps
- The 10-year treasury yield ($TNX) is down 4 basis points to 2.96% as oversold bonds rally a bit
- Natural gas ($NATGAS, +4.88%) continues to surge; meanwhile, most other commodities are closer to the flat line
- Crude oil prices ($WTIC, -2.11%) are having little negative impact on the energy sector (XLE, +2.95%), which is today's best-performing sector
- Consumer stocks are weak as both consumer staples (XLP, -0.44%) and consumer discretionary (XLY, -0.34%) lag
- Rockwell Automation (ROK, -13.91%) and Expedia (EXPE,-13.59%) are the worst two performers on the S&P 500 after releasing quarterly results that did not impress Wall Street
Market Outlook
Sector relative strength plays a key role in forecasting stock market action. Nothing is perfect, but I use sector strength as a signal of sustainability or possibly a reversal. Remember that it was the strength of defensive sectors in December that helped mark a key market top. Therefore, as I've discussed many times, I'm looking for relative strength in aggressive sectors to perhaps help us identify a key market bottom. Here are how the aggressive sectors look right now, relative to the benchmark S&P 500:
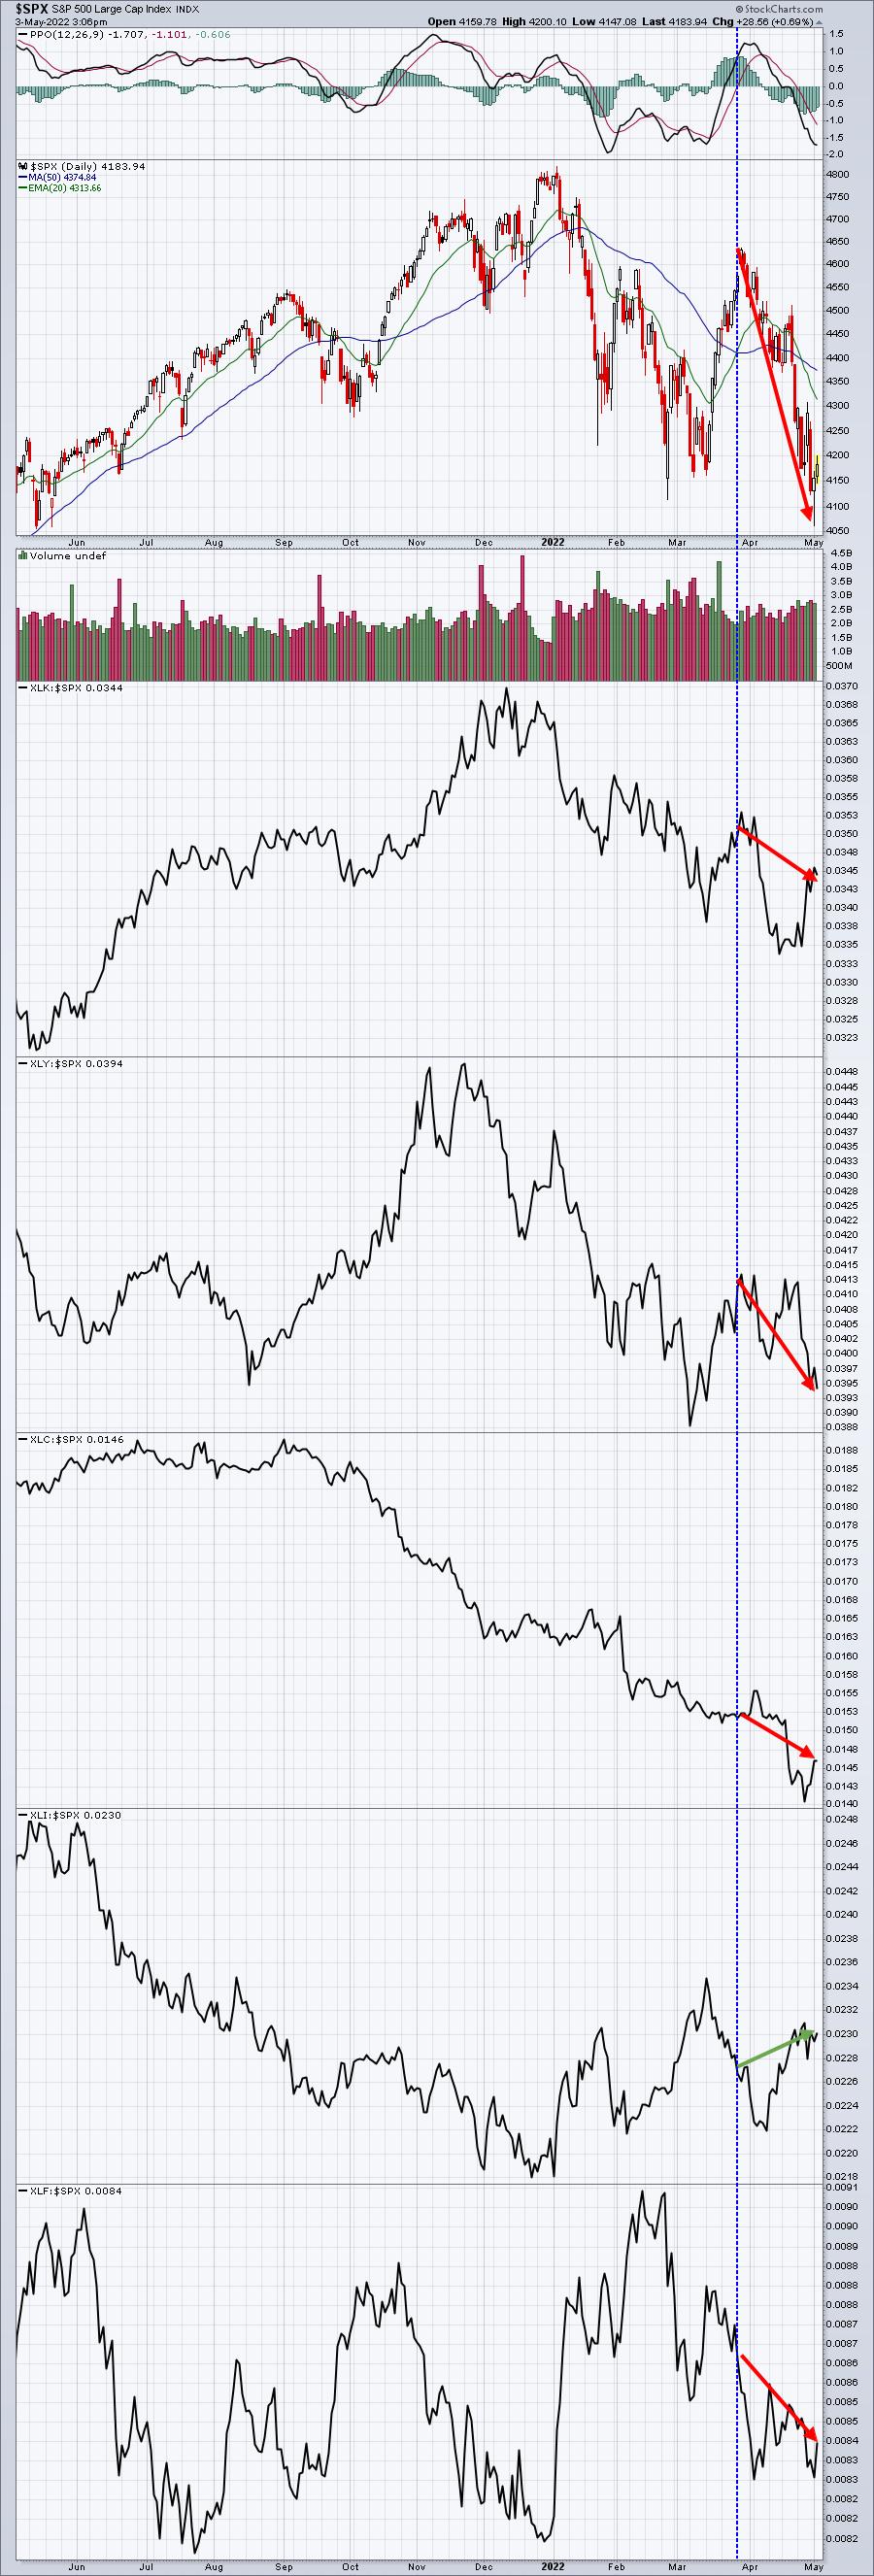
Yesterday, I discussed the recent relative strength from the XLK, which could be seen a short-term positive for the market right now. But if we look at the entirety of this latest S&P 500 downtrend, only 1 of 5 aggressive sectors have improved on a relative basis and that's the industrials (XLI). The other 4 have all moved lower over these past 5 weeks. This remains a problem and one reason why I'm skeptical of the current rally attempt.
Sector/Industry Focus
Let's compare Monday's market reversal to other recent reversals. For this purpose, I'm using the NASDAQ Composite chart. Check this out:
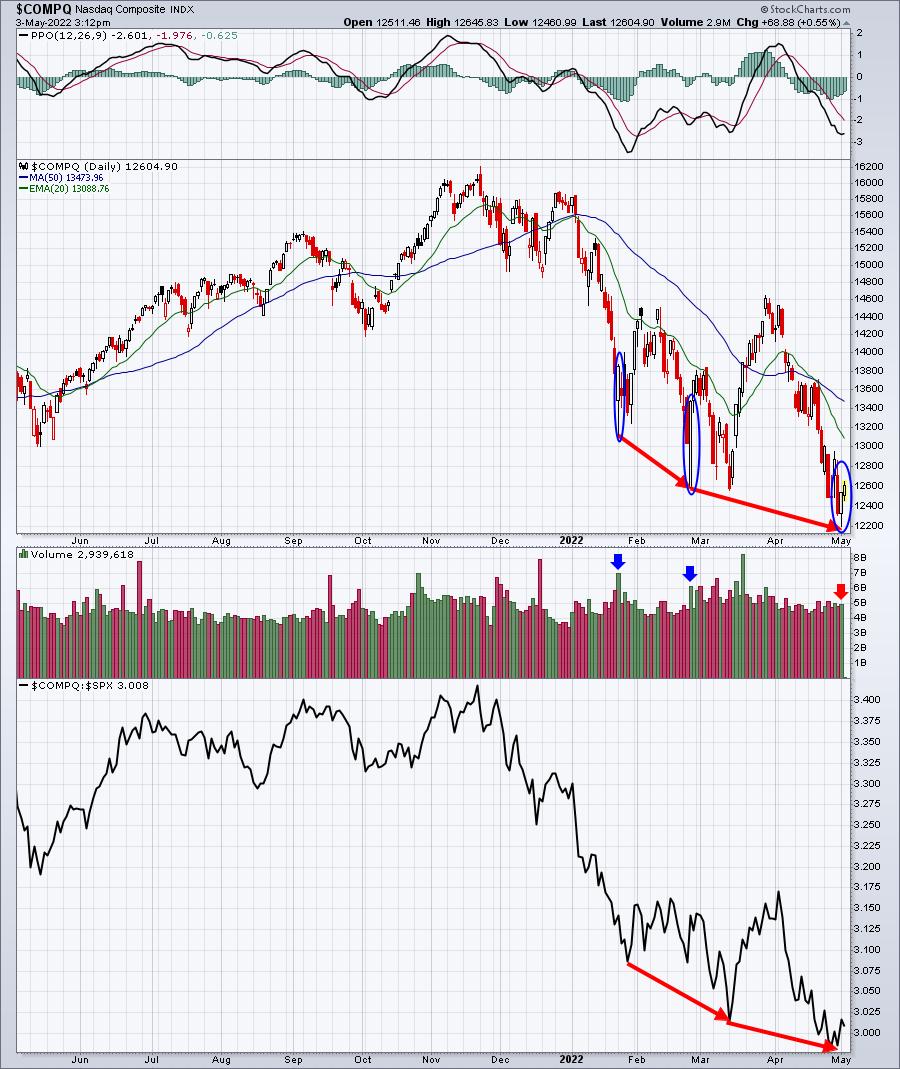
I have a couple issues with this chart as well. First, note that the more aggressive NASDAQ continues to set new relative lows vs. the S&P 500. I'd really like to see a relative "positive divergence" emerge, where the S&P 500 sets a new low, while this NASDAQ vs. S&P 500 ratio doesn't. That's not the case right now.
Second, note that on the two previous breakdowns and reversals, the volume that accompanied the reversing candle was much MUCH heavier than the volume on the selling. But check out Monday's reversal. Its volume was roughly the same, so there doesn't appear to be nearly the conviction on this potential reversal. This, combined with the Fed announcement tomorrow and two key jobs reports - the ADP employment report Wednesday morning and the nonfarm payrolls report Friday morning - leaves me suspicious of this rally attempt. I need to see more. Therefore, I plan to roll into the latter part of this week primarily in cash.
ChartLists/Strategies
Well, the possible DDOG trade from yesterday afternoon was solid for about 30 minutes this morning and then it fell apart. It reports earnings on Thursday morning, so the volatility here could be insane. While technology is going along for the ride to the upside today, one of its key component industry groups - software ($DJUSSW, -0.79%) - is not. That's likely adding to the DDOG woes today.
I believe we have another leg lower, so I'd be sure to keep stops in place on any trades. Hundreds and hundreds of companies will be reporting earnings throughout the week, with Advanced Micro Devices (AMD) and Starbucks (SBUX) - visible, poorly performing companies in the technology and consumer discretionary space - set to report their results after today's close.
Earnings Reports
Here are the key earnings reports for the next two days, featuring stocks with market caps of more than $10 billion. I also include a few select companies with market caps below $10 billion. Finally, any portfolio stocks that will be reporting results are highlighted in BOLD. If you decide to hold a stock into earnings, please understand the significant short-term risk that you are taking. Please be sure to check for earnings dates for any companies you own or are considering owning.
Tuesday, May 3:
PFE, AMD, ABNB, EL, BP, SPGI, SBUX, PSA, FIS, ITW, ETN, MPC, TRI, AIG, HLT, PRU, WCN, PEG, DD, VRSK, MPLX, BIIB, KKR, ROK, OKE, AME, EXR, CMI, EIX, ZBH, IT, MTCH, MLM, CMS, ZBRA, CNP, CNHI, SWKS, PARA, AKAM, WAT, PKI, PEAK, AMCR, J, QSR, PAYC, BR, YUMC, EXPD, INCY, WLK, CTLT, HWM, CZR, LDOS, JKHY, XP, BEN, REG, TAP, LYFT, HSIC, SCI, AIZ, TEVA, SEE, AGCO, NNN, LEA, STAG, LSCC, VOYA, MASI, ITT, MUSA, INSP, LPX, LFUS, SMG, WK, AQUA, IPGP, RRR, SGRY, OSH, AYX, MSTR, CRUS, ONTO, SABR, LTHM, SPT, REZI, VIAV, HLF, CVLT, OMI, VSH, ARNC, WERN, ATRC, XHR, LGIH, CWH, KAR, FLGT, INFN, VCYT, IAG, ENVA, NVTA, ATEN
Wednesday, May 4:
CVS, BKNG, REGN, UBER, MAR, PXD, MET, MRNA, EMR, FTNT, CTSH, JCI, CTVA, O, GOLD, RACE, IDXX, ET, ALL, LNG, YUM, TT, ABC, ES, EBAY, FNV, ANSS, FTS, VMC, HZNP, ALB, VICI, CDW, TWLO, CF, CLR, BIP, IR, MRO, ATO, TECH, HST, XYL, APA, GNRC, GDDY, QRVO, CRL, ETSY, NI, AFG, WOLF, LSI, OTEX, TPL, CHK, LUMN, LNC, GFL, JAZZ, BWA, NBIX, BRKR, RGLD, CDAY,PNW, UTHR, STOR, FLEX, GIL, SRPT, TNDM, MUR, LITE, CLH, RPD, TXG, QLYS, SPR, QDEL, SUN, DOCN, RUN, LIVN, TRIP, SITM, DIOD, TWNK, REGI, FSR, KLIC, WING, STAA, NUVA, SIMO, SAVE, EVH, NGVT, GKOS, NUS, OTLY, EXPI, FSLY, ACLS, VMEO, EAT, MARA, LGND, CRTO, AVID, AVNS, PLMR, IRBT, VCEL, MGNI, SILK, TGLS
Economic Reports
March factory orders: +2.2% (actual) vs. +1.1% (estimate)
Happy trading!
Tom