
EB Daily Market Report - Wednesday, May 4, 2022
Executive Market Summary
- Futures were relatively flat for a third consecutive day
- Value (IWD, +0.35%) showed significant leadership early, but growth stocks (IWF, -0.33%) have been closing the gap
- The Federal Reserve will conclude its latest meeting with its policy statement at 2pm ET; consensus is that they'll raise the fed funds rate by 50 basis points
- Earnings are again causing wide swings in prices; Akamai (AKAM, -11.06%) missed its earnings estimate and is being punished, while Generac (GNRC, +9.70%) leads the S&P 500 after beating its consensus estimate
- Cryptocurrencies are mostly higher ahead of the Fed, with bitcoin ($BTCUSD) up nearly 4% and back above 39000
- Crude oil ($WTIC, +4.00%) is jumping over $4 per barrel, lifting energy (XLE, +1.17%)
- Natural gas ($NATGAS, +5.48%) is surging once again, attempting to close above 8 for the first time since 2008
- The 10-year treasury yield ($TNX) is up 3 basis points to 2.99% as bond traders sell treasuries ahead of the Fed
- Real estate (XLRE, -1.18%) is today's worst performing group, while consumer strength is definitely in staples (XLP, +0.92%) vs. discretionary (XLY, -0.82%)
- Travel & tourism ($DJUSTT, -4.60%) and gambling ($DJUSCA, -4.25%) are putting pressure on the XLY
Market Outlook
It's Fed day. There are 8 of these each year. As a reminder, here are the Fed meeting dates for the balance of 2022:
- June 14-15
- July 26-27
- September 20-21
- November 1-2
- December 13-14
The Fed has essentially pledged to raise rates at each of these meetings. I do not believe they will. If the economy weakens, which the negative Q1 GDP would already suggest is happening, and core CPI falls over the next 3 months - as I believe it will - I look for the Fed to back off of further tightening after this month's hike (and maybe next month's). The April 2022 CPI data will be reported next Wednesday, May 11th. The May 2022 CPI data will be reported on Friday, June 10th. So we will see the next TWO CPI reports before the next Fed decision. I believe both of these CPI reports will show the annual rate of core inflation dropping, which will be very good news for U.S. equities. The timing of a market bottom may very well be determined by the Fed action. If the Fed backs off its pace of rate hikes in June (maybe a quarter point hike instead of the likely half point hike), or if it keeps rates unchanged in June, then I believe a market bottom will be in. If, however, the Fed sticks to its hawkish plan in the face of slowing inflation, then U.S. equities will likely suffer, pushing a bottom out another 1-3 months.
This is simply how I see things playing out. We'll take it day-to-day.
Sector/Industry Focus
Renewable energy ($DWCREE) has rallied the past three days, enabling technology (XLK) to perform well on a relative basis. But the group is hitting its 20-day EMA today and could be in the process of forming a bear flag. I'd need to see the industry clear not only its 20-day EMA to grow more bullish, but I also want to see it clear short-term trendline resistance. Here's the visual:
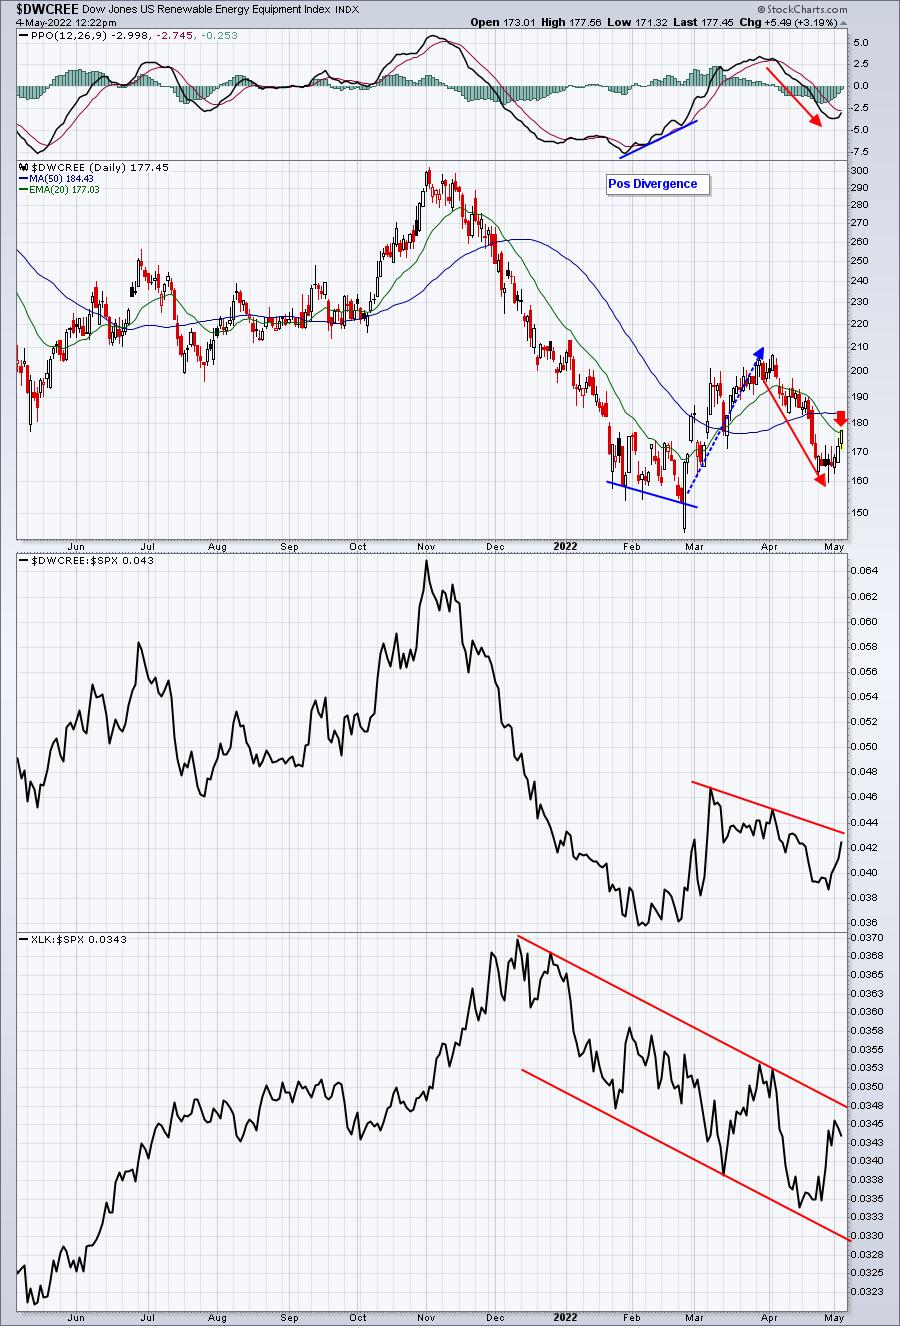
The DWCREE appears to remain in a relative downtrend vs. the benchmark S&P 500 and there's no positive divergence in play this time as it attempts to clear its 20-day EMA. Most 20-day EMA attempts fail when momentum remains bearish, which it is now. Also, while technology (XLK) has had a solid 1-2 week relative run, the 2022 downtrend vs. the S&P 500 may be getting close to resuming. A number of high-profile, second-tier technology companies are getting set to report their quarterly results. It will be very interesting to see how the entire sector handles this.
ChartLists/Strategies
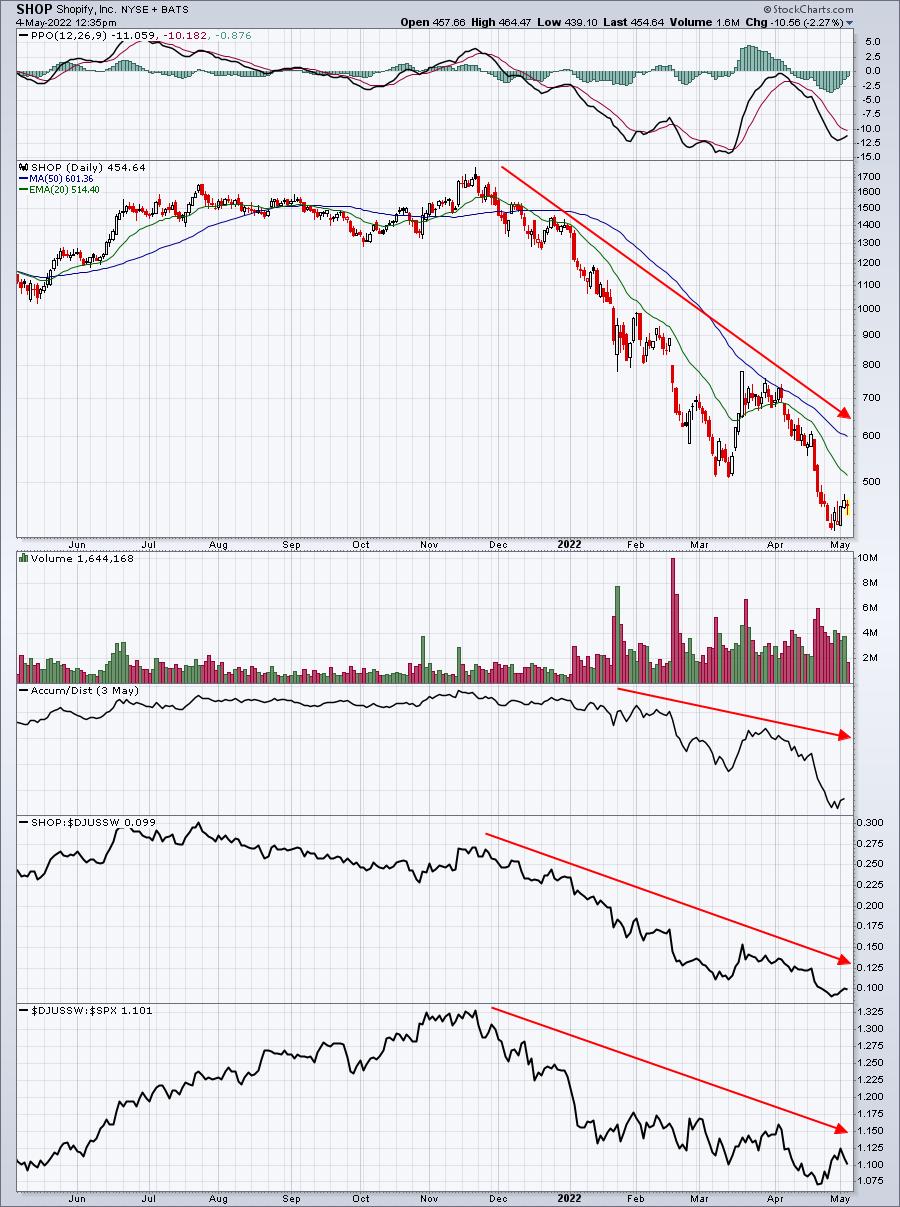
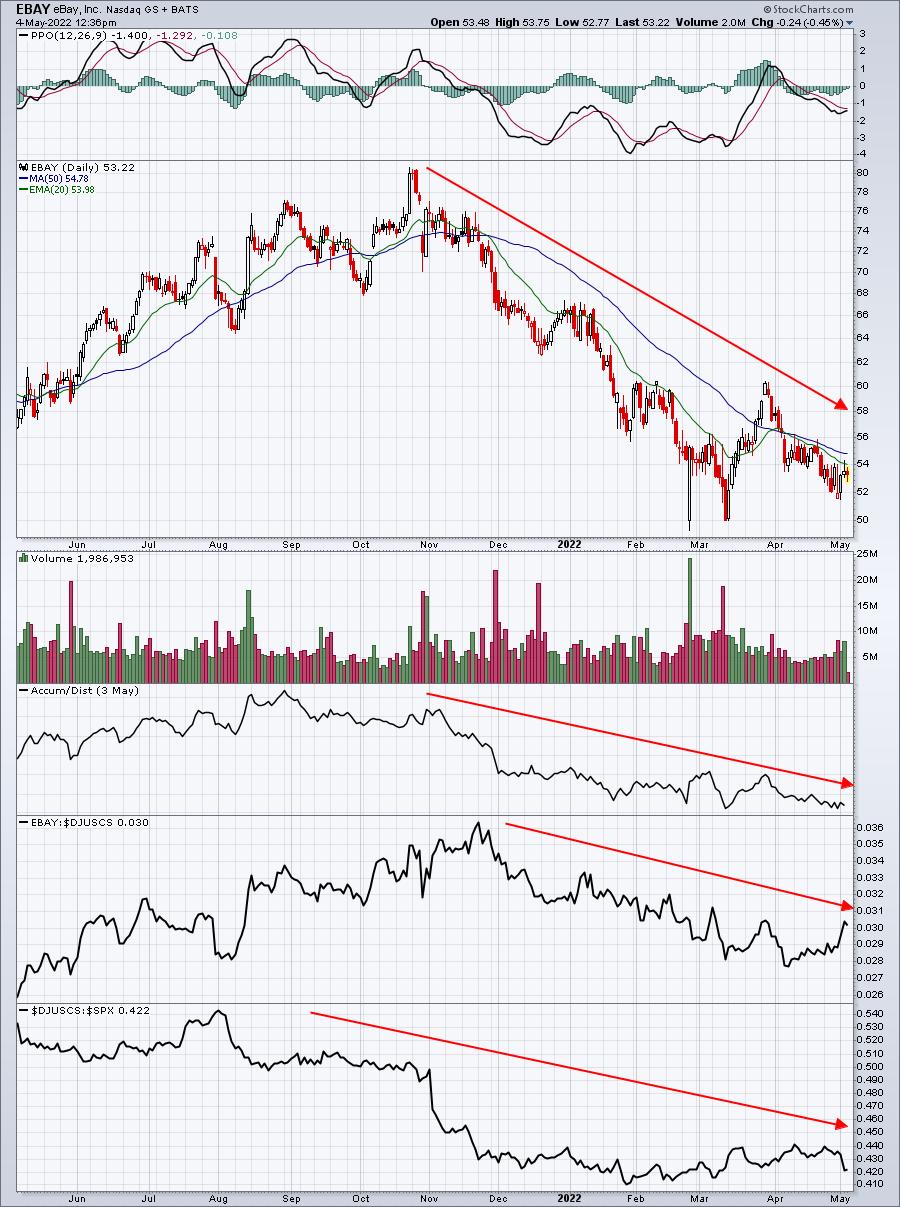
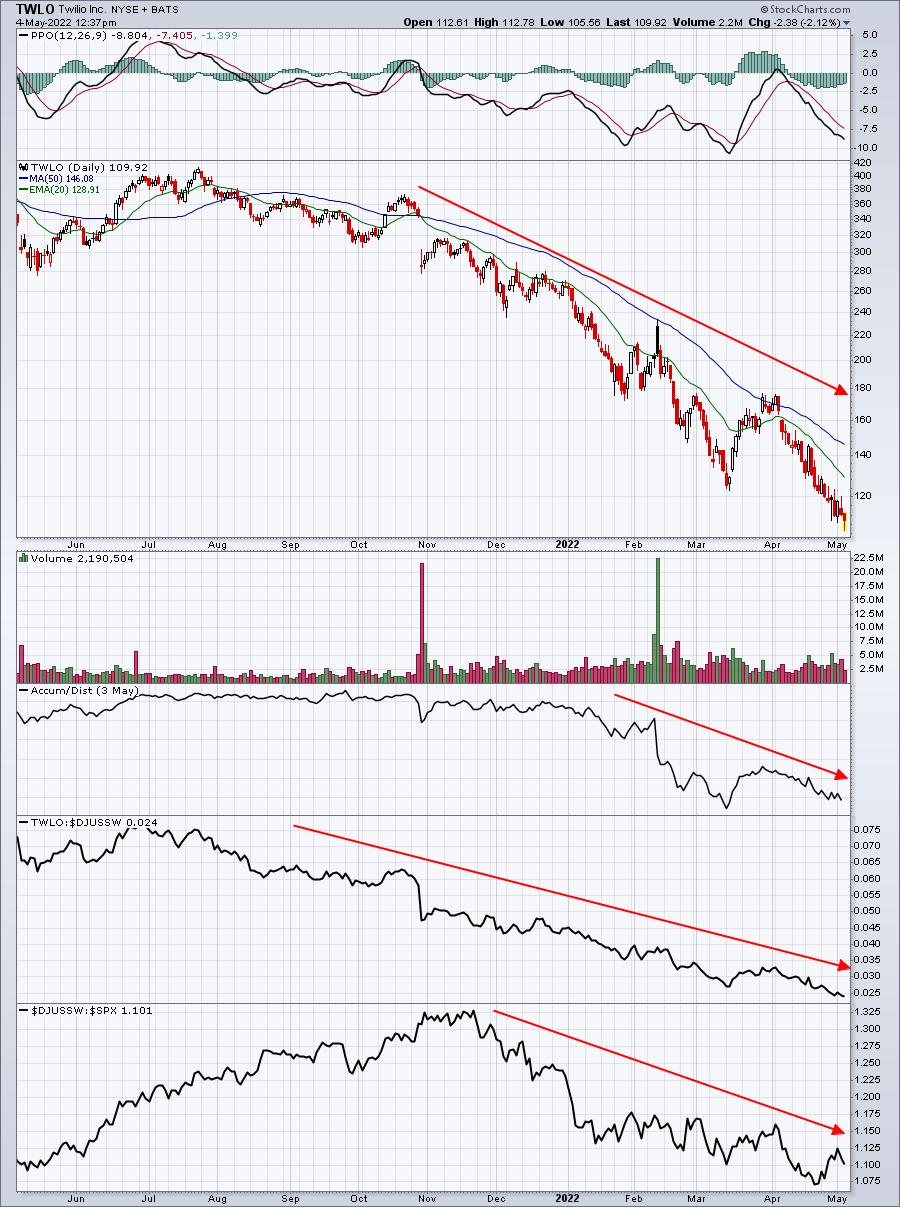
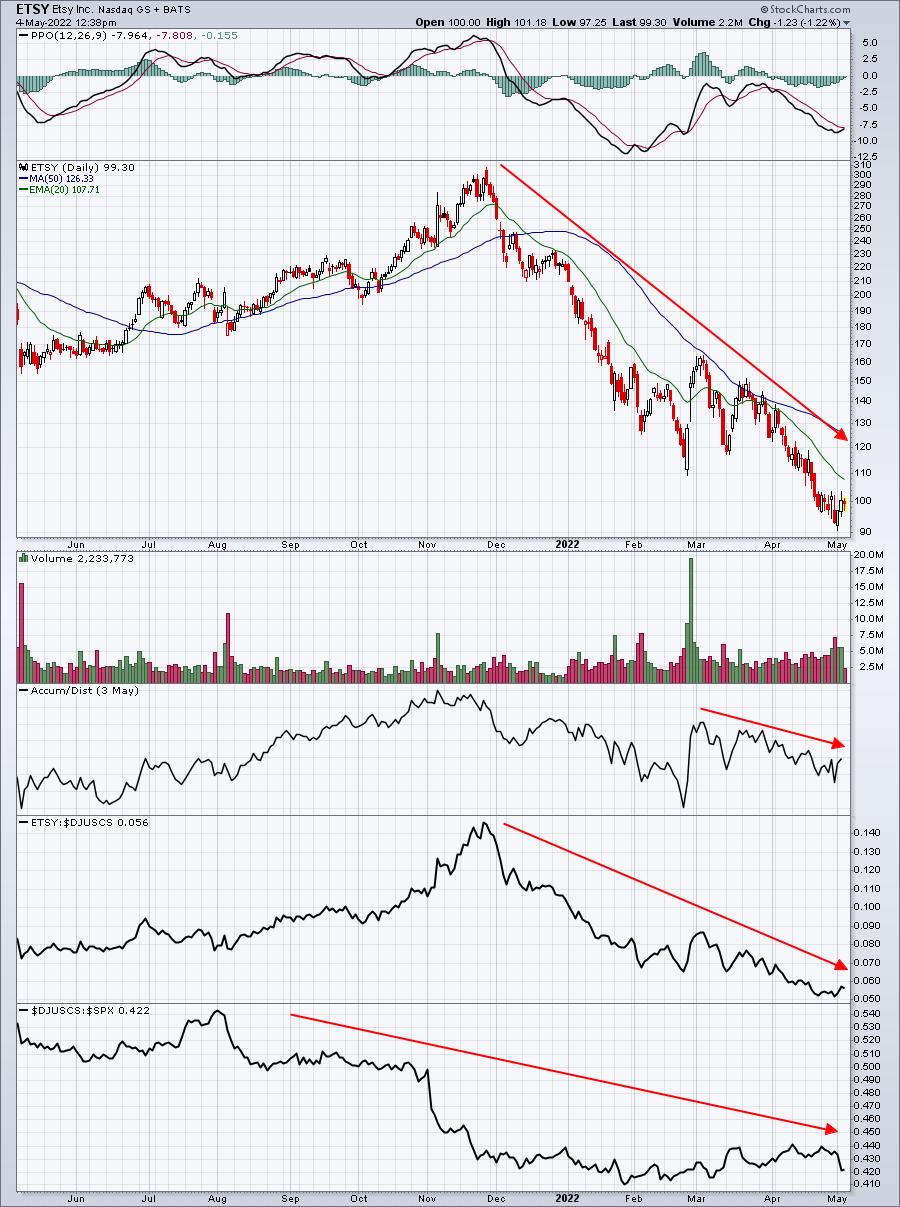
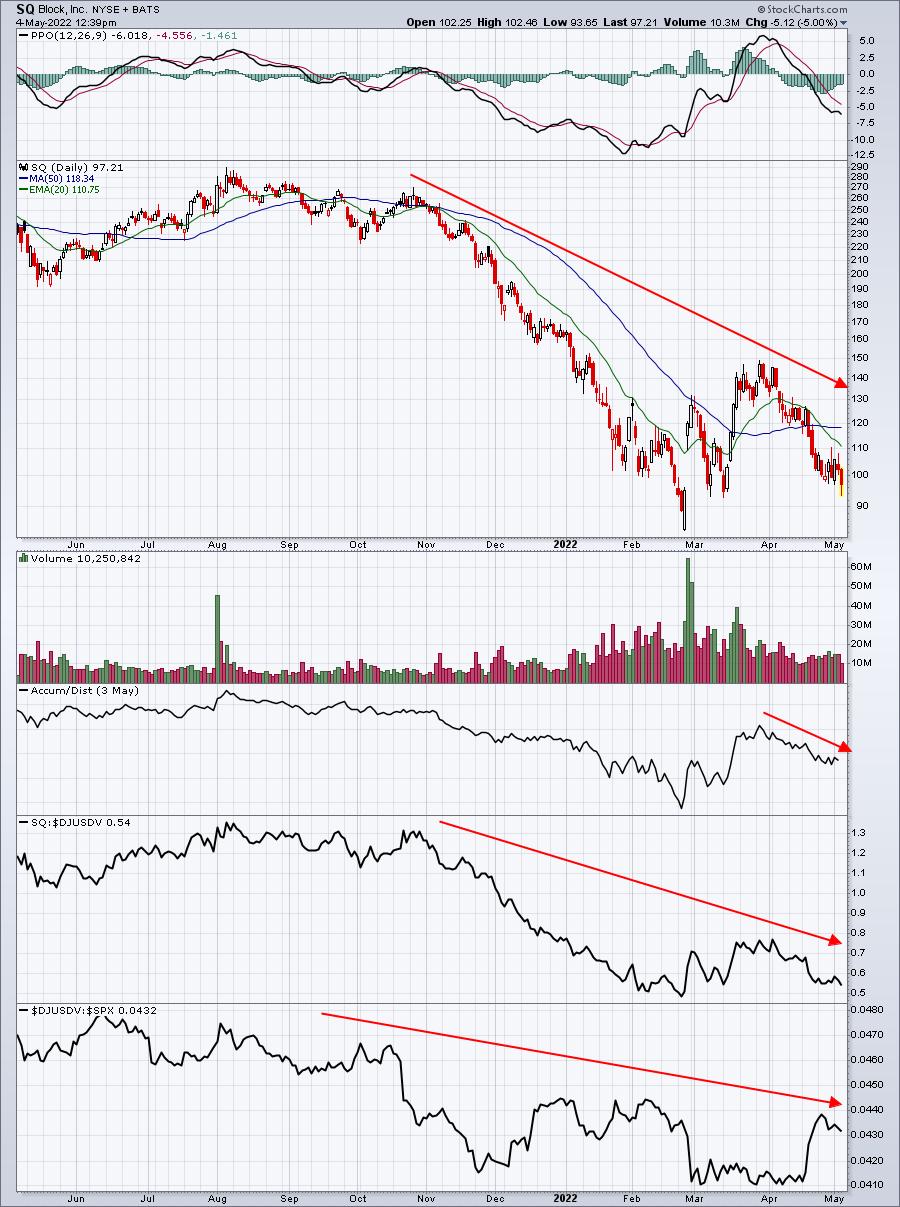
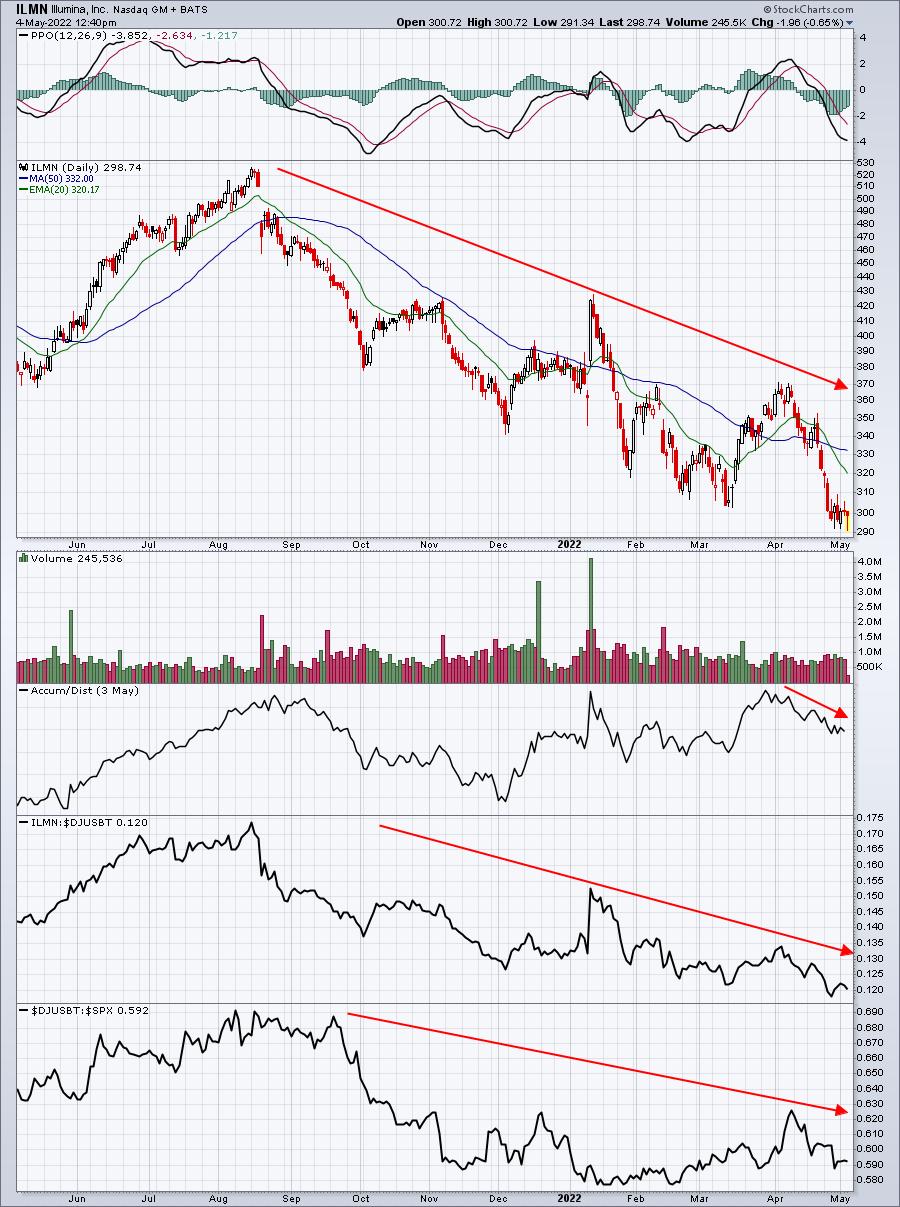
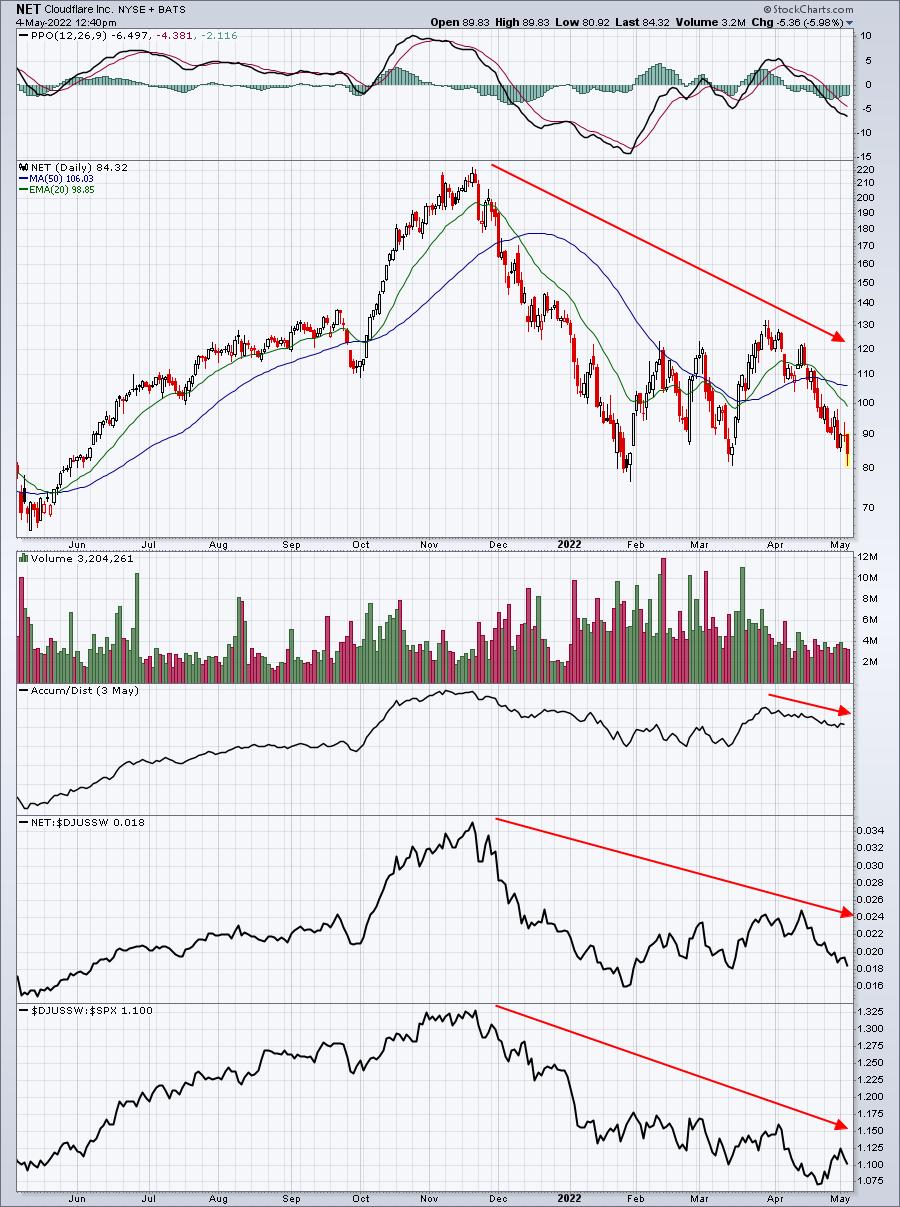
Between today and tomorrow, nearly 1000 companies will be set to report quarterly results. It's the busiest two-day period of the quarter in terms of earnings volume. I am most interested in seeing how the mid-cap and large-cap growth names report and what kind of Wall Street reaction they receive. Based on their dismal absolute and relative strength, I fully expect the numbers/guidance to be bad. If so, do we see gaps and further selling? Or possible accumulation? I'm going to highlight a number of them below and want you to focus on their relative performance vs. their peers as they report:
SHOP:
EBAY:
TWLO:
ETSY:
SQ:
ILMN:
NET:
BILL:
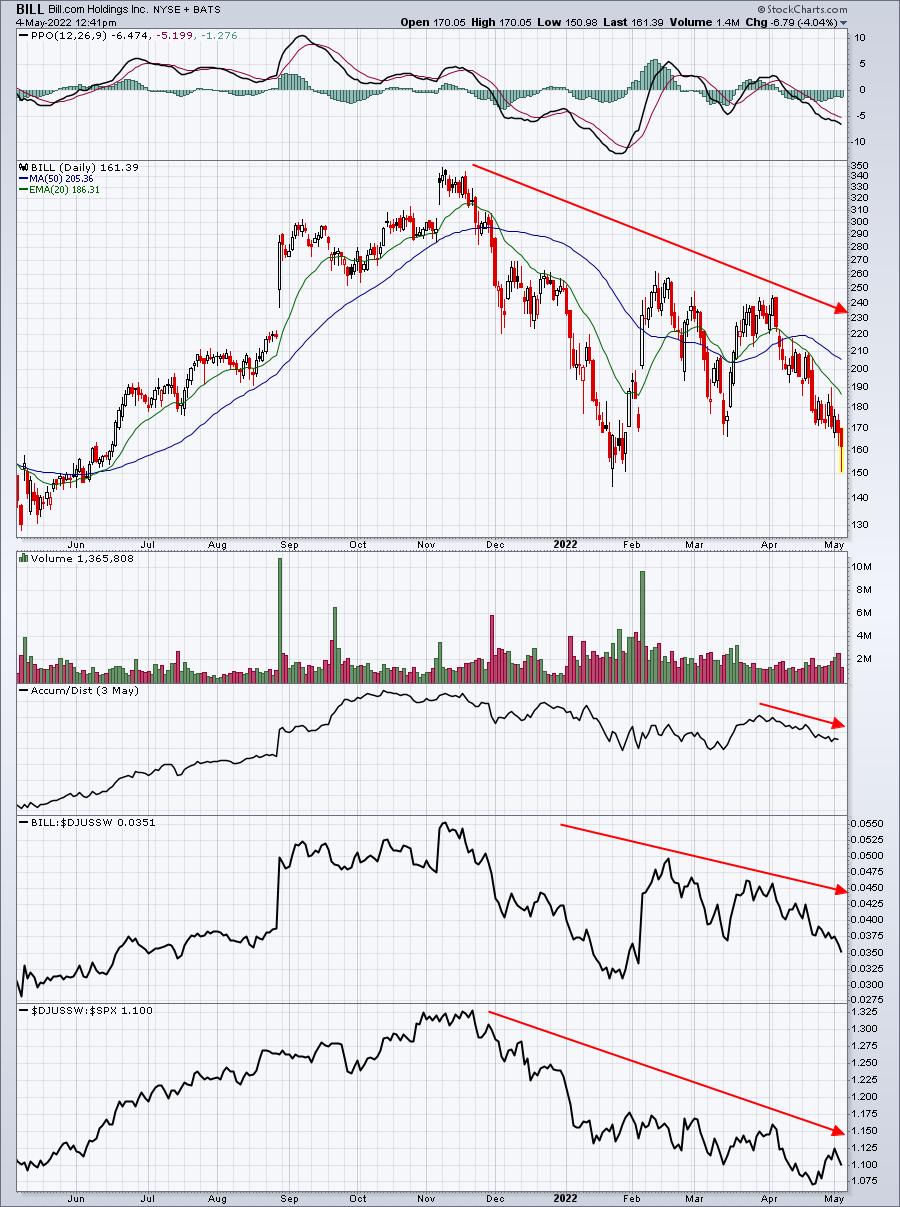
These charts really don't need commentary. They're ugly. But these were several of the stocks that led the market higher when growth stocks were soaring. Will they come back and lead again? I believe several will, but the question is WHEN?
One very important distinction between these 8 charts is their respective AD lines. SHOP's is awful, showing what appears to be mass distribution currently. However, as you look at those bottom four - SQ, ILMN, NET, and BILL - I think their AD lines are telling us a different story. They appear as though they're perhaps being accumulated, despite the weakness in price. Will they report differently from the others? Will their Wall Street reactions be different?
It's something to watch over the next couple days.
Earnings Reports
Here are the key earnings reports for the next two days, featuring stocks with market caps of more than $10 billion. I also include several companies with market caps below $10 billion. Finally, any portfolio stocks that will be reporting results are highlighted in BOLD. If you decide to hold a stock into earnings, please understand the significant short-term risk that you are taking. Please be sure to check for earnings dates for any companies you own or are considering owning.
Wednesday, May 4:
CVS, BKNG, REGN, UBER, MAR, PXD, MET, MRNA, EMR, FTNT, CTSH, JCI, CTVA, O, GOLD, RACE, IDXX, ET, ALL, LNG, YUM, TT, ABC, ES, EBAY, FNV, ANSS, FTS, VMC, HZNP, ALB, VICI, CDW, TWLO, CF, CLR, BIP, IR, MRO, ATO, TECH, HST, XYL, APA, GNRC, GDDY, QRVO, CRL, ETSY, NI, AFG, WOLF, LSI, OTEX, TPL, CHK, LUMN, LNC, GFL, JAZZ, BWA, NBIX, BRKR, RGLD, CDAY, PNW, UTHR, STOR, FLEX, GIL, SRPT, TNDM, MUR, LITE, CLH, RPD, TXG, QLYS, SPR, QDEL, SUN, DOCN, RUN, LIVN, TRIP, SITM, DIOD, TWNK, REGI, FSR, KLIC, WING, STAA, NUVA, SIMO, SAVE, EVH, NGVT, GKOS, NUS, OTLY, EXPI, FSLY, ACLS, VMEO, EAT, MARA, LGND, CRTO, AVID, AVNS, PLMR, IRBT, VCEL, MGNI, SILK, TGLS
Thursday, May 5:
COP, BUD, ZTS, BDX, EOG, VRTX, D, ICE, SQ, SHOP, APD, MELI, SRE, BCE, ILMN, MCK, MNST, RSG, DDOG, PH, ED, LCID, APO, APTV, MTD, NET, DASH, CBRE, MT, BLL, RPRX, LYV, AEE, K, VTR, PBA, PPL, RCL, WPM, FLT, HUBS, BILL, OWL, PODD, TRGP, TRMB, PWR, EPAM, CAH, ARGX, EVRG, NLOK, AMH, WRK, NWSA, CGNX, LAMR, PCTY, MMP, DVA, CCJ, ZG, W, FND, HII, CFLT, DBX, OGN, DLB, BERY, RGA, AVLR, MP, GH, OLED, PENN, UNM, WCC, ADT, SYNA, BLD, SAIL, TXRH, INGR, MTZ, PRI, SEAS, HBI, OPEN, AL, FOUR, WWE, CROX, BECN, TDC, NTLA, IRTC, APPN, NTRA, PGNY, BE, PZZA, ALRM, HAIN, BCC, NKLA, SPWR, VIR, PBH, AXNX, INSM, FTDR, SHAK, IHRT, YELP, ATSG, MDRX, NTCT, KTB, TDS, GOGO, VSTO, SPCE, SWI, AAWW, KTOS, NOG, SBH, HCC, CDNA, MYGN, TGH, SKT, TVTY, TWST, PLYA, GDOT, CRSR, AMCX, GPRO, CNXN, RDFN, AOSL, DVAX, BKD, TREE
Economic Reports
April ADP employment report: 247,000 (actual) vs. 398,000 (estimate)
Happy trading!
Tom