
EB Daily Market Report - Friday, May 6, 2022
Executive Market Summary
- Futures were weak overnight, continuing yesterday's broad market selloff
- After gapping lower, all of our major indices turned positive briefly before further selling followed
- The risk-off environment remains troubling, as I pointed out in yesterday's DMR
- Energy (XLE, +1.59%) is the only sector in positive territory
- Communication services (XLC, -2.00%) again finds itself in the sector basement
- Publishing ($DJUSPB, -9.47%) is very hard hit, due to the drop in News Corp (NWSA, -12.82%); NWSA hit its lowest level since November 2020 after reporting quarterly results
- Natural gas ($NATGAS, -8.31%), after a HUGE move higher the past week, is giving some back today
- Other commodities are mixed with both crude oil ($WTIC, +1.25%) and gold ($GOLD, +0.40%) higher
- The 10-year treasury yield ($TNX) is up 5 basis points to 3.12%, moving closer and closer to a major yield resistance level near 3.25% - one not breached since 2011
- Under Armour (UAA, -23.79%) and Illumina (ILMN, -16.10%) are among today's worst-performing stocks after reporting quarterly results
Market Outlook
The good news is that with every drop in our major indices, we get closer to a bottom. The bad news is that the market still isn't providing us any sort of definitive signal suggesting the bottom is imminent. Currently, we're in a downtrend. Short-term, I like to follow the 60-minute (hourly) charts for directional clues. When the hourly PPO is screaming lower, as it is now, we typically see rallies foiled at or near the 20-hour EMA or the 50-hour SMA. Check this NASDAQ hourly chart out:
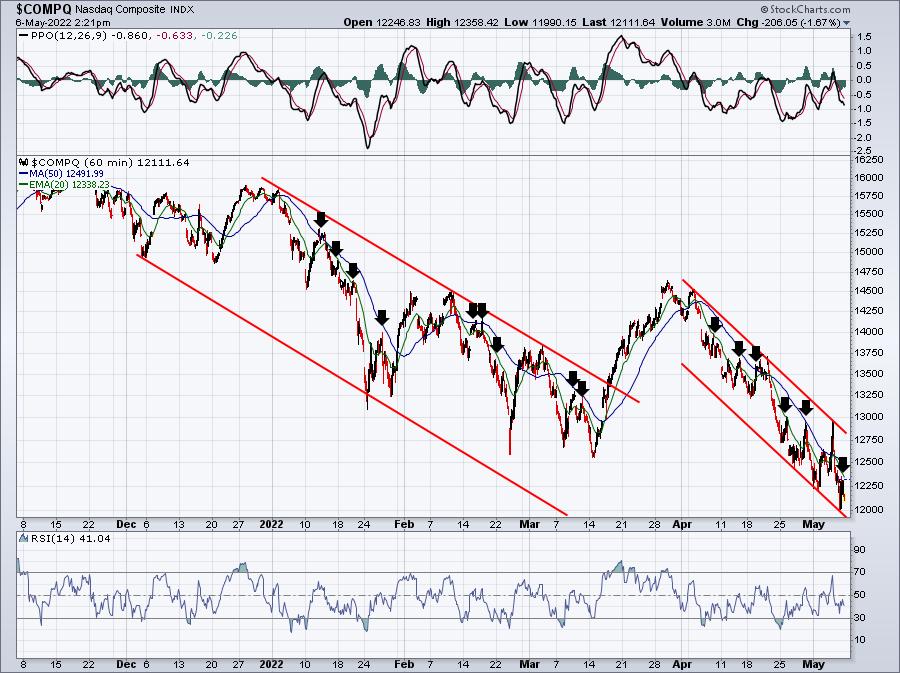
The red parallel lines mark down channels, while the black arrows mark key 20-hour EMA and 50-hour SMA tests. They certainly don't all work as resistance, but I believe the odds are with the bears when we see these tests. On today's earlier bounce, we approached the 20-hour EMA before turning lower again.
It's really hard to be bullish short-term, but my opinion longer-term hasn't changed one bit. We're getting closer to the bottom I discussed at the beginning of the year. Remember, it's all about PATIENCE.
Sector/Industry Focus
Yesterday was a horrific market day, by almost any account. Yet did you see the equity only put call ratio ($CPCE)? It finished at .63. How much selling does the market have to do to encourage the options traders to "throw in the towel" and buy equity puts in record numbers? That almost always marks our major bottoms. I've spoken throughout 2022 about the need for sentiment to "reset" in more bearish fashion. We're getting there, but it's been painstakingly slow. Here's the daily chart of the CPCE, where you can see sentiment is definitely growing more bearish:
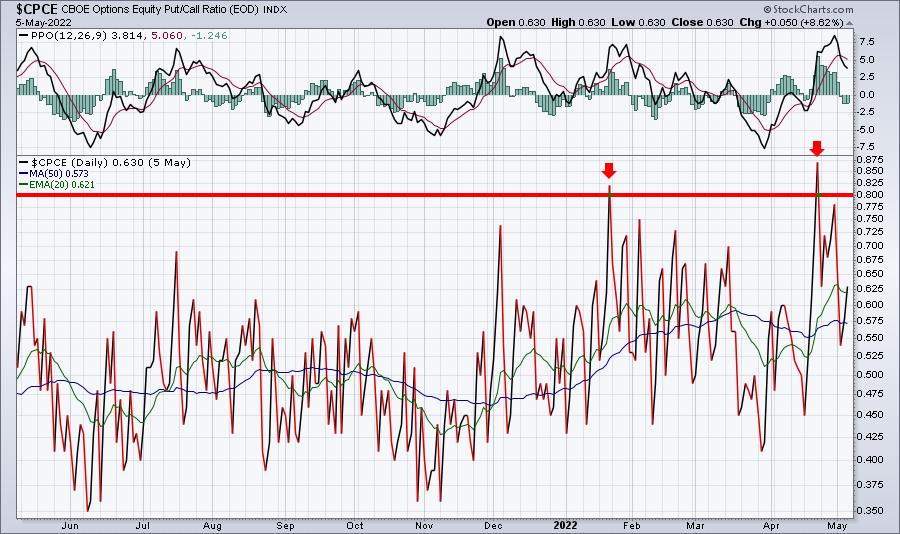
The two red arrows mark daily CPCE readings above .80. I find the .80 level to be key, because nearly every major market bottom has occurred when the 5-day moving average of the CPCE is at .80 or above. Again, let me repeat that the 5-day moving average of the CPCE needs to move above 80. While we're definitely seeing a rise in the CPCE, we've only had 2 days (!!!) of readings over .80. We need to AVERAGE this over a 5-day period. Below is a chart of the S&P 500 with the 5-day moving average of the CPCE in the panel beneath:
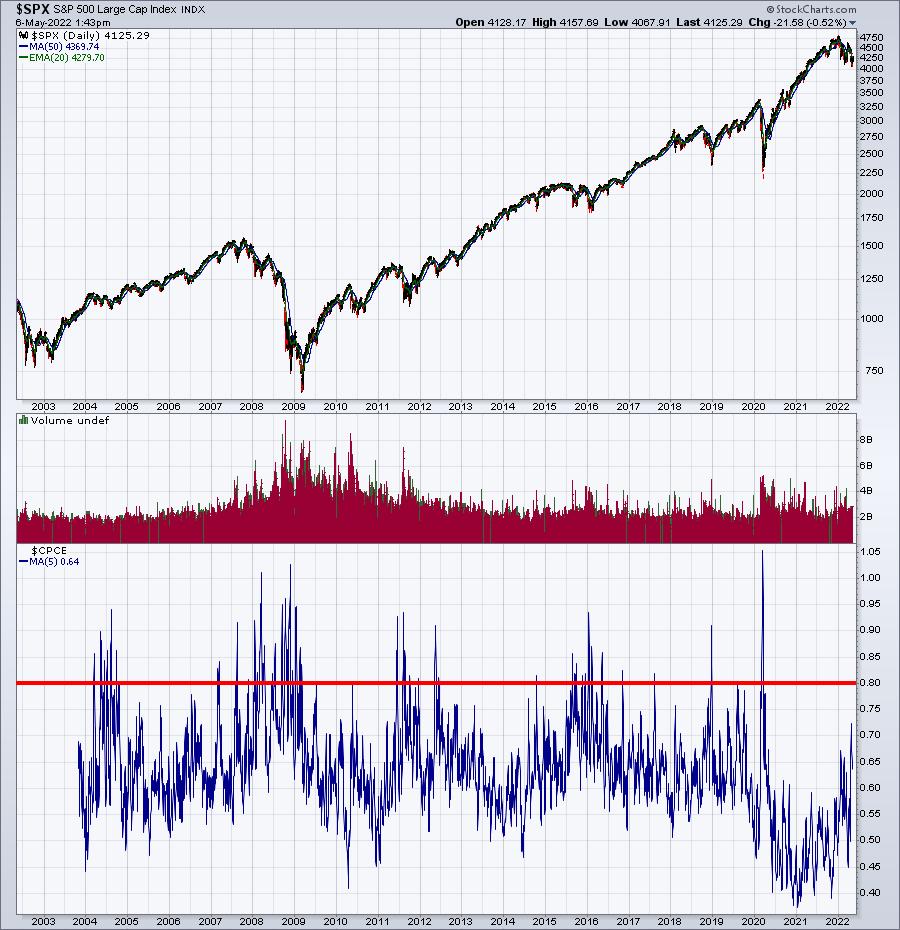
This chart takes us back two decades. Sentiment is a bit relative. During secular bear markets, bearish sentiment becomes overwhelming and this 5-day moving average of the CPCE varies mostly from 0.50 to 0.90. During a secular bull market, I'd expect to see more of a 0.40 to 0.80 range. If our 5-day moving average of the CPCE gets closer and closer to .80, I believe we'll be breathing down the neck of a MAJOR stock market bottom.
Was the recent 5-day reading at .72 enough to mark a bottom? Possibly, but I don't think so. Plus, there are no other signals of a market bottom. Rotation remains quite bearish, so I'm looking for further market weakness.
ChartLists/Strategies
The whipsaw and severe moves in both directions leave me completely on the sidelines. Outside of very quick trades with very tight stops, I remain in cash. I'll revisit a few trade candidates next week. Let's see how we finish the week. I have no interest in holding stocks over the weekend. We could wake up to ANYTHING on Monday morning.
Earnings Reports
Here are the key earnings reports for the next two days, featuring stocks with market caps of more than $10 billion. I also include several companies with market caps below $10 billion. Finally, any portfolio stocks that will be reporting results are highlighted in BOLD. If you decide to hold a stock into earnings, please understand the significant short-term risk that you are taking. Please be sure to check for earnings dates for any companies you own or are considering owning.
Friday, May 6:
ENB, CI, TU, IEP, DISH, AES, DKNG, VST, NRG, ESNT, GT, SR, FLR, SPB, BLDP, GTN, SSP, PRLB, IMGN, RUTH
Monday, May 9:
DUK, SU, EXC, SPG, MCHP, BNTX, TSN, IFF, PLTR, OVV, PLUG, VTRS, EQH, ELAN, WTRG, JLL, CLVT, ACM, ZNGA, RNG, AMC, UPST, IAC, TREX, DNB, XPO, RCM, COTY, FSK, RBA, SWAV, VVV, HGV, ICUI, NVAX, TGNA, CARG, APPF, MAC, TASK, ANGI, FROG, OPK, EVBG, HBM, LPSN, DDD, LMND, VECO, RDNT
Economic Reports
April nonfarm payrolls: 428,000 (actual) vs. 400,000 (estimate)
April private payrolls: 406,000 (actual) vs. 390,000 (estimate)
April unemployment rate: 3.6% (actual) vs. 3.6% (estimate)
April average hourly earnings: +0.3% (actual) vs. +0.4% (estimate)
Happy trading!
Tom