
EB Daily Market Report - Monday, May 9, 2022
Today's Event
Well, it's that time of the quarter again. Our "DRAFT" of our portfolio stocks will take place next Thursday, May 19th. Tonight, however, is our "Sneak Preview Event", where I'll discuss the overall market environment and some of the strategies I'll likely employ to fill out our portfolios next week. It should be a highly educational event, so I'd encourage you to join me. Below is a link to the webinar room:
https://earningsbeats.zoom.us/j/82052502721
The room will open at 4:00pm ET and the webinar will begin at 4:30pm ET.
Executive Market Summary
- Futures were very weak overnight, continuing last week's big selloff on Thursday and Friday
- The 10-year treasury yield ($TNX) is down 4 basis points after opening higher; this could be good news short-term for growth stocks if the yield continues dropping this afternoon
- Cryptocurrencies suffered a rough weekend and they continue getting pounded today; ethereum ($ETHUSD) is down more than 9% today and 20% over past 5 days
- Gold ($GOLD, -1.33%) isn't even rallying with fear rising
- Nearly all commodities are lower today, with natural gas ($NATGAS) dropping more than 9%
- Energy (XLE, -7.69%) is seeing much of last week's gains erased as crude oil ($WTIC, -5.89%) drops more than $6 per barrel
- Technology (XLK, -3.46%) and consumer discretionary (XLY, -3.41%) are again having very rough days
- Renewable energy ($DWCREE, -6.56%) is selling off hard for a third consecutive day to lead the XLK lower
Market Outlook
One way to view how stretched the S&P 500 has become to both the upside and downside is to pull up a multi-month hourly chart and check out the rate of change (ROC). I use 32 hours, which is roughly the equivalent of one week, but you can change this ROC to whatever length of time you're interested in. Here's what the 32 period ROC looks like right now and how stretched we've seen it throughout 2022:
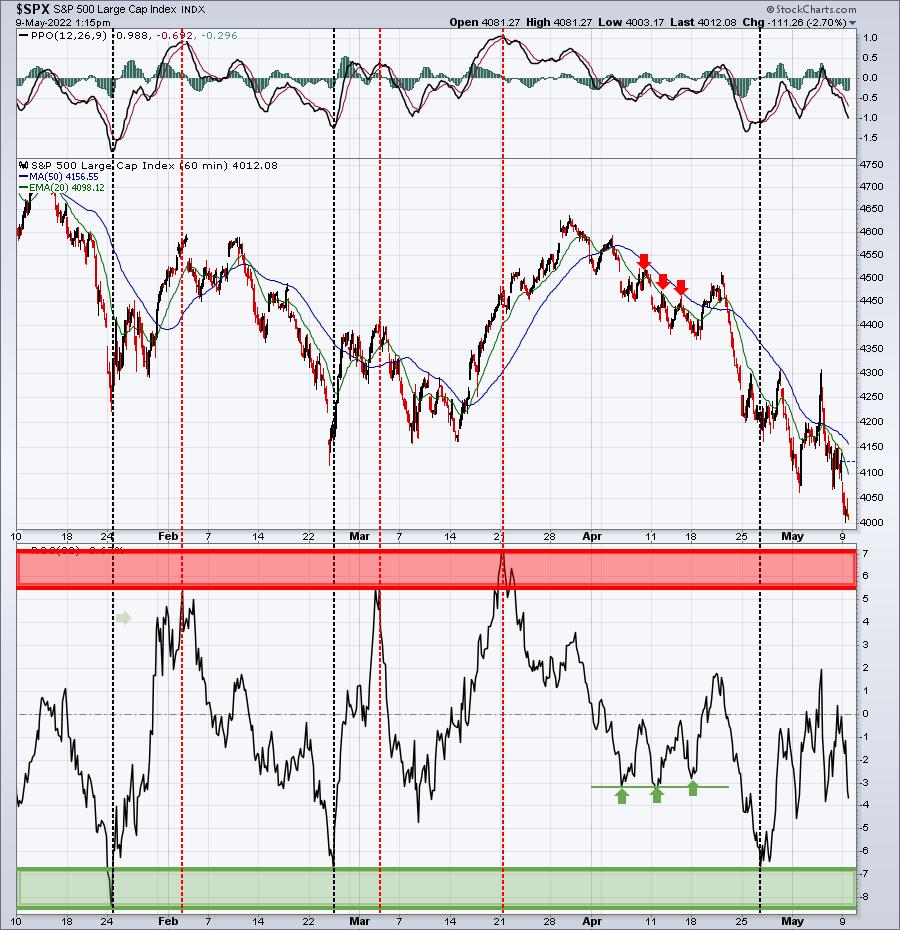
Currently, we're just beneath -3%, which, unbelievably, isn't that close to previous stretched readings during selloffs. So this would suggest that we could have further downside near-term. This ROC calculation will accelerate rapidly, though, because we went straight up at the beginning of last week. So the longer we stay where we are, or drop further, the more stretched this 32 period ROC will become. The -7% to -8% stretched level has been a solid "bounce" indicator thus far in 2022, so watch for that on further selling and deterioration.
Also, I drew a green horizontal line near the -3% level as that recently signaled short-term bounces to challenge the declining 20-day EMA. If we do bounce today or tomorrow, I'd expect the 20-day EMA to provide short-term resistance.
Sector/Industry Focus
Want some good news? I'm seeing a positive divergence forming on the daily chart of semiconductors ($DJUSSC):
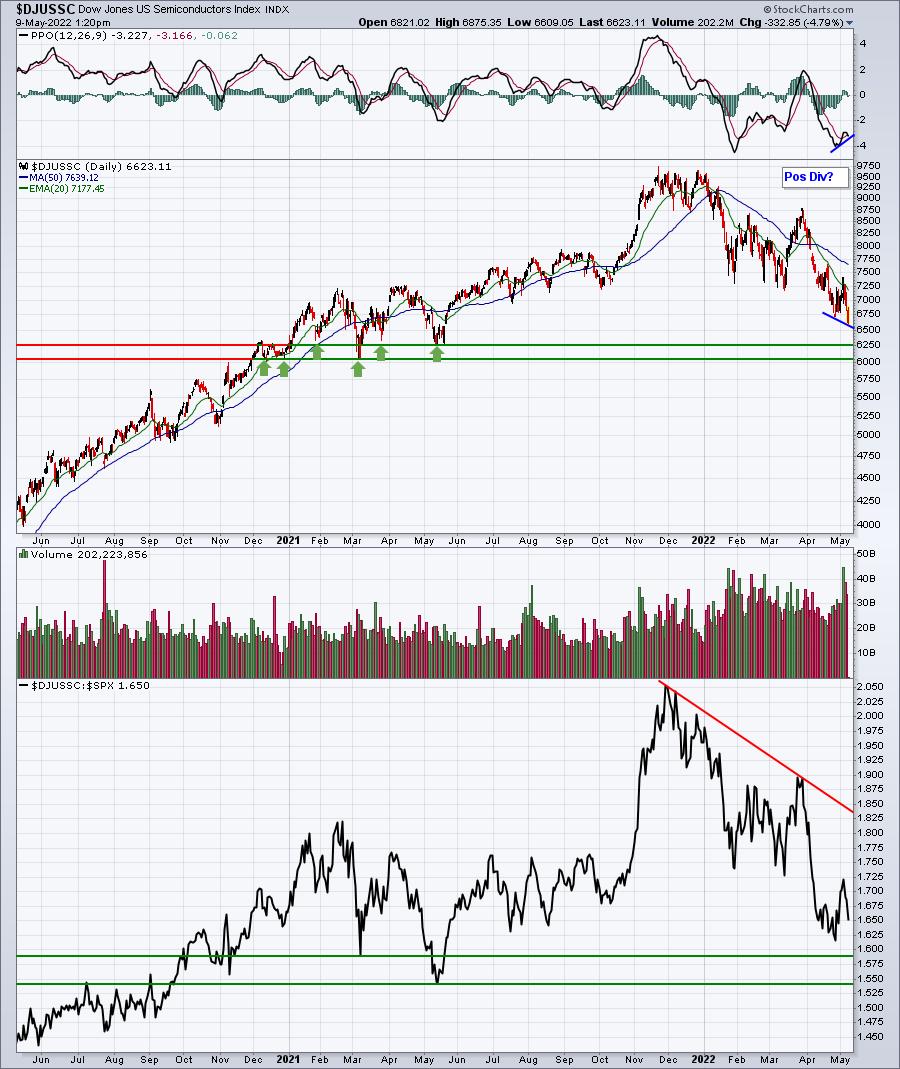
While that provides us no guarantees, of course, it is a signal that the downward price momentum is starting to ease and it CAN signal a major reversal to the upside. The more and more bullish signals that emerge, the better chance we have of finally finding a major market bottom. There's also the chance that, as prices continue marching lower, the positive divergence is eliminated as the daily PPO sets a new low. Like I said, there are no guarantees here, but I wanted to point out at least one small potential positive.
ChartLists/Strategies
Well, I wondered what we might wake up to on Monday morning and it was.....bright red futures. Cash remains a viable option and one that carries no risk, which isn't a bad alternative to what we've been enduring in U.S. equities year-to-date. I know it's boring, but my #1 objective in a cyclical bear market is coming out the other side of it with all or the overwhelming majority of my capital intact. The current whipsaw action makes it nearly impossible to keep up with a large stable of stocks, so I personally continue to trade no more than 2 or 3 stocks at a time and, many days, I make zero trades. If it's not a perfect setup where I can keep my stop very, very tight, I don't trade.
Here are 3 current trades of mine (plus a small QLD position):
CHD:
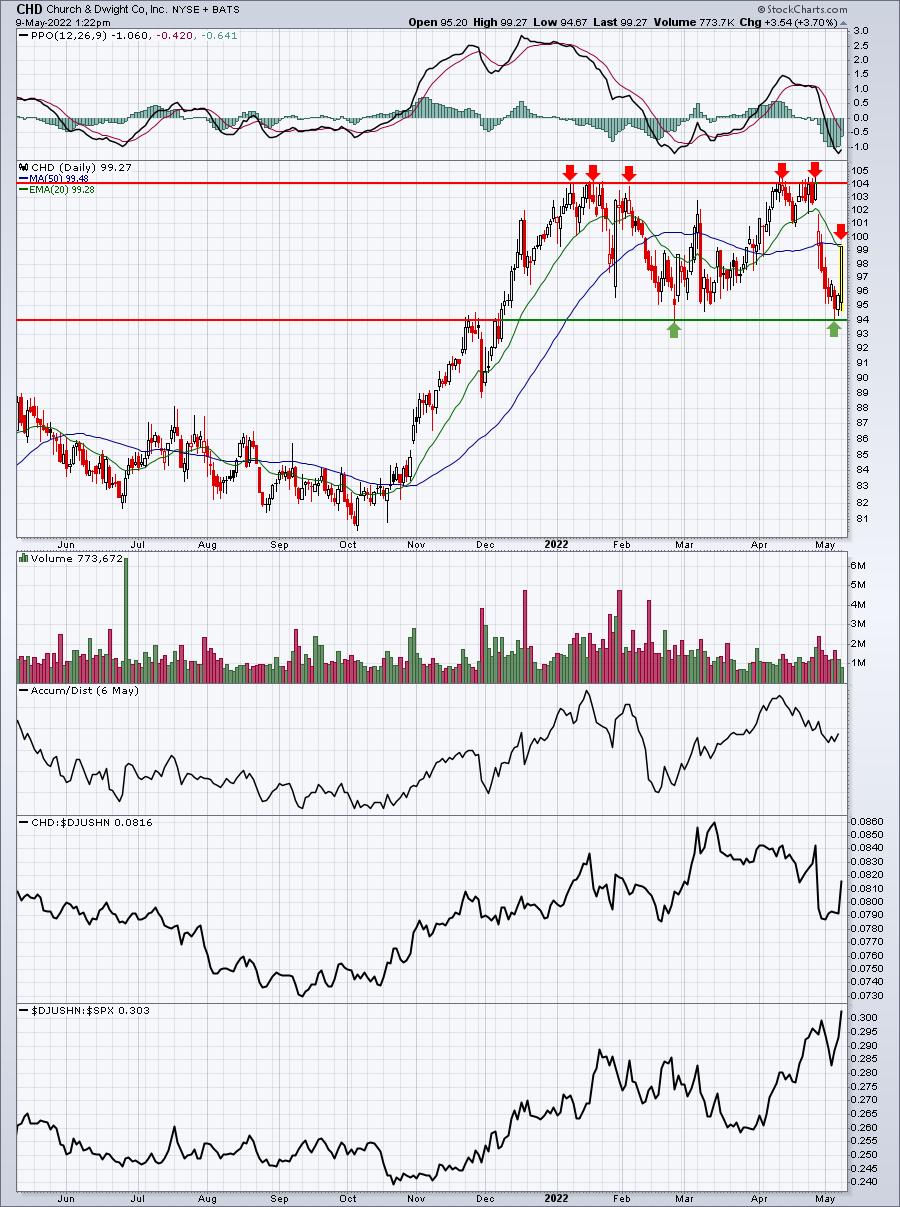
I bought CHD very close to support in the 94s and I sold it this morning as it approached its 20-day EMA. I love the stock and the defensive industry group ($DJUSHN), but a profit is a profit in this market. If CHD can close above its 20-day EMA, it has a solid opportunity to move higher and challenge its recent price high just above 104. But I took my money and RAN!
BA:
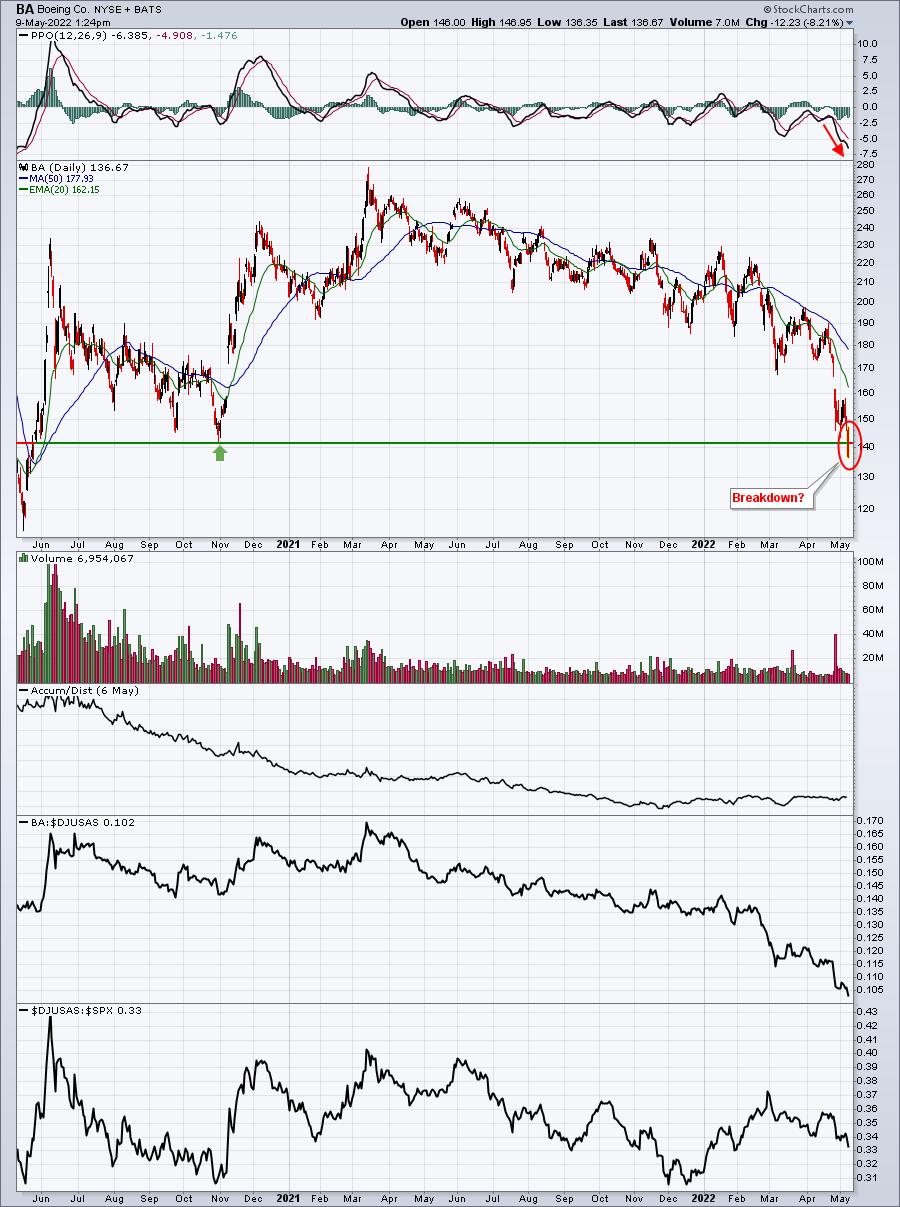
BA was rapidly approaching a very important price support level at 141.58 (intraday low from October 2020). I thought I'd step in front of a freight train and try to catch a bottom. I got run over and stopped out with a little more than a 1% loss. I'll revisit this trade if BA rallies this afternoon. Right now, however, it's in break down territory.
ABNB:
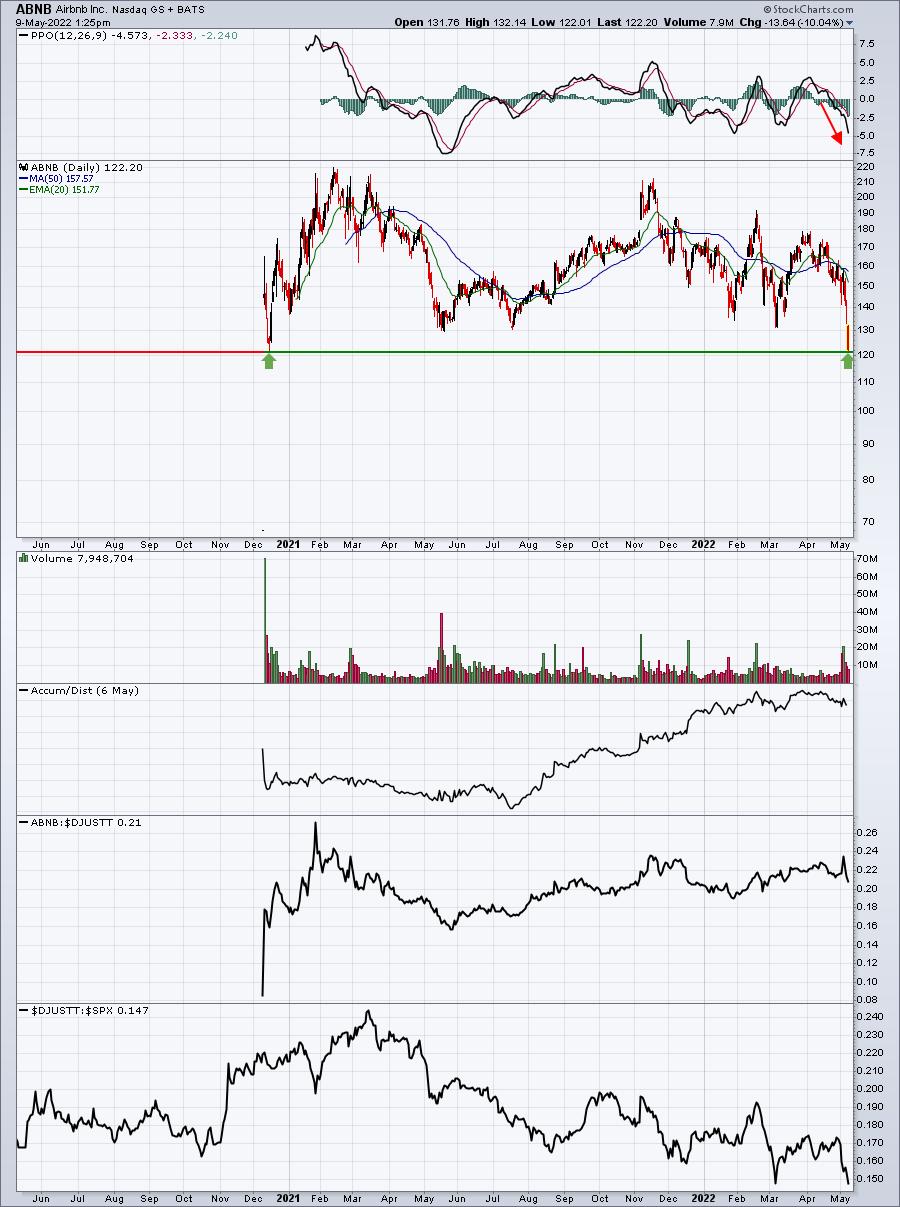
I really like ABNB. Its fundamentals remain solid and now the stock has approached very important price support at 121.50. Since going public, ABNB has not traded beneath 121.50. So I entered twice, initially just above 125 and my second order at 122.50 triggered as well. I will not hold if ABNB loses 121.50 support.
QLD:
I've taken a small position in this "juiced" ETF that tracks the NASDAQ 100 ($NDX). The 10-year treasury yield ($TNX) MIGHT be putting in a bearish engulfing candle today as it's down 4 basis points at last check, after opening higher today. If the TNX pulls back, that should provide growth stocks an opportunity to perhaps bounce here. If the QLD moves to its low of the day, I'll take the small loss.
Earnings Reports
Here are the key earnings reports for the next two days, featuring stocks with market caps of more than $10 billion. I also include several companies with market caps below $10 billion. Finally, any portfolio stocks that will be reporting results are highlighted in BOLD. If you decide to hold a stock into earnings, please understand the significant short-term risk that you are taking. Please be sure to check for earnings dates for any companies you own or are considering owning.
Monday, May 9:
DUK, SU, EXC, SPG, MCHP, BNTX, TSN, IFF, PLTR, OVV, PLUG, VTRS, EQH, ELAN, WTRG, JLL, CLVT, ACM, ZNGA, RNG, AMC, UPST, IAC, TREX, DNB, XPO, RCM, COTY, FSK, RBA, SWAV, VVV, HGV, ICUI, NVAX, TGNA, CARG, APPF, MAC, TASK, ANGI, FROG, OPK, EVBG, HBM, LPSN, DDD, LMND, VECO, RDNT
Tuesday, May 10:
OXY, SYY, WELL, EA, EC, TDG, GFS, TTD, COIN, LI, FOXA, U, RKT, RBLX, WMG, LBTYA, DAR, BLDR, FNF, BSY, WES, H, ARMK, XRAY, MIDD, TPG, WYNN, NCLH, CHH, SWCH, EXEL, AXON, PLNT, GMED, IIVI, NXST, KGC, BHC, REYN, SOFI, PTON, HALO, HRB, IGT, ZD, ELY, CELH, EYE, BOOT, HL, CRCT, BCO, HAE, IPAR, RXT, VGR, VERX, TTGT, EVRI, ARRY, CRNC, CRON, EGHT
Economic Reports
None
Happy trading!
Tom