
EB Daily Market Report - Wednesday, May 11, 2022
Executive Market Summary
- Futures were solidly higher across the board....until the April 2022 CPI numbers were released
- April Core CPI jumped 0.6%, higher than the anticipated 0.4%, but the annual core rate still fell from 6.5% to 6.2%
- Futures immediately reversed and 1.5% gains in NASDAQ futures turned into 1.7% losses in a matter of minutes
- We've witnessed a very volatile session that saw the Dow Jones open lower, then gain 600 points in less than an hour, before falling 600 over a two-hour stretch
- The 10-year treasury yield ($TNX) initially soared on the higher-than-expected CPI report, but then fell significantly below Tuesday's low; it finished down 7 basis points to 2.92%
- Cryptocurrencies were hit hard with etherium ($ETHUSD, 8.40%) falling nearly 200
- Crude oil ($WTIC, +5.39%) spiked, as did most other commodities
- Energy (XLE, +2.38%) is benefiting from the bump in crude oil; utilities (XLU, +1.20%) are also having a strong session
- Meanwhile, consumer discretionary (XLY, -3.05%) and technology (XLK, -2.97%) are lagging badly after a promising Tuesday
Market Outlook
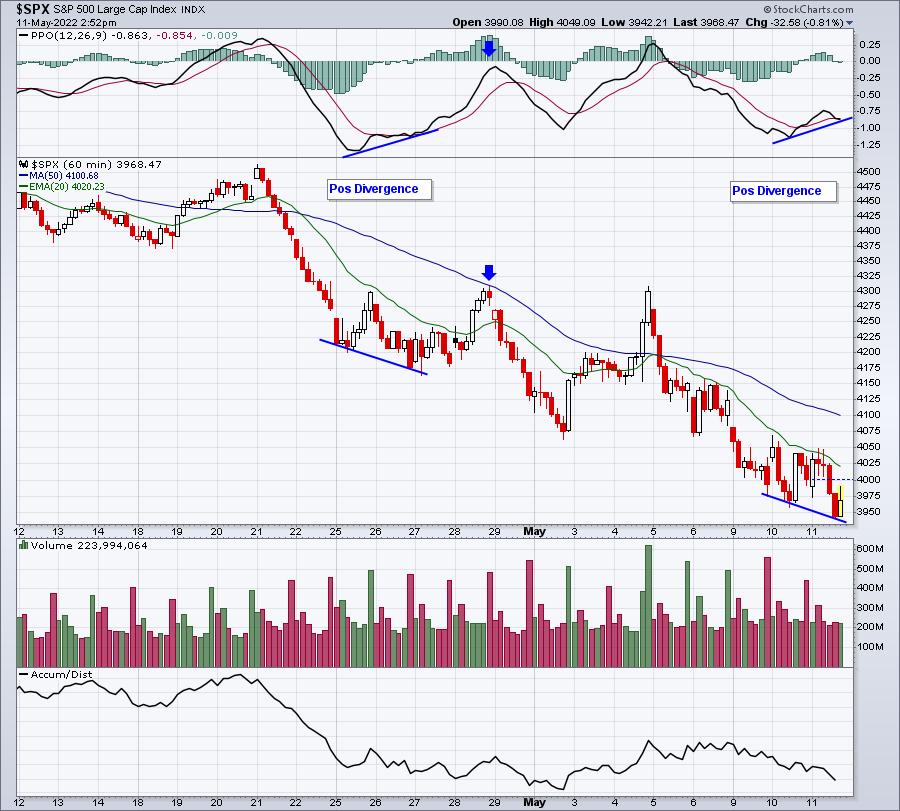
The whipsaw action continues. It's hard to trust much of anything in U.S. equities right now. Obviously, the cyclical bear market is the primary trend for now and we must respect that. Currently, the daily PPO is below the centerline and weakening, which suggests that any short-term rally will likely be contained beneath the 20-day EMA. But short-term, a positive divergence has emerged. Check out both the S&P 500 and NASDAQ:
S&P 500:
NASDAQ:
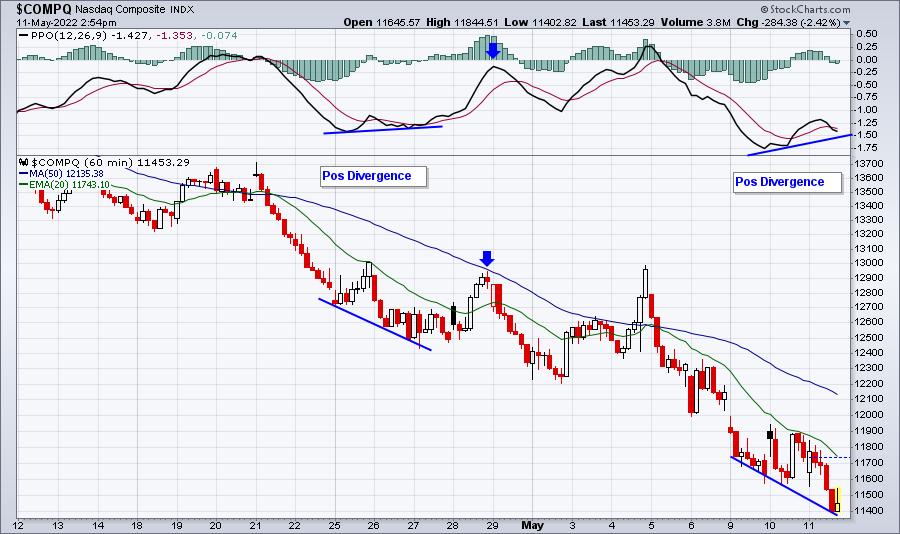
Positive divergences on hourly charts tend to play out over 1-3 days. It's no different than any other divergence. I look to PPO centerline tests and/or 50-period tests for "resets."
We're seeing very little signs, however, of a sustainable rally at this time. Yesterday, in my Special Report, I pointed out the short-term rotation into NASDAQ stocks and the extreme reading on the equity put call ratio. That bullish rotation has completely disintegrated today. I mentioned on my Trading Places show this morning to watch the XLY:XLP and $NDX:$SPX ratios. Check these ratios out (panels below S&P 500 chart):
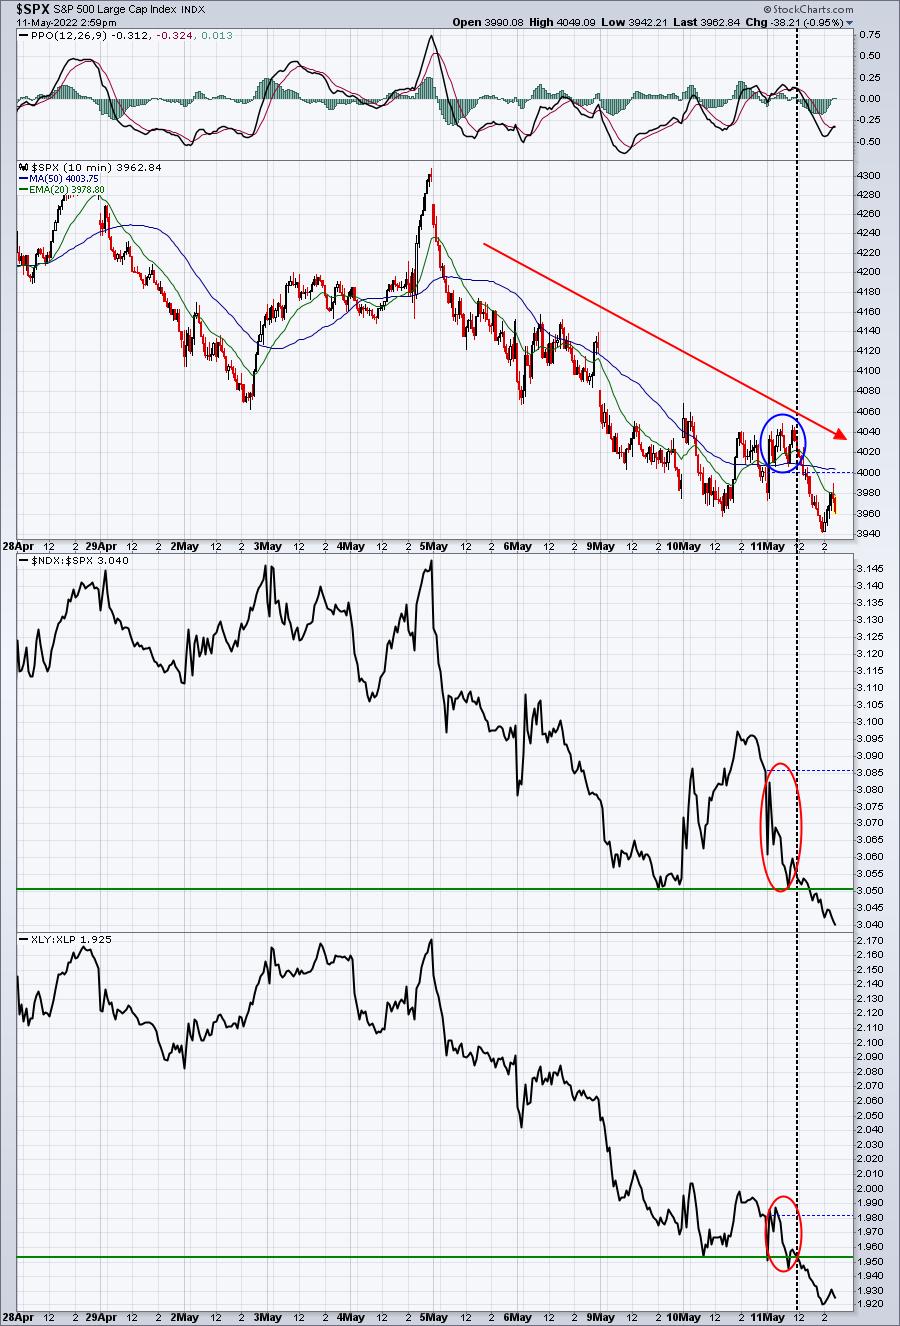
The bullish rotation that took place on Tuesday was very encouraging; unfortunately, it didn't hold up and we are now putting in new lows on both the XLY:XLP and NDX:SPX ratios. Not good.
Sector/Industry Focus
Think the stock market is crazy? Check out the bond market today. After the April Core CPI came in a bit hotter than expected, futures tanked, and the 10-year treasury yield ($TNX) shot higher from 2.94% (just before the announcement) to nearly 3.08% 30 minutes later. But since 10am ET this morning, the TNX has fallen from nearly 3.08% to 2.92%, eclipsing Tuesday's low just above 2.94%. You'd think that rapidly falling treasury yields would help to spur growth stocks, but we're seeing the opposite reaction. It's disappointing to see the NASDAQ set new lows in 2022, while the TNX has fallen from 3.16% on Monday morning to 2.92% as shown below:
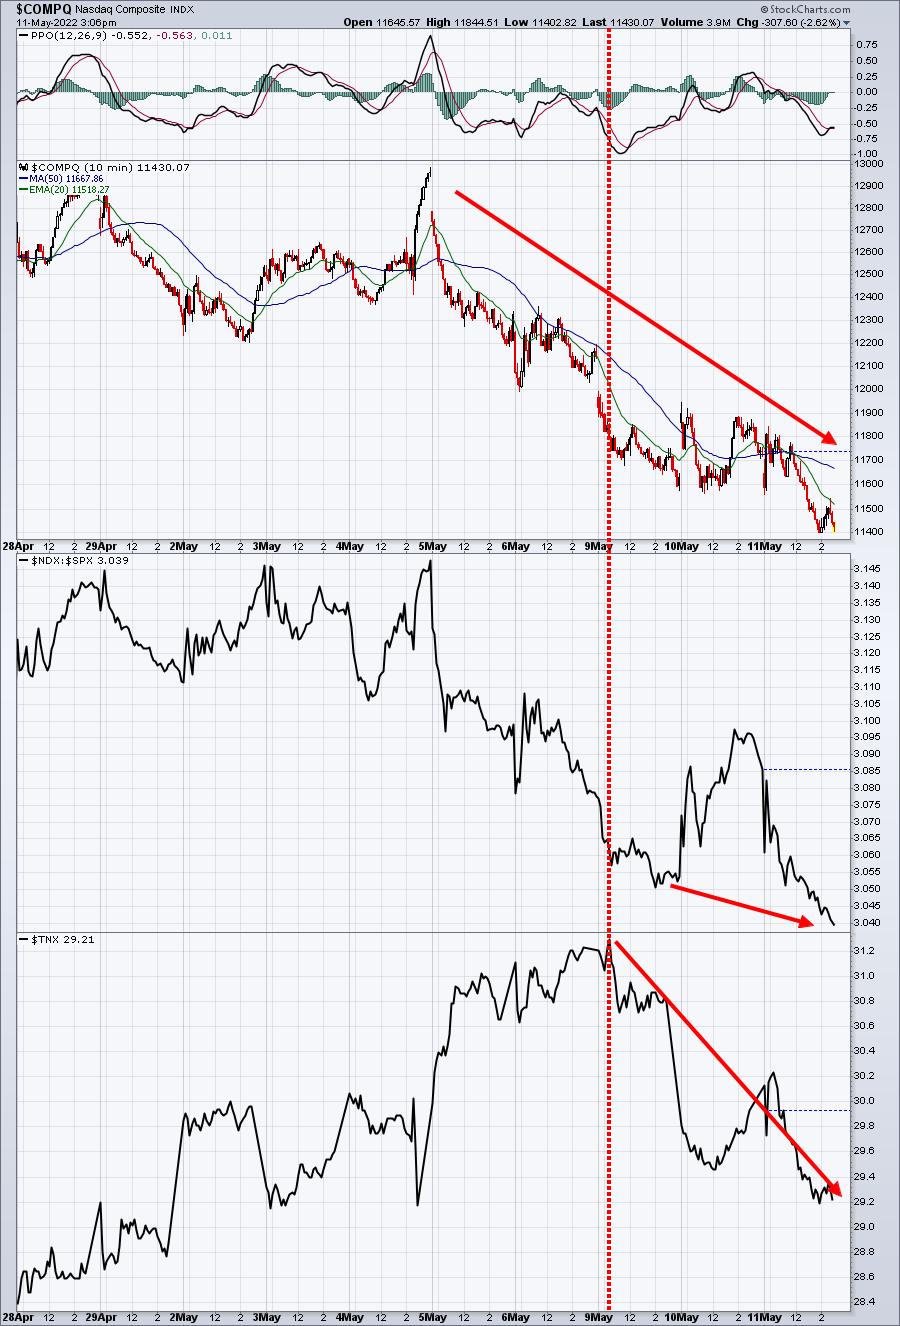
The NASDAQ's relative performance suffered when yields moved higher, so it stood to reason that dropping yields would benefit the NASDAQ on a relative basis. But the above chart shows that we can't trust much at this moment.
Bear markets, even the cyclical variety, are just brutal.
ChartLists/Strategies
Yesterday's bullish action faded quickly this morning, triggering sells of my QLD and a few other individual stocks including ABNB, DDOG, and TSLA. I'm just watching the action right now, despite the positive divergences on the hourly charts of our key indices.
It's worth noting that Apple, Inc. (AAPL) is breaking beneath its key price support level from its March 14th low. This definitely will not help the NASDAQ and S&P 500 as it's the most heavily-weighted component of each index. Here's the visual:
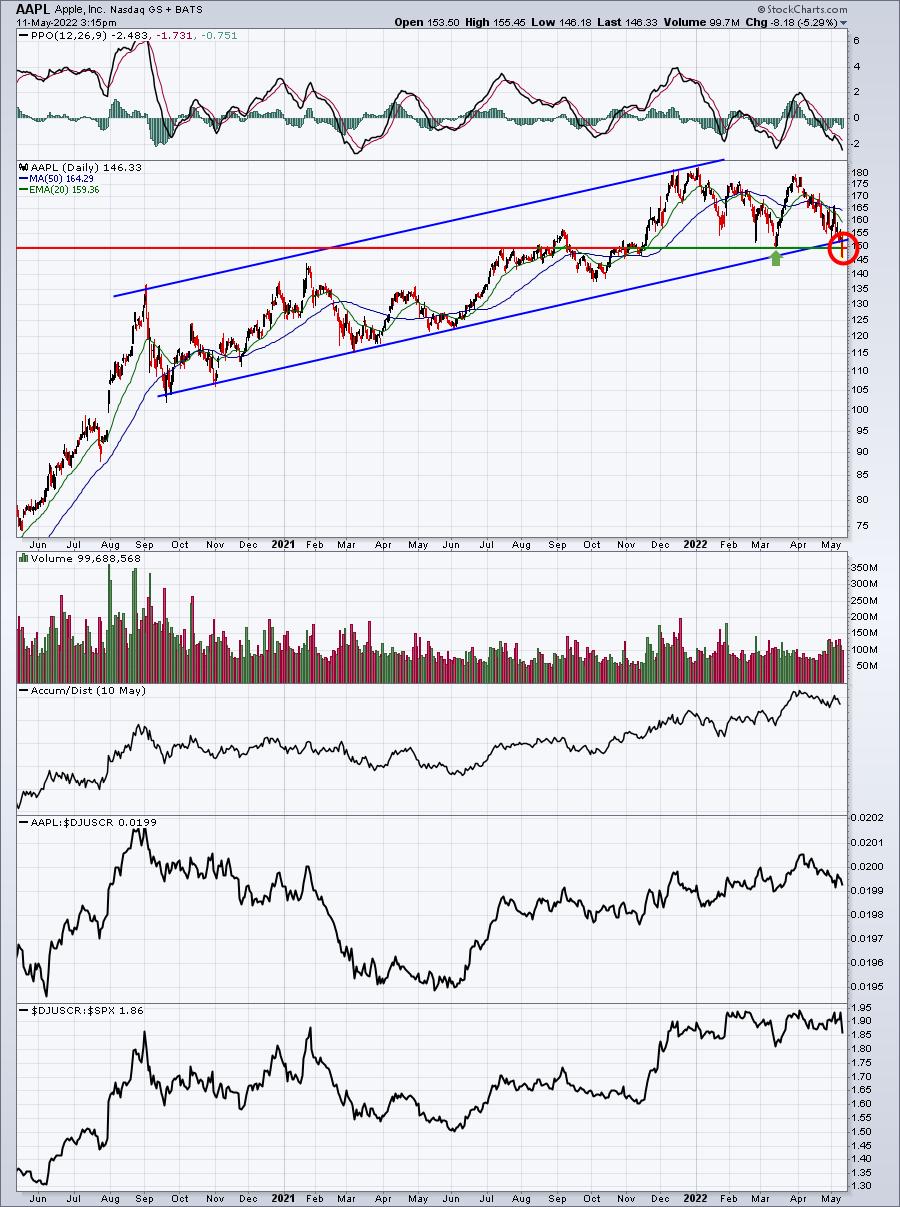
Barring a strong reversal, AAPL's breakdown will only add kerosene to the bearish flames of 2022.
Earnings Reports
Here are the key earnings reports for the next two days, featuring stocks with market caps of more than $10 billion. I also include several companies with market caps below $10 billion. Finally, any portfolio stocks that will be reporting results are highlighted in BOLD. If you decide to hold a stock into earnings, please understand the significant short-term risk that you are taking. Please be sure to check for earnings dates for any companies you own or are considering owning.
Wednesday, May 11:
TM, DIS, TAK, MFC, SLF, STE, RIVN, CPNG, APP, DOX, OLPX, PFGC, PAAS, PRGO, YETI, MQ, WEN, NOMD, SONO, BMBL, ZIP, DNUT, BYND, FVRR, WWW
Thursday, May 12:
BAM, MSI, EDR, NICE, RYAN, AQN, USFD, TPR, AFRM, HLI, CYBR, NEWR, LZ, SIX, UTZ, VZIO
Economic Reports
April CPI: +0.3% (actual) vs. +0.2% (estimate)
April Core CPI: +0.6% (actual) vs. +0.4% (estimate)
Happy trading!
Tom