
EB Daily Market Report - Thursday, May 12, 2022
Spring Special
Beginning Monday, we will be having our Spring Special, which provides our members their best opportunity to lock in savings! The longer you commit, the more you'll save!
Details will be forthcoming on Monday!
ChartLists Updated, Monthly Short & Seasonality Reports
I'm in the process of updating several ChartLists. Here are three where the updating process was completed this morning:
- Strong Earnings ChartList (SECL)
- Strong Future Earnings ChartList (SFECL)
- Short Squeeze ChartList (SSCL)
Later today or tomorrow, I should have the Raised Guidance ChartList (RGCL) updated. I will also be updating the Strong AD ChartList (SADCL) by this weekend as we'll need the updated version to prepare for next Thursday's Portfolio Draft.
The stock market has been extremely weak, which I think most everyone realizes by now. I have deliberately held off providing a monthly May Short Report or a monthly May Seasonality Report. In a market that's as bad as this one, short squeezes are very unlikely to occur as most heavily-shorted stocks are nowhere near the breakout levels required to trigger short squeezes. As for seasonality, it's a secondary indicator for me and our primary indications have been bearish throughout 2022. I personally use seasonality to confirm long positions that I am looking to take on. Right now, I'm remaining quite cautious. I do not use the seasonality information alone to make trading decisions. Both of these reports will be a standard part of our service when the cyclical bear market ends. I just wanted to provide this clarification in the event you were wondering why these reports have not been prepared in May. I will re-evaluate for June.
Executive Market Summary
- Futures were weak overnight and they grew weaker as we neared the opening bell
- Another key inflation report - April PPI - was released before the bell and inflation at the producer level was reported slightly better than expected
- After an initial gap lower, our major indices all rallied and opening rotation away from aggressive areas quickly reversed
- Selling appears to be intensifying over the past hour as I write this at noon eastern
- Consumer discretionary (XLY, +0.52%) is currently the best-performing sector, with communication services (XLC, -0.33%) not too far behind
- The other 9 sectors are lower, led by utilities (XLU, -1.82%) and technology (XLK, -1.78%)
- Computer hardware ($DJUSCR, -3.37%) is notably weak, likely due to the breakdown yesterday in Apple (AAPL, -3.58%)
- Cryptocurrencies remain under significant selling pressure with etherium ($ETHUSD) down 7.63%
- Despite all the recent volatility, gold ($GOLD, -1.07%) has not performed very well - somewhat surprising to me
- Crude oil ($WTIC, +0.76%) is slightly higher as is natural gas ($NATGAS, +0.46%)
Market Outlook
The market action just the past few days is indicative of why I choose to basically sit the market out when the Volatility Index ($VIX) is at elevated levels. You simply can't trust anything. In a low VIX environment, when the stock market is boringly ascending, I feel comfortable allowing my stock positions to do their thing. In this environment, the NASDAQ can vary 500-600 points in a day. Morning strength can evaporate and become an afternoon nightmare.
Two days ago, it looked like we were trying to carve out a significant short-term bottom. We fell to new lows. Today, we're trying to move higher again. There's nothing guaranteeing that we move higher in the short-term, but the positive divergences that I wrote about yesterday certainly add support to that notion. For now, I'd look for much more selling if the hourly charts show a 50-hour SMA test or a PPO centerline test. Here's what that looks like currently on the S&P 500 chart:
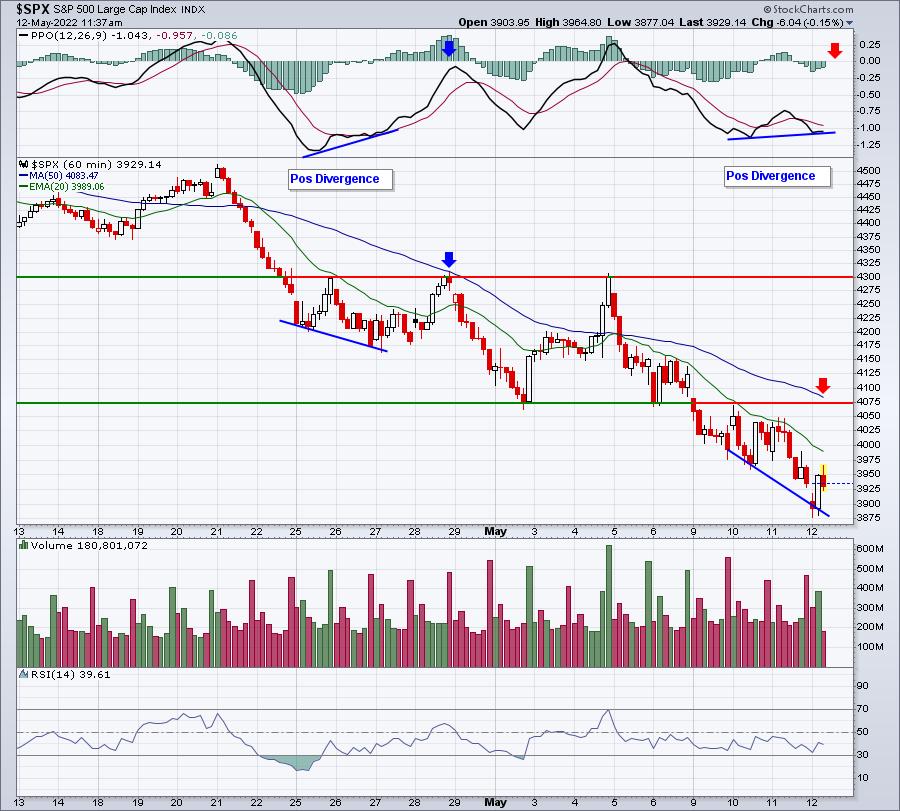
I marked the 50-hour SMA (potential) test with a red arrow. Note that key short-term price resistance is nearby at 4075. I'd expect to see that area of resistance hold IF the S&P 500 strengthens further later today and/or tomorrow.
Sector/Industry Focus
Consumer discretionary (XLY) got off to a very rough start this morning as one of its key components, Tesla (TSLA) challenged price support at 700. Take a look at both charts:
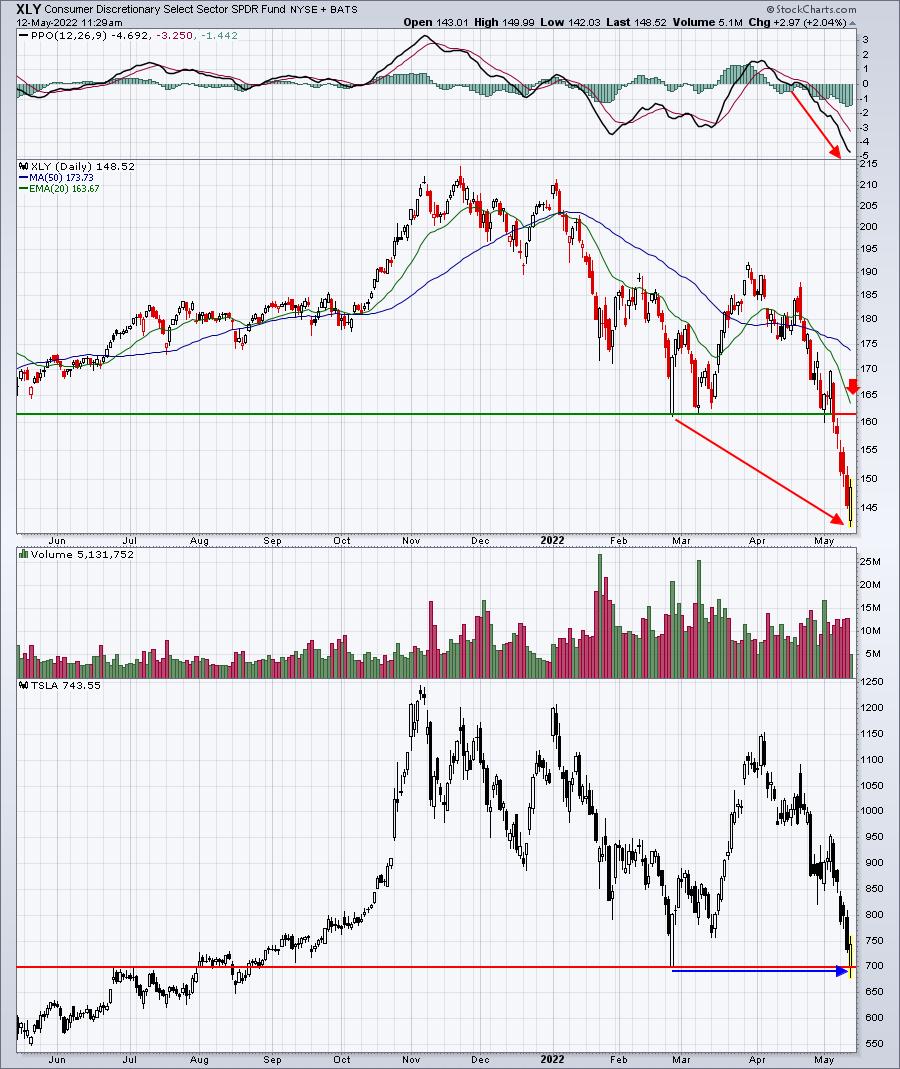
There are a couple of important points to make here. First, TSLA is the largest component (20.06%) of the XLY according to Fidelity. Amazon.com (AMZN) is a close second at 19.89%. So these two stocks represent 40% of the XLY. But TSLA has been a leader in the group. The above chart shows the XLY currently dropping well below the late-February low, while TSLA is just now testing that low. Clearly, TSLA is holding up the XLY. Therefore, it stands to reason that if TSLA fails to hold 700 price support, the XLY will likely tumble further. That would be very bad for both the S&P 500 and NASDAQ as the top holding in both indices is Apple, Inc. (AAPL), which I showed yesterday had just broken down. AAPL and TSLA have been two of the best performers among the highly-weighted technology (XLK) and discretionary stocks.
ChartLists/Strategies
I would only trade this market if I could find trading candidates that were at or very close to key price support. If they bounce, I'd take profits fairly quickly. If they don't, I'd have a stop to take me out of the position with minor losses. Here are two that I believe fit this "tight stop" strategy:
QCOM:
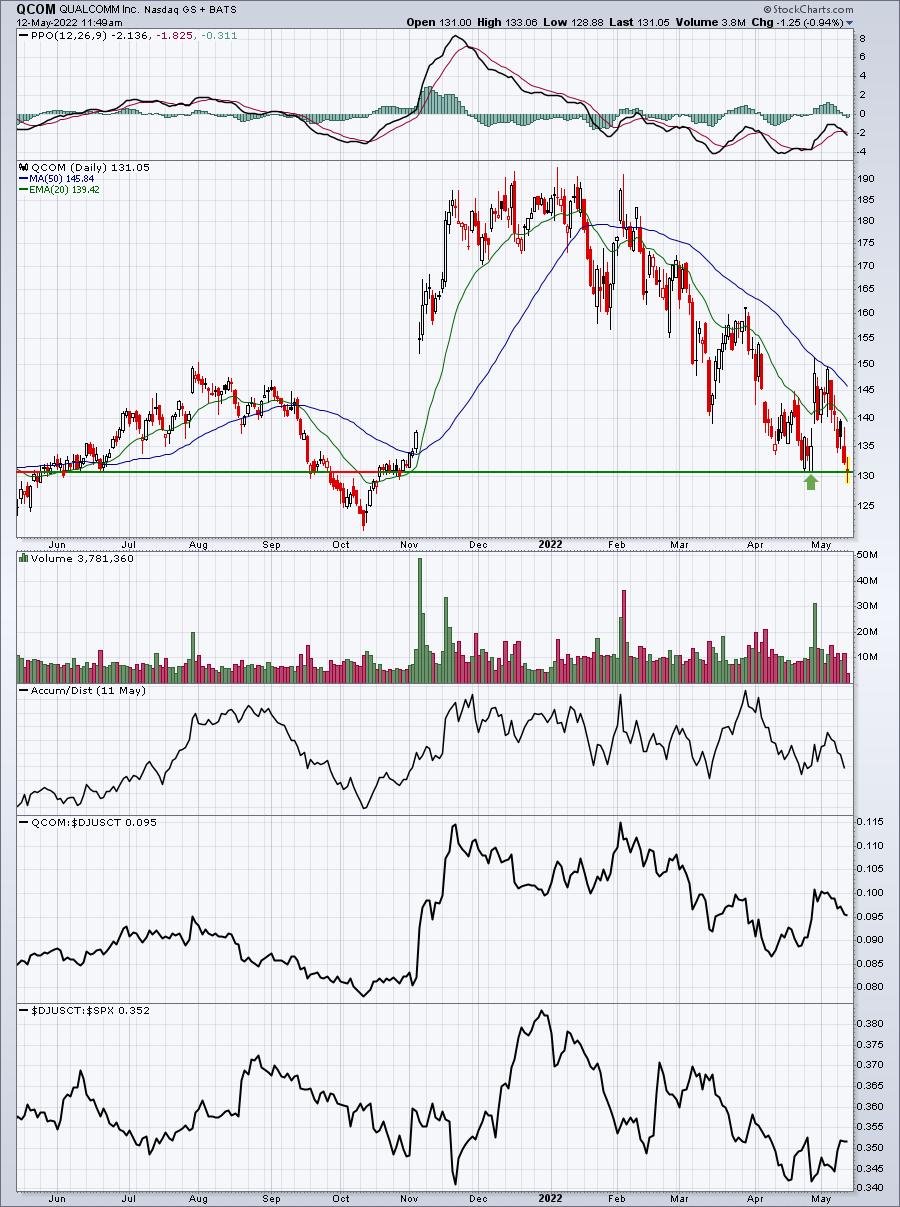
130.81 is closing support. Today's low of 128.88 is intraday support. Violation of either of these two and I'd be gone. I want to be clear, however. I do not own a position in QCOM, I just simply find it interesting at support. I don't believe the market has reached its ultimate bottom, so I'd rather remain in cash.
WH:
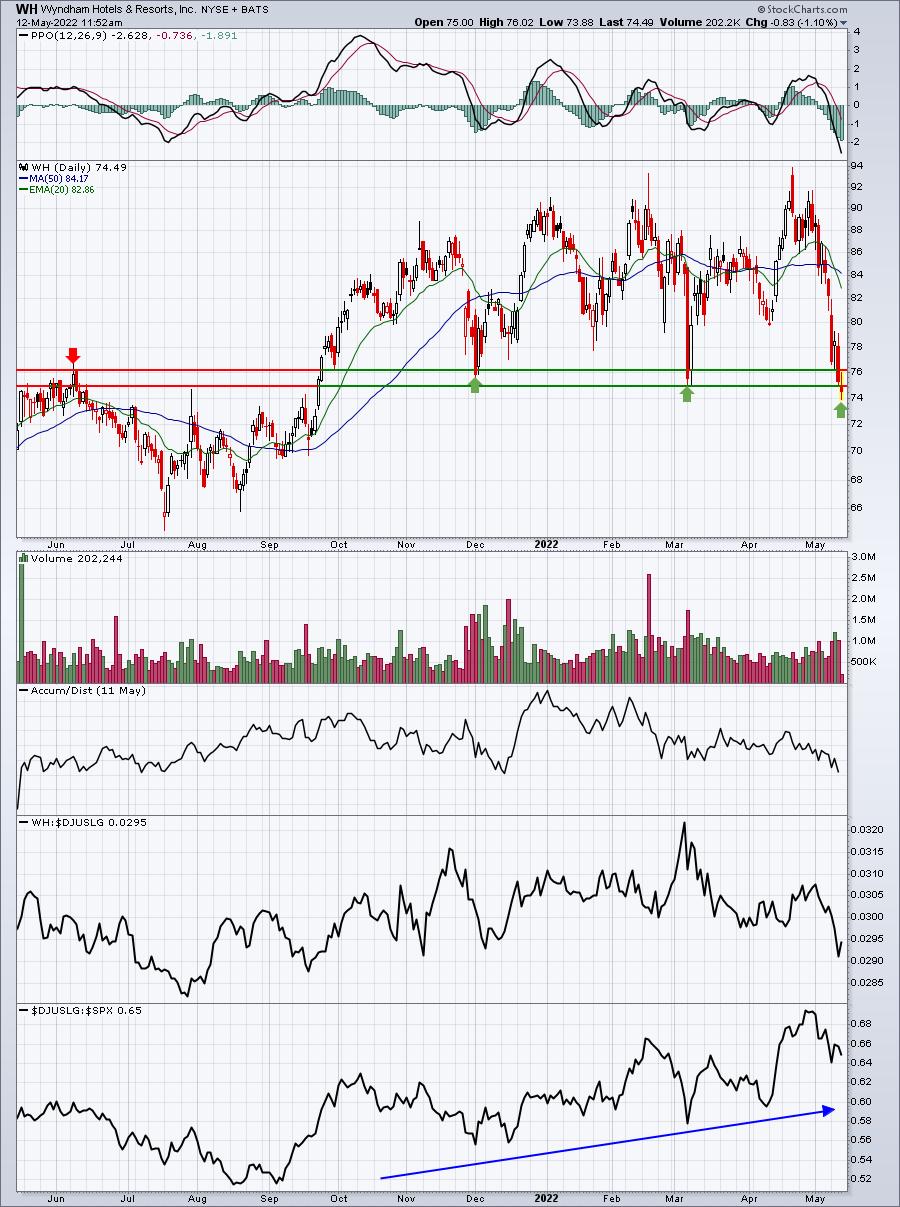
The interesting part here is that WH is part of an industry group - hotels ($DJUSLG) - that's been uptrending relative to the S&P 500 all year. I'd trust a kick save on a stock from an outperforming industry group before I would a stock from an underperforming group. Currently, WH appears to be breaking down, so I'd only consider it if it strengthens into the close. Today's low of 73.88 would be my intraday stop and I'd need to see WH close today above its open at 75.00.
Earnings Reports
Here are the key earnings reports for the next two days, featuring stocks with market caps of more than $10 billion. I also include several companies with market caps below $10 billion. Finally, any portfolio stocks that will be reporting results are highlighted in BOLD. If you decide to hold a stock into earnings, please understand the significant short-term risk that you are taking. Please be sure to check for earnings dates for any companies you own or are considering owning.
Thursday, May 12:
BAM, MSI, EDR, NICE, RYAN, AQN, USFD, TPR, AFRM, HLI, CYBR, NEWR, LZ, SIX, UTZ, VZIO
Friday, May 13:
None
Economic Reports
Initial jobless claims: 203,000 (actual) vs. 190,000 (estimate)
April PPI: +0.5% (actual) vs. +0.5% (estimate)
April Core PPI: +0.4% (actual) vs. +0.6% (estimate)
Happy trading!
Tom