
EB Daily Market Report - Tuesday, May 17, 2022
Spring Special Has BEGUN!
Our Spring Special is underway, which provides all of our members their best opportunity to lock in savings! The longer you commit, the more you'll save!
For more information, CLICK HERE.
ChartList Update and Max Pain Event
The Strong Earnings ChartList (SECL) and Strong Future Earnings ChartList (SFECL) have both been updated and are available for viewing/download from our website.
At 4:30pm ET, I'll be hosting our monthly Max Pain webinar, which should be VERY interesting given the recent downtrend. You can join the webinar by clicking on the link below after 4:00pm ET this afternoon:
https://earningsbeats.zoom.us/j/81534162912
We record all of our events, so no worries if you can't make it live. We'll make sure you have access to the recording soon after the event is completed.
Executive Market Summary
- Futures were solidly green overnight
- Commodities are mostly higher with crude oil ($WTIC, +0.68%) hitting $115 per barrel
- The 10-year treasury yield ($TNX) is up 6 basis points to 2.94%, despite a very disappointing housing report this morning
- Home construction ($DJUSHB, +0.22%) is clinging to a slight gain after dropping more than 2% from its early morning high
- Consumer discretionary (XLY, +0.31%) has completely reversed after a very strong start to the day - more on this below
- Intraday rotation is once again shifting towards defensive areas - a bearish signal
- Take-Two Interactive Software (TTWO, +8.43%) is a top-performing S&P 500 company after delivering quarterly results that topped expectations
- Walmart (WMT, -8.30%) is the worst-performing S&P 500 company after posting results that fell short of expectations
Market Outlook
The rotation to defensive areas hasn't stopped. That makes me lean towards further deterioration in the market this summer. A year from now, I believe purchases in our key indices today will look very nice, but I certainly cannot guarantee that we don't decline further in the near-term. In fact, at the beginning of the year, I gave my "worst case scenario" and suggested the S&P 500 could tumble to 3500. We're just a little more than 10% from that level now.
This morning's action is just one example of the bearish rotation that I've been discussing. Let's look at the sector leaderboard first:
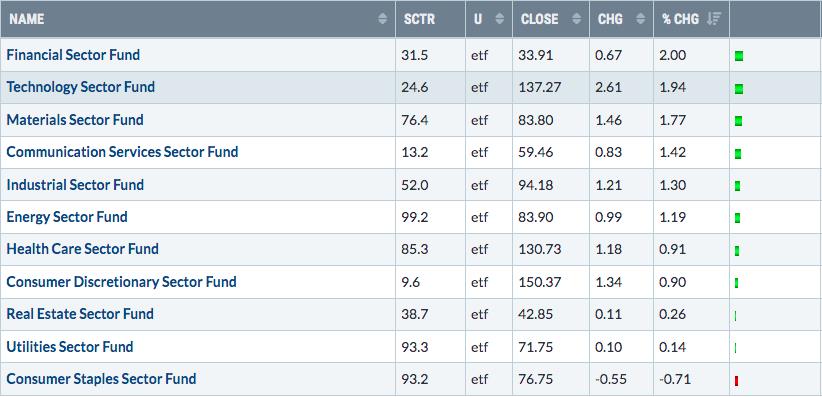
That looks pretty good, doesn't it? The aggressive groups are leading and the defensive groups are lagging. What could possibly be bad about that? Well, the bullish disparity was AWESOME at the opening bell, but the action AFTER the opening bell has been horrific. Look at this chart:
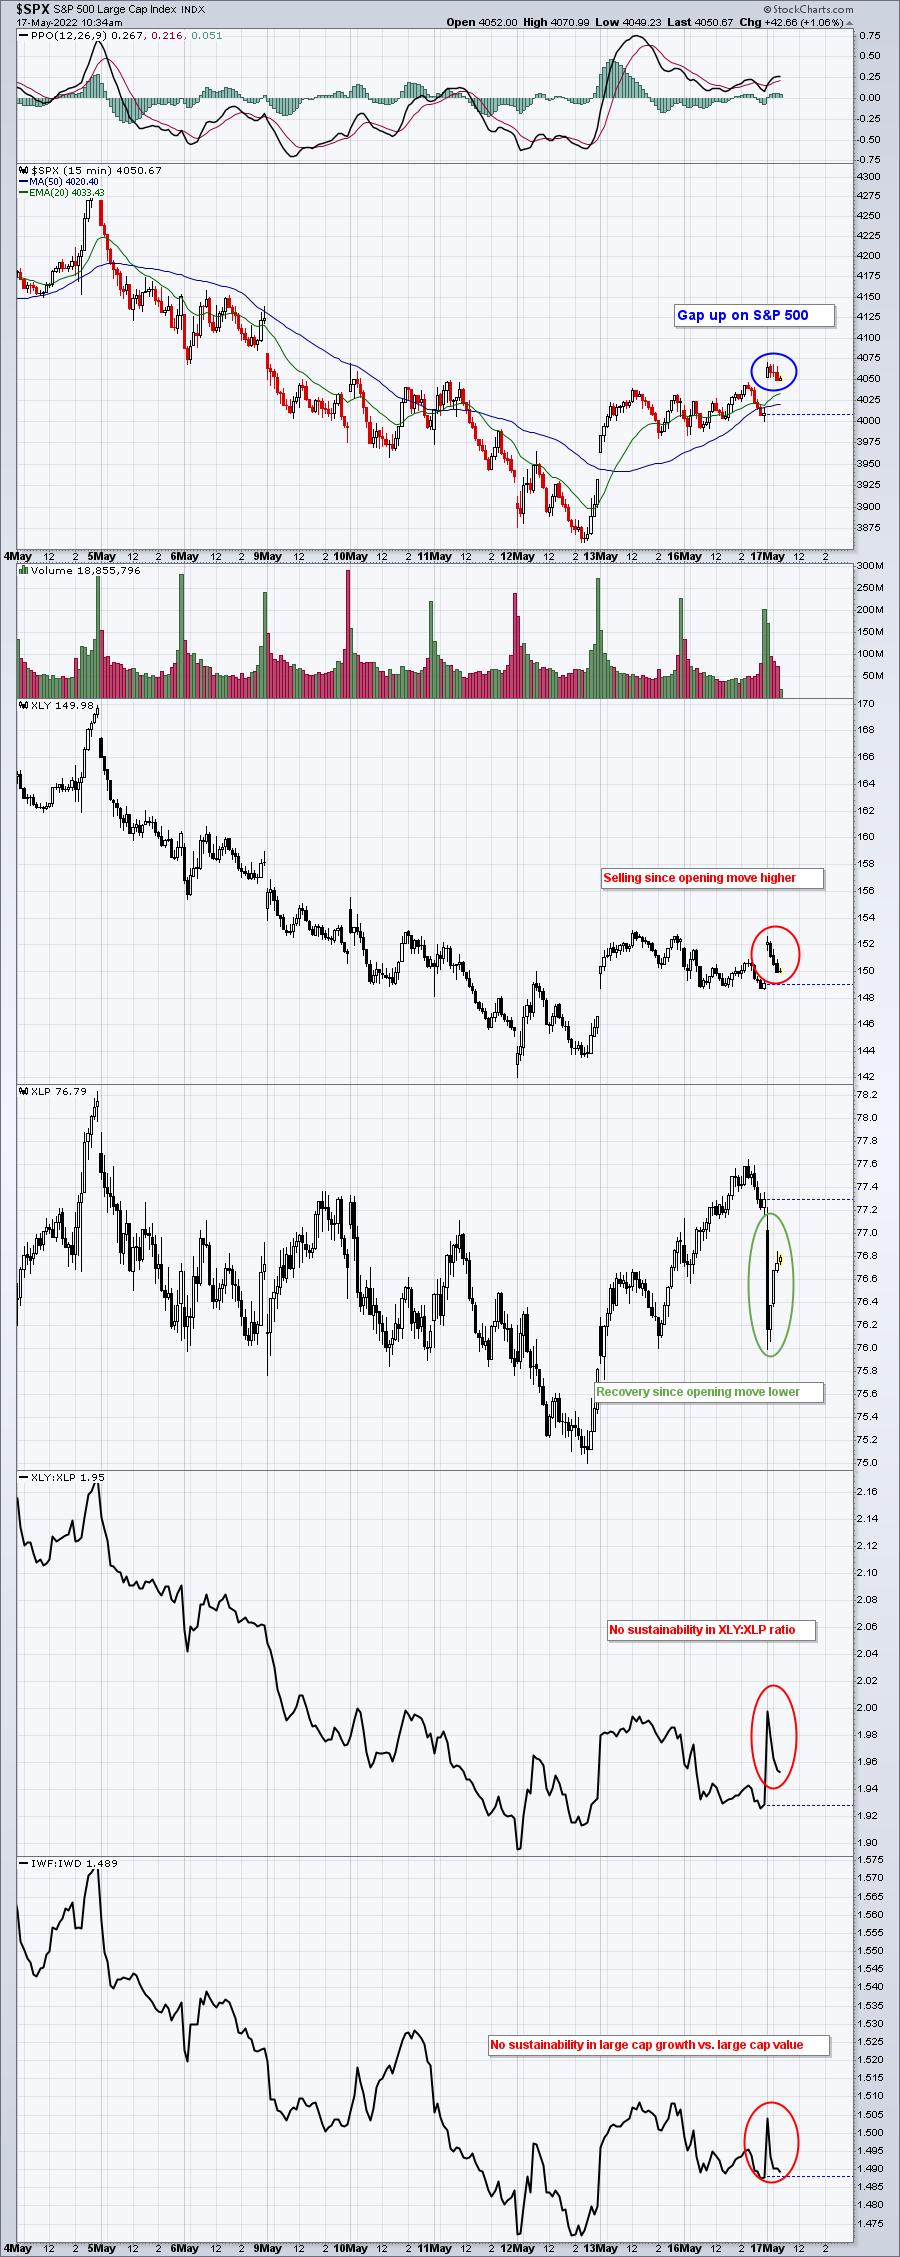
So while the upward movement this morning is good for options expiration to help cancel out some of the in-the-money puts, we're doing nothing today to convince me that we should be buying for the long-term. I think it's fine to buy now as part of a strategy to add periodically on weakness, but from a trading perspective, I'd remain extremely cautious and book profits when you have them.
Sector/Industry Focus
Home construction ($DJUSHB) just received another disappointing economic report this morning when the housing market index came in at 69. Last month's reading of 77 was expected to decline further to 75 for May. Suddenly surging mortgage rates clearly are having an impact on the group, which has shown relative weakness throughout 2022:
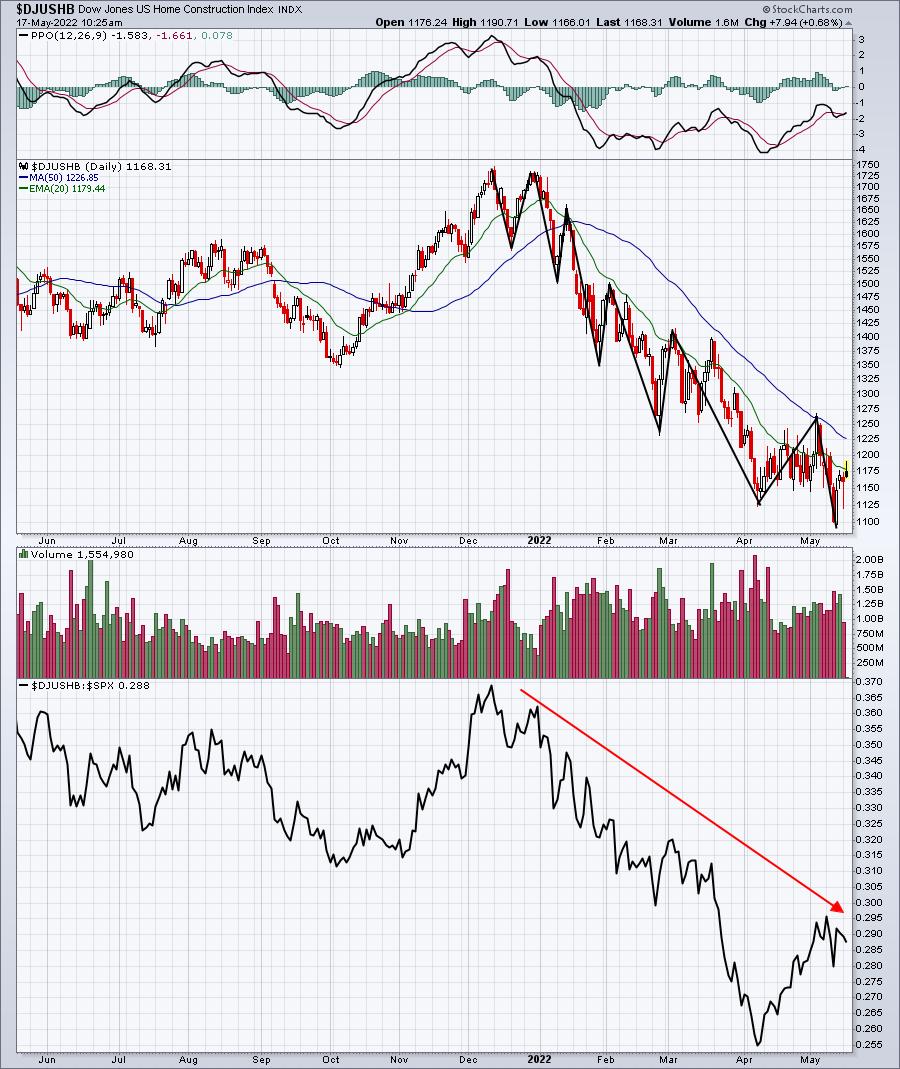
A downtrend is defined as a series of lower highs and lower lows, which is illustrated on the chart above. An uptrend CANNOT begin until this series is broken.
ChartLists/Strategies
I'm looking for a continued rally this week based on my analysis of "max pain". For our newer members, this is a short-term phenomenon that typically plays out over just a few days. Many times, there is financial incentive for market makers to use their own capital to "direct" prices in a certain direction for a brief period. I'll discuss this much more fully this afternoon in our monthly Max Pain webinar that begins at 4:30pm ET.
Earnings Reports
Here are the key earnings reports for the next two days, featuring stocks with market caps of more than $10 billion. I also include several companies with market caps below $10 billion. Finally, any portfolio stocks that will be reporting results are highlighted in BOLD. If you decide to hold a stock into earnings, please understand the significant short-term risk that you are taking. Please be sure to check for earnings dates for any companies you own or are considering owning.
Tuesday, May 17:
WMT, HD, JD, SE, KEYS, ONON, AER, DOCS, IHS, JBI, NXGN
Wednesday, May 18:
CSCO, LOW, TGT, ADI, TJX, SNPS, CPRT, BBWI, DT, ZIM, GDS, TGI
Economic Reports
April retail sales: +0.9% (actual) vs. +0.8% (estimate)
April retail sales less autos: +0.6% (actual) vs. +0.4% (estimate)
April industrial production: +1.1% (actual) vs. +0.4% (estimate)
April capacity utilization: +0.8% (actual) vs. +0.3% (estimate)
March business inventories: +1.8% (estimate)
May housing market index: 69 (actual) vs. 75 (estimate)
Happy trading!
Tom