
EB Daily Market Report - Tuesday, May 31, 2022
Spring Special - EXTENDED ONE DAY
Our Spring Special ended yesterday, but we decided to extend it one more day - through midnight tonight. This is absolutely the FINAL day, so LOCK IN the best price of year NOW! You can CLICK HERE for more details.
ChartLists Updated
I have updated the following ChartLists and they are available for download/viewing on our website:
- Strong Earnings ChartList (SECL)
- Strong Future Earnings ChartList (SFECL)
I should have a few more updated ChartLists tomorrow, so be sure to check back in!
Executive Market Summary
- Futures were slightly lower overnight and we started the day with slight gaps down
- A resumption of last week's rally has taken place slowly throughout the session and our major indices are just breaking into positive territory
- Consumer discretionary (XLY, +1.37%) is the primary reason for today's strength, adding onto last week's impressive gain
- Broadline retailers ($DJUSRB, +4.17%) are very strong, thanks at least in part to Amazon.com (AMZN, +5.35%), which is trading back above its 20-day EMA
- Defensive groups are lagging as health care (XLV, -1.01%), real estate (XLRE, -0.83%), and utilities (XLU, -0.78%) are the worst three sectors on the day
- The 10-year treasury yield ($TNX) is up more than 10 basis points to 2.85% after seeing a PPO centerline "reset" and 50-day SMA test last week
- Cryptocurrencies are adding to their gains from late last week as bitcoin ($BTCUSD, +4.72%) moves back above 32000
- Crude oil ($WTIC, +0.64%) closed on Friday just above $115 per barrel, its highest level since late March; it's tacking on a bit more today
- Nike (NKE, +2.87%) leads the Dow Jones component stocks, while Salesforce.com (CRM, -0.90%) gets set to report its latest quarterly results after the bell
Market Outlook
Money flow should help to keep this rally in force in the very near-term. Historically, the first few days of a calendar month tend to be extremely bullish. As I recently indicated in the Historical Trends webinar, the 26th to 6th period of ALL calendar months has been responsible for 80% of all S&P 500 gains since 1950. If the market is going to rally, this is the period of the month when it typically occurs. Here's the S&P 500, with key sustainability ratios provided in the panels below:
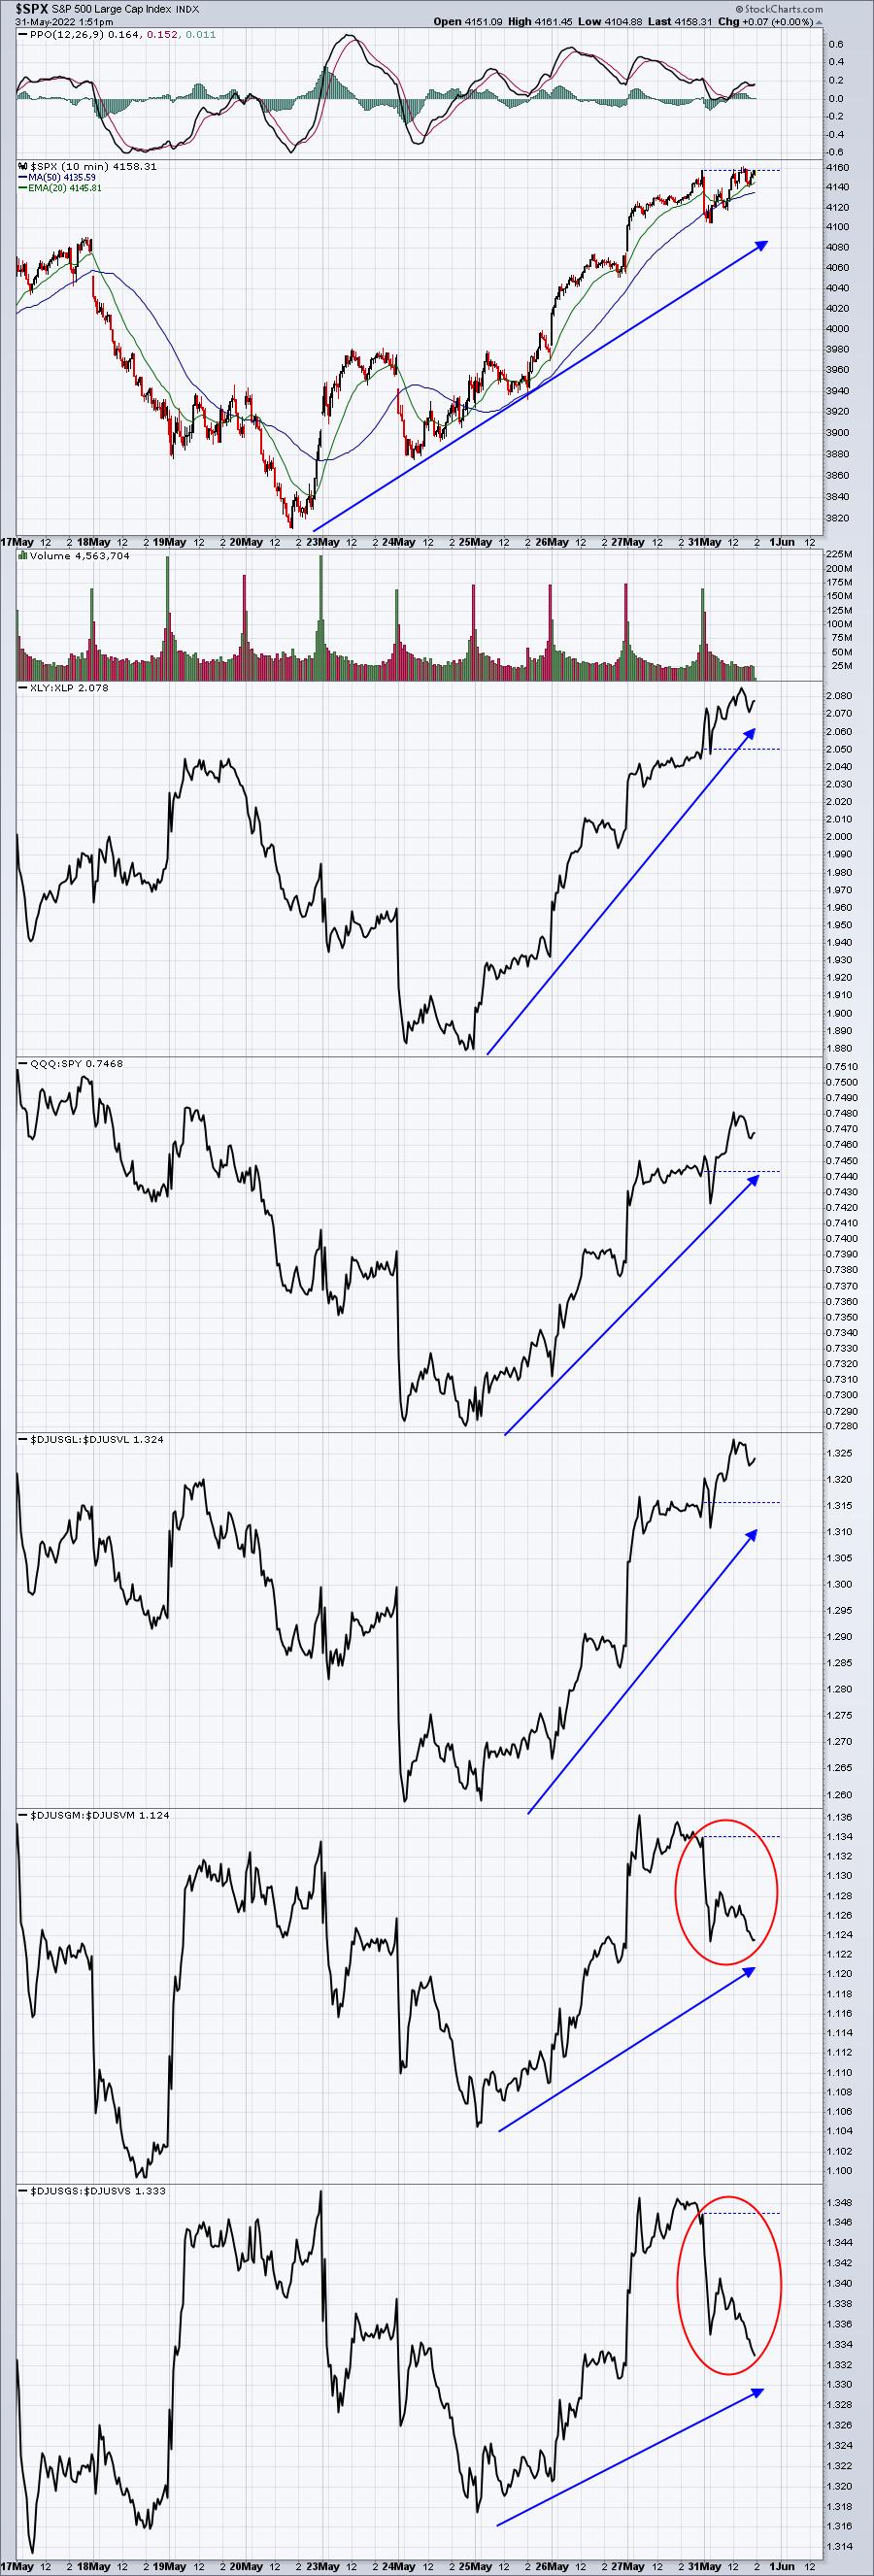
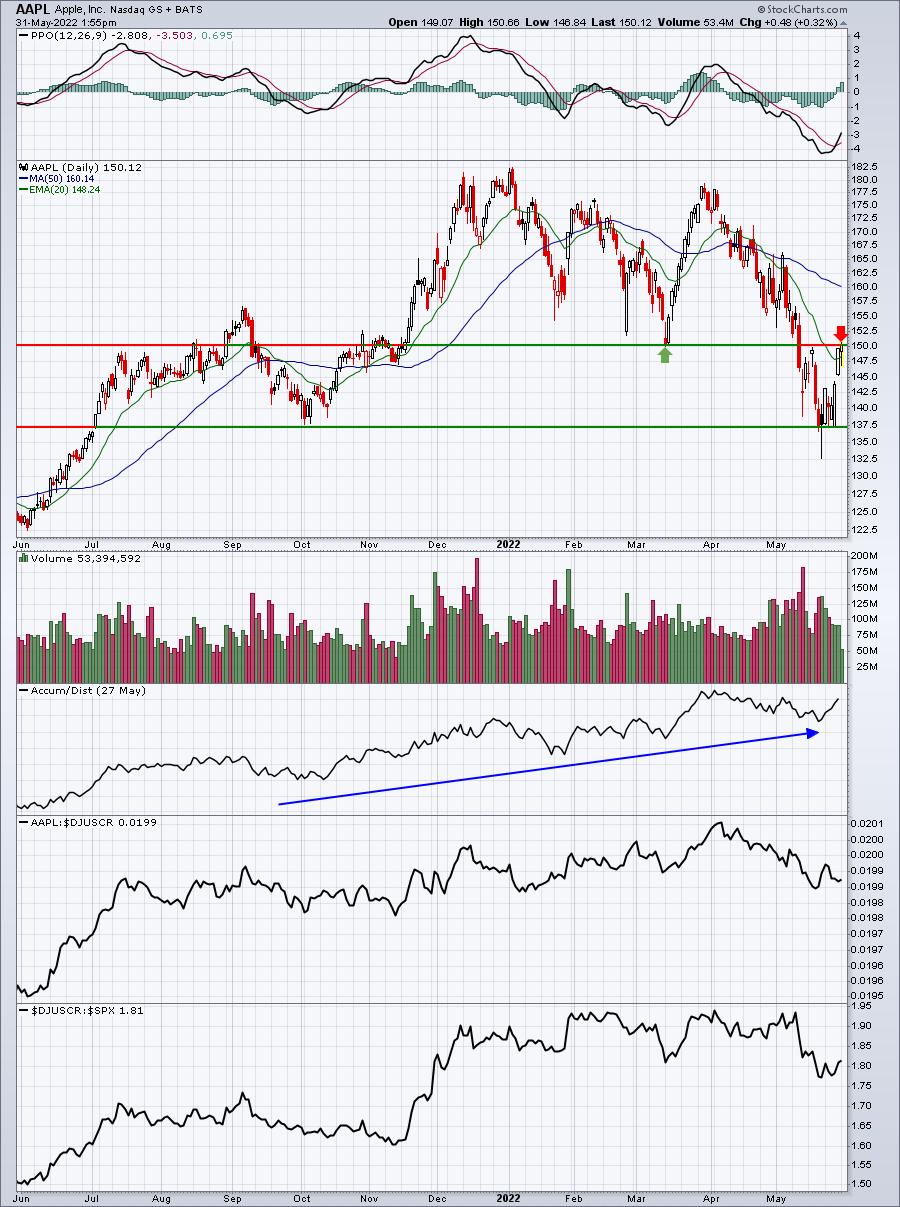
The bottom two panels, highlighting mid-cap and small-cap growth stocks vs. value, are already beginning to show some wear and tear. The overall uptrends remain ok, but it's difficult to deny today's weakness in both of these charts. The good news is that, so far, both the XLY:XLP and QQQ:SPY ratios are rising with the S&P 500. That's due to one simple fact. Large cap growth stocks continue to perform well. One very important chart to watch, however, will be Apple (AAPL), which has rebounded to test key overhead price resistance. If it fails and begins to roll over, that could be it for this market rally. Here's the AAPL chart, illustrating this price resistance:
Sector/Industry Focus
Automobiles ($DJUSAU) rank as the best-performing industry group over the past week as Tesla (TSLA) has rebounded nicely. Both the index and TSLA are trying to clear their 20-day EMAs for the first time in five weeks:
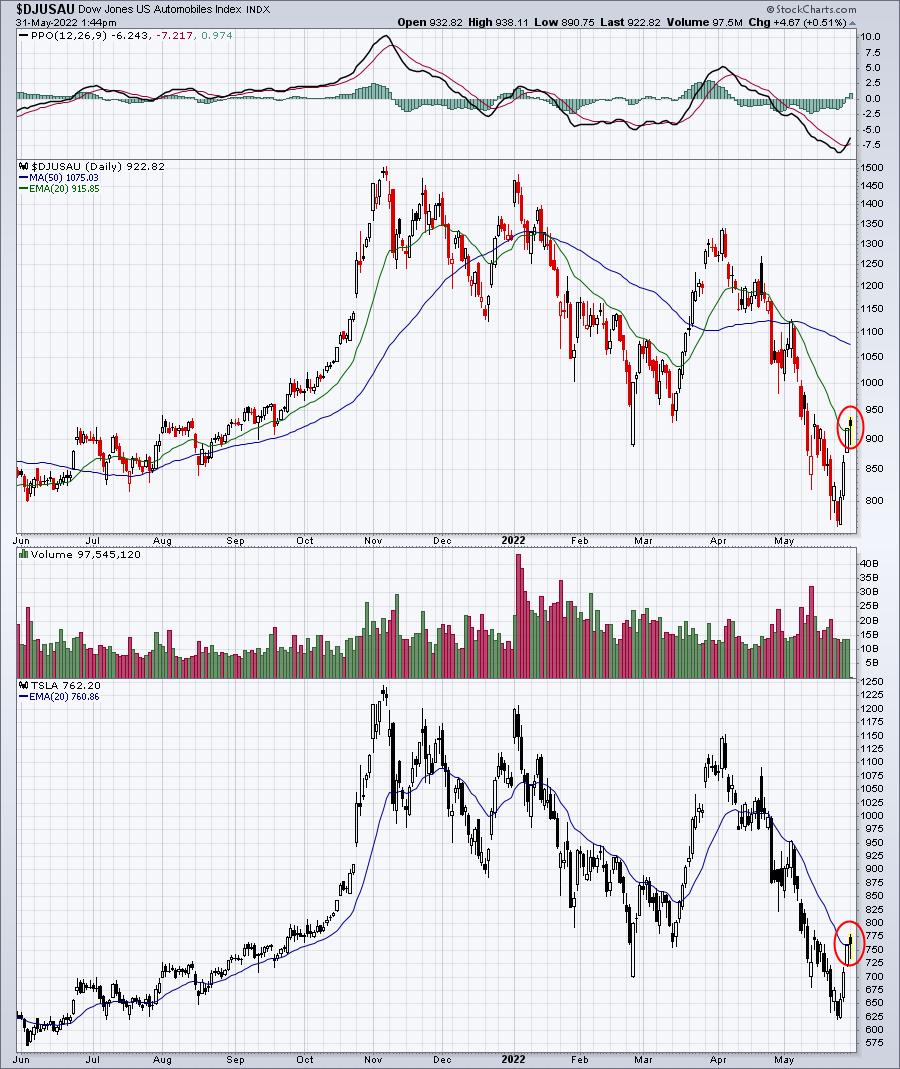
We're still seeing higher daily highs and higher daily lows on both charts, so the short-term uptrend remains in play until that changes. A break above the 20-day EMAs could lead to 50-day SMA tests, though I suspect they won't make it that far - unless the overall market bottom is in.
ChartLists/Strategies
Every week we update the Upcoming Earnings ChartLists. We have a daily ChartList that summarizes all the companies that will be reporting since the last market close. So, for instance, we have an Upcoming Earnings ChartList that covers all the companies that will report earnings today AFTER the closing bell PLUS tomorrow BEFORE the opening bell. That way, you can track all the companies tomorrow that reported either today after the close or tomorrow before the bell. It's a concise, organized way of reviewing the market's reaction to every key earnings report.
In addition, we have an Upcoming Earnings - Relative Strength ChartList that shows the relative strength of every company reporting earnings this week. Using the "Summary" page, we can quickly see which companies are being favored by Wall Street as they speed towards earnings. I like to pull this ChartList up in Summary form based on 1-month relative performance (relative to their industry peers). Here's what this week's top relative performers look like:
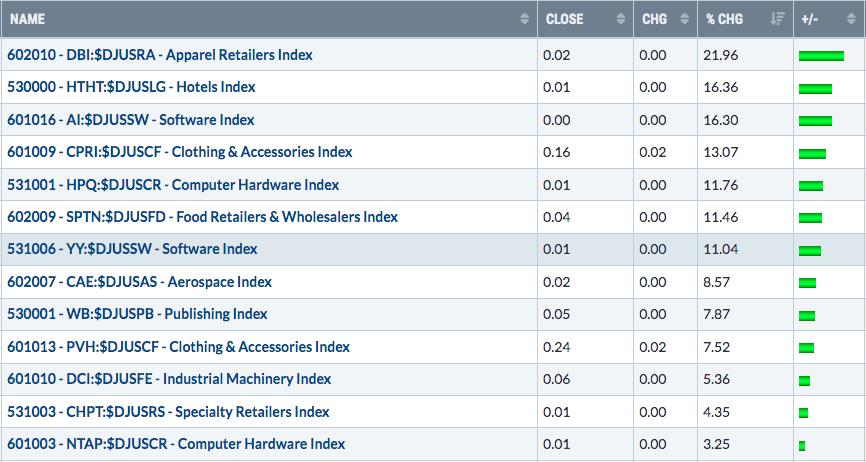
This is the Top 13 (baker's dozen) of the 40 key companies set to report quarterly results this week. Note that one of our portfolio stocks - HPQ - ranks 5th on this list. We'll see if that leads to a strong report and a strong reaction. HPQ reports its results after the close today.
Earnings Reports
Here are the key earnings reports for the next two days, featuring stocks with market caps of more than $10 billion. I also include several companies with market caps below $10 billion. Finally, any portfolio stocks that will be reporting results are highlighted in BOLD. If you decide to hold a stock into earnings, please understand the significant short-term risk that you are taking. Please be sure to check for earnings dates for any companies you own or are considering owning.
Tuesday, May 31, 2022:
CRM, HPQ, BEKE, CHPT, VSCO, AMBA, APPS
Wednesday, June 1, 2022:
VEEV, HPE, MDB, NTAP, CHWY, GME, PATH, S, PSTG, CPRI, DCI, ESTC, WB, PVH, SMTC, NCNO, AI
Economic Reports
March Case-Shiller home price index: +2.4% (actual) vs. +2.2% (estimate)
March FHFA house price index: +1.5% (actual) vs. +1.9% (estimate)
May Chicago PMI: 60.3 (actual) vs. 57.1 (estimate)
May consumer confidence: 106.4 (actual) vs. 104.0 (estimate)
Happy trading!
Tom