
EB Daily Market Report - Friday, June 3, 2022
Executive Market Summary
- Futures were weak overnight and the weakness accelerated after the May nonfarm payrolls number came in better than expected
- Cryptocurrencies are having another poor session as bitcoin ($BTCUSD, -2.60%) drops back below 30000
- Crude oil ($WTIC, +2.00%) closed near $117 per barrel on Thursday, eclipsing recent resistance at $115; it's tacking on more today as it approaches $120 per barrel
- Energy (XLE, +0.83%) is the only sector in positive territory today; consumer discretionary (XLY, -2.97%) has taken a familiar position at the bottom of the sector leaderboard
- Tesla (TSLA, -8.69%) is weighing on automobiles ($DJUSAU, -7.73%) and the XLY after CEO Elon Musk announced a workforce reduction
- The 10-year treasury yield ($TNX) has jumped 5 basis points to 2.96% on the heels of the May jobs report
- Northrop Grumman (NOC, +1.96%) leads the S&P 500; it tested its March 7th closing high before backing off in the past 90 minutes - a close over 477 would be bullish
Market Outlook
Isn't the stock market an interesting creature? Yesterday, the ADP employment report showed jobs came up short of expectations and we had a trend day - where prices move in one direction (higher in this case) all day long. It was a very bullish look. Today, we see the May nonfarm payrolls come in BETTER than expected, and the market can't catch a bid. It's the main reason why I always go back to those BIG picture charts to keep myself grounded. I also avoid the media and all of its preposterous headlines. In the big picture, I see us bottoming very soon. It's possible the May low was it. Obviously, we have to remain cautious, because there's a reasonable chance we do make new lows over the summer. The key, however, will be to watch those "under the surface" signals - most notably intermarket relationships and sentiment. In the very near-term, though, let's watch key 20-day EMA tests. If the market has bottomed and we've begun an uptrend, the now-rising 20-day EMAs should offer us big support. On the NASDAQ, we're testing that key moving average right now:
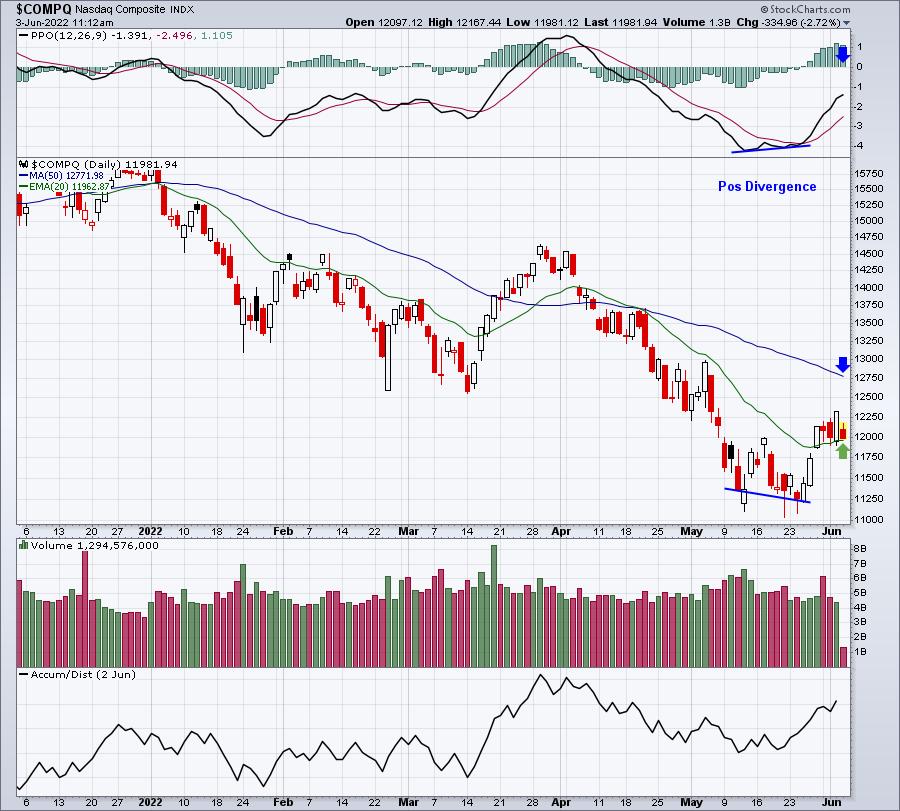
You might wonder why I've drawn that blue line the way I have. Remember that PPOs (and MACDs, if you prefer that momentum indicator) are based on CLOSING prices. The blue line in the price chart connects one low close to the next. Hollow candles have candle bodies with OPENs as the bottom of the rectangular body. I don't connect those, only closes.
The positive divergence doesn't guarantee us anything, it simply provides us technical evidence of slowing price momentum and a possible move up to the 50-day SMA and/or a PPO centerline "reset". If we do make that move higher, we'll "likely" hold the 20-day EMA. Let's see how that unfolds today.
Sector/Industry Focus
Rather than look at a sector or industry, let's look at updated sentiment - in the form of the equity only put call ratio ($CPCE). If you recall from the beginning of the year, I was looking for the market to drop and bullish sentiment (low 253-day average CPCE readings) to move much higher and turn the market much more bearish. Bearish sentiment is what helps mark MAJOR stock market bottoms. At the beginning of the year, this 253-day (1 year) SMA of the CPCE was at an extreme low and just beginning to turn higher. Bearishness has been increasing all year, as evidenced by the following chart:
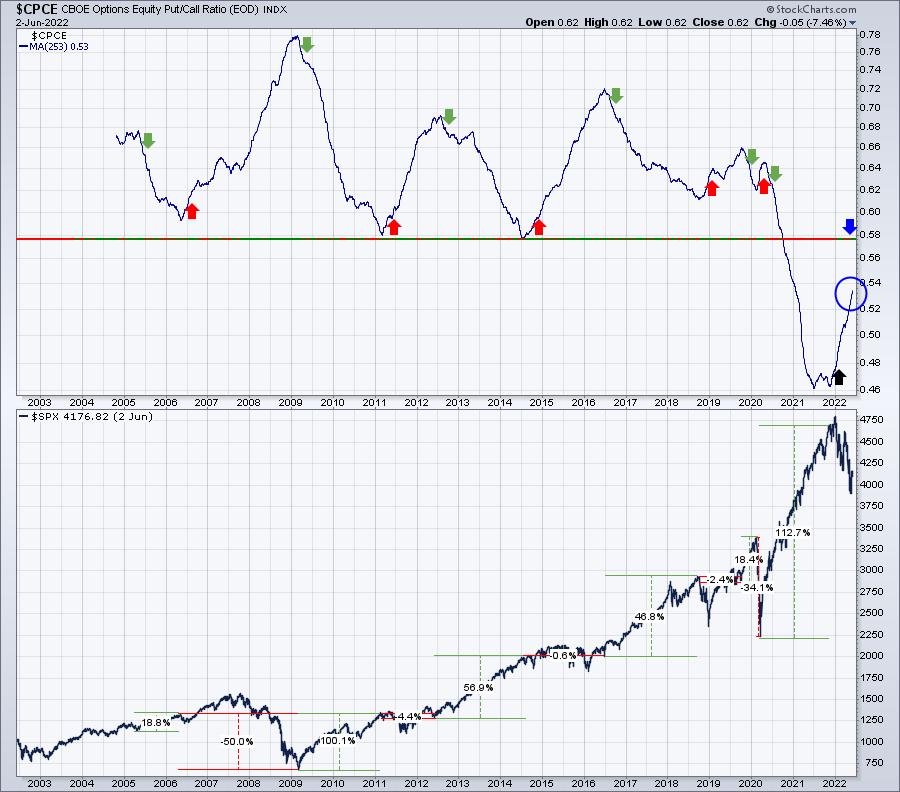
The black arrow is where this 253-day moving average was at our MarketVision 2022 event on January 8th. You can see the progress that has been made in "resetting" sentiment. If we do have another leg lower and we see the S&P 500 clear recent price support just above 3800, I believe we could see this moving average reach .58. When this moving average begins to roll over, we'll want to be VERY LONG this market.
If we look at this sentiment reading on a short-term basis (5-day SMA), you can see that the recent uptrend has taken a toll. The 5-day SMA of the CPCE has been dropping to a multi-week low and that could be problematic:
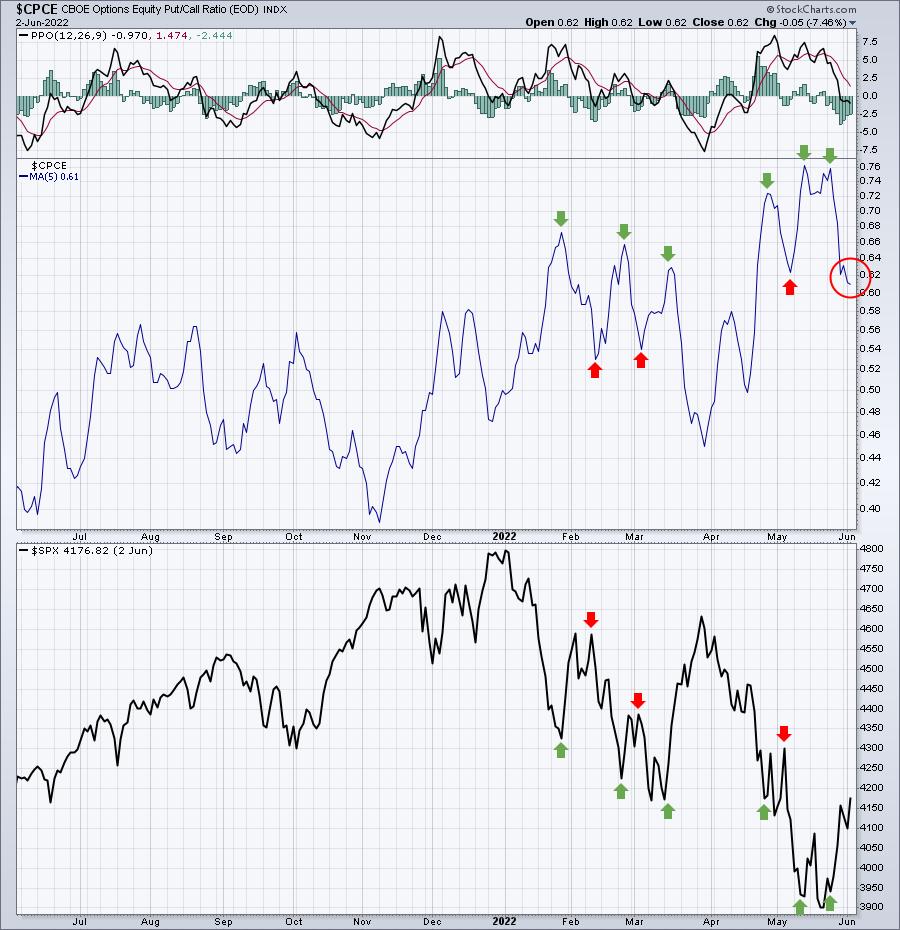
The green arrows mark tops in the 5-day SMA and also bottoms (roughly) in the S&P 500. When the CPCE moving average bottoms, though, and fear begins to build again, that coincides with S&P 500 tops. Therefore, we want to watch this closely. If the CPCE starts moving higher AND the S&P 500 and NASDAQ lose key 20-day EMA support, that would definitely be a short-term signal to grow more cautious again and let the selling play out.
ChartLists/Strategies
We've seen mostly selling since the opening bell. The market is digesting a couple of key jobs reports from the past two days and I want to see how we finish before considering more trades. I plan to take it easy into the weekend, especially since the "magic" of the first week of the calendar month comes to an end.
Earnings Reports
Here are the key earnings reports for the next two days, featuring stocks with market caps of more than $10 billion. I also include several companies with market caps below $10 billion. Finally, any portfolio stocks that will be reporting results are highlighted in BOLD. If you decide to hold a stock into earnings, please understand the significant short-term risk that you are taking. Please be sure to check for earnings dates for any companies you own or are considering owning.
Friday, June 3:
DOOO
Monday, June 6:
HQY, COUP
Economic Reports
May nonfarm payrolls: 390,000 (actual) vs. 325,000 (estimate)
May private payrolls: 333,000 (actual) vs. 310,000 (estimate)
May unemployment rate: 3.6% (actual) vs. 3.5% (estimate)
May average hourly earnings: +0.3% (actual) vs. +0.4% (estimate)
May ISM services: 55.9 (actual) vs. 56.3 (estimate)
Happy trading!
Tom