
EB Daily Market Report - Wednesday, June 8, 2022
Friday DMR
I will be in an all-day meeting on Friday, so there'll likely be a very quick DMR sent out after the CPI data is released at 8:30am ET.
Executive Market Summary
- Futures were lower overnight and our major indices all gapped lower at the opening bell
- We did see some early buying that cut into those opening losses, but, as of the time of this writing, selling has accelerated somewhat
- Energy (XLE, +0.71%) is the only sector in positive territory, while financials (XLF, -1.72%) and materials (XLB, -1.61%) are leading the laggards
- Crude oil ($WTIC, +2.22%) is surging above the $120 per barrel threshold, moving just past $122
- Other commodities are higher as well, especially natural gas ($NATGAS, +3.03%), which has moved past $9.50
- The 10-year treasury yield ($TNX) is up 4 basis points to 3.01% as traders await key inflationary data (May CPI) on Friday
- Intel (INTC, -5.02%) is threatening yet another breakdown, putting pressure on the entire semiconductor group ($DJUSSC, -2.52%) and on the Dow Jones
- Big financials like Goldman Sachs (GS, -2.07%) and JP Morgan Chase (JPM, -1.85%) are also weighing on the Dow Jones
Market Outlook
One of the periods within the calendar month that we have to be careful is from the 7th through the 10th. Here are the annualized returns of the S&P 500 of each of these calendar days since 1950:
- 7th: -9.97%
- 8th: +4.00%
- 9th: -17.54%
- 10th: +5.68%
Even though the 8th and 10th are positive, they are both well below the average annual return of the S&P 500 of +9.00% over the past 72 years. This historically is a period of profit taking and something we should always be aware of.
If I look only at the worst years - years in which the S&P 500 had a negative return - the weakness extends to cover the 6th through the 12th. Here are the annualized returns for this period for ONLY these bad S&P 500 years:
- 6th: -48.95%
- 7th: -1.13%
- 8th: -8.73%
- 9th: -44.01%
- 10th: +6.04%
- 11th: -34.88%
- 12th: -11.65%
If you haven't noticed, we're in a bad year for the S&P 500. And we're in the middle of this 6th through 12th period with a key inflation report on tap for Friday morning. It certainly makes sense for us to remain quite cautious. As I've said many times, these are short-term trading strategies designed mostly for traders. I believe "buy and hold" investors are typically served well by remaining invested during cyclical bear markets.
My trading right now is very limited with small positions and tight stops. I explain a bit of my current strategy down below under the "ChartLists/Strategies" section.
Sector/Industry Focus
Has the move higher in energy (XLE) run its course? I don't think so. Technical analysis involves (1) looking at all the evidence, (2) putting the puzzle pieces together, and (3) making an educated guess as to the likely direction of prices. The XLE showed slowing price momentum in March and April, and it was resolved with a trip back to its 50-day SMA and a test of its PPO centerline (pink arrows). It has since surged higher and its PPO is rising right along with price action:
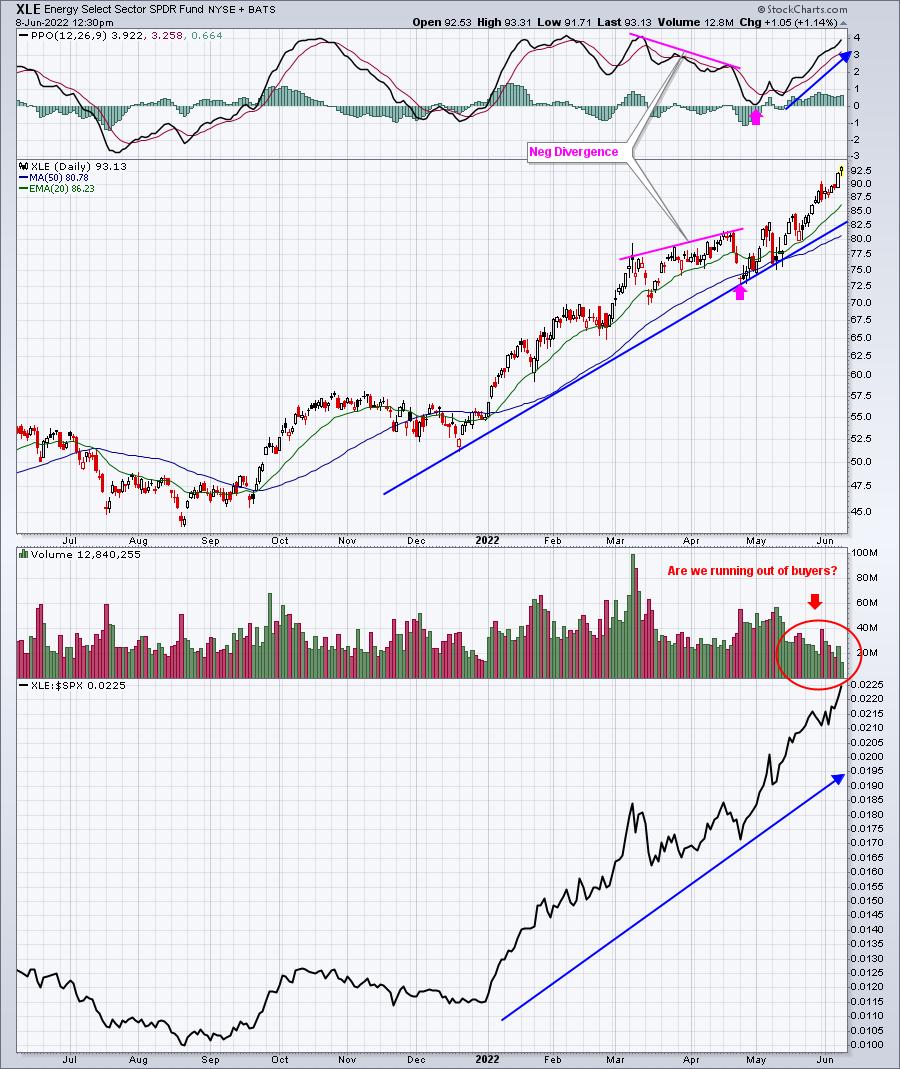
The only real issue I see is that volume has tailed off considerably on this latest price push higher. Is that an indication that there are fewer buyers? Possibly, but I really don't see any other bearish issues. The energy sector is easily the best performing group in 2022 and its relative strength is still soaring.
ChartLists/Strategies
I've discussed our Strong AD ChartList (SADCL) quite a bit recently and I'll highlight two trades that I'm currently in, explaining why I took the position and what it'll take for me to sell.
LXU:
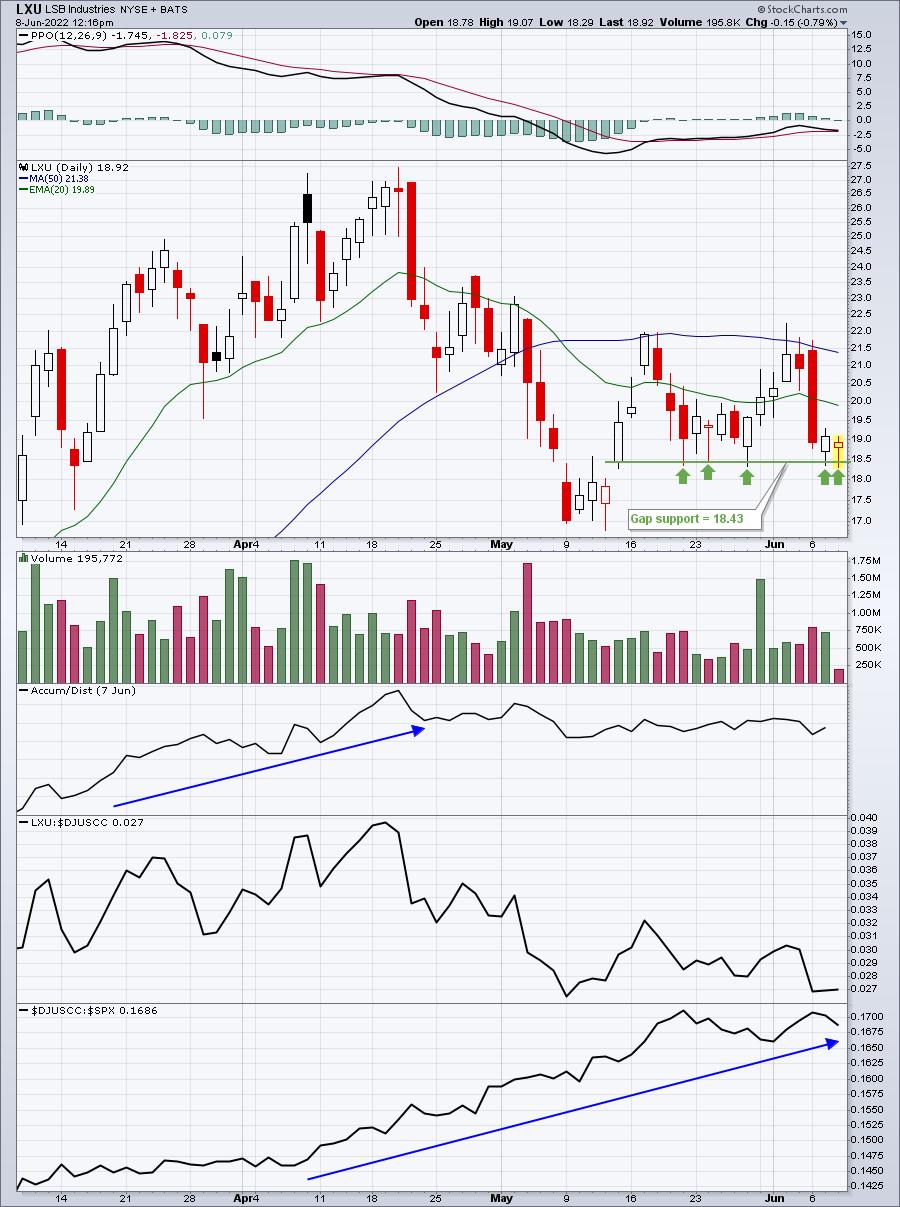
Recently, I pointed out the surging relative strength in the commodity chemicals ($DJUSCC) space. I like to trade momentum, so this is a group that has my attention currently. The AD line on the DJUSCC set another new high yesterday, so it's a group that tends to see some love in the afternoons. LXU is a stock that I was watching, awaiting breakout above 22. Instead of doing that, it's been weak of late, though hanging onto gap support at 18.43. Today marks the 5th time in the past few weeks that LXU has moved down to that gap support level intraday, only to reverse later in the day. So my trades on LXU keep this in mind. For instance, LXU traded as low as 18.29 this morning, slightly eclipsing previous lows. When it moved back up through 18.43, it appeared as though gap support would hold again. I have a stop beneath 18.29 right now, just in case. But LXU has been a stock under accumulation in recent moves on extremely heavy volume. It's in a very strong industry group, which provides me more confidence in the trade. If gap support is lost, 17 would be the next logical support level. In this market, however, I do not want to hold a stock down that far. I might consider re-entering LXU if it gets that low. For now, I'm just looking to make a few dollars, using its strong AD line to help me place a few profitable trades (hopefully).
GLNG:
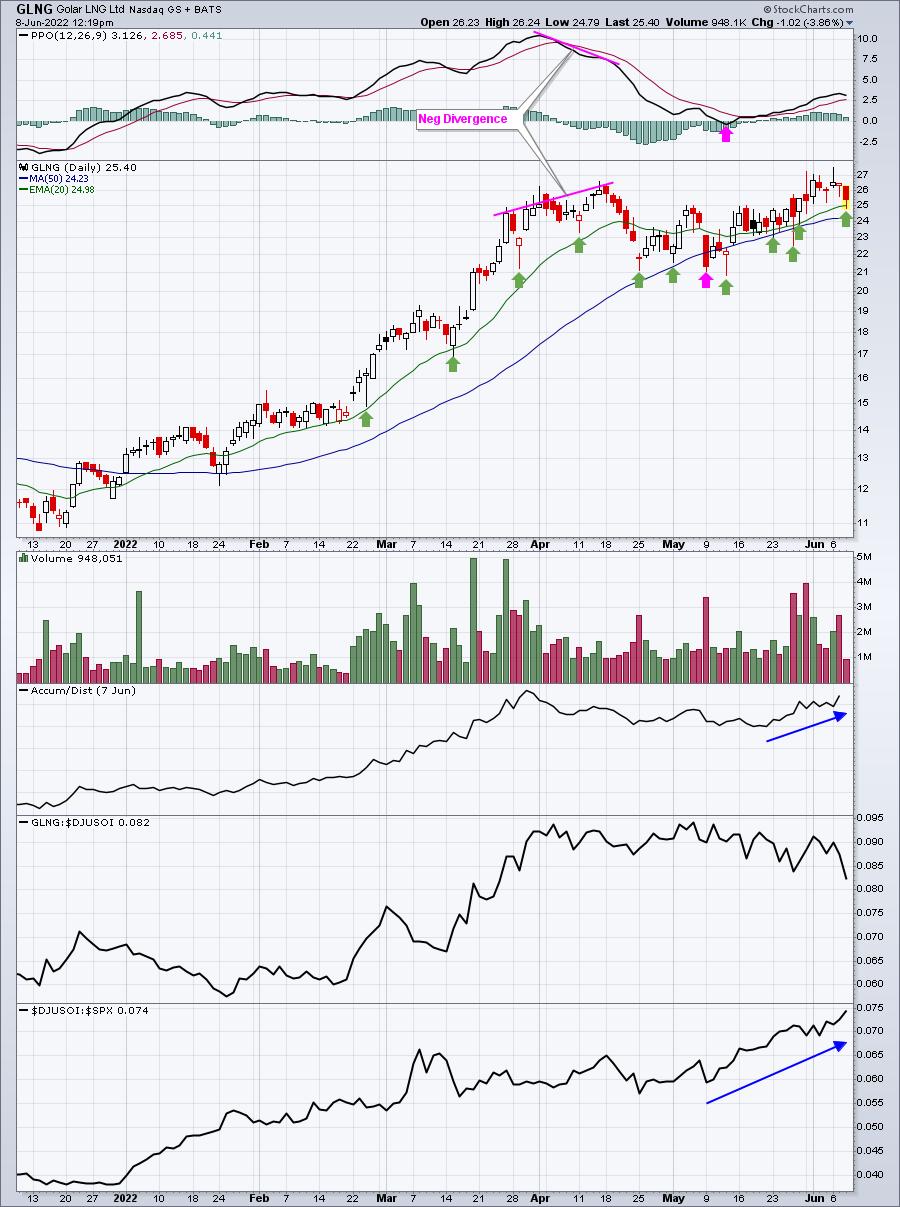
GLNG is similar in that it's part of the red-hot energy sector (XLE) and has a very strong AD line. When you look at this chart, you'll see a number of long tails to the downside, which highlights intraday weakness. These are opportunities for short-term trades. This morning, GLNG traded beneath its 20-day EMA, which it has been holding on a closing basis for the past three weeks. When GLNG traded back above its 20-day EMA, I jumped in around 25. I have a stop placed at 24.78 - one penny beneath today's low. This way, I can keep my loss to an absolute minimum. However, if GLNG does what it's been doing, I'm hoping to walk away with 2-3% profit - with little downside risk.
My strategy with these Strong AD ChartList trades is to look at stocks on this SADCL that are down for the session around 10:30-11:00am ET, look at their charts, and see if patterns exist. If I like it, I put on a trade. If I don't, I walk away. There is absolutely NO PRESSURE for me to make trades. I only do it if I can manage my risk to the downside. This part is critical in a cyclical bear market. As a friend of mine likes to say, "I don't mind being wrong, I just don't want to be wrong for long!" There's a very good chance (almost 100% chance) that I'll be out of both of these stocks before today's close.
I really like being entirely, or mostly, in cash overnight in my active trading account during cyclical bear markets. I have NO idea whether we'll open higher or lower on a daily basis and it's literally a coin toss. How can I manage risk based if I'm relying on a coin toss?
Earnings Reports
Here are the key earnings reports for the next two days, featuring stocks with market caps of more than $10 billion. I also include several companies with market caps below $10 billion. Finally, any portfolio stocks that will be reporting results are highlighted in BOLD. If you decide to hold a stock into earnings, please understand the significant short-term risk that you are taking. Please be sure to check for earnings dates for any companies you own or are considering owning.
Wednesday, June 8:
BF/B, CPB, FIVE, PAGS, THO, ABM, OLLI, OXM
Thursday, June 9:
NIO, DOCU, MTN, BILI, SIG, FCEL, SFIX
Economic Reports
None
Happy trading!
Tom