
EB Daily Market Report - Thursday, June 9, 2022
Friday DMR
I will be in an all-day meeting on Friday, so there'll likely be a very quick DMR sent out after the CPI data is released at 8:30am ET.
Executive Market Summary
- Futures were lower overnight and we saw initial gaps to the downside at the opening bell
- Like yesterday, we're attempting to rally back into positive territory, with the NASDAQ able to do so briefly before turning back into negative territory
- Initial jobless claims were much higher than expected, which has been the norm of late; this could be pointing to a recession, adding to the signals provided with extremely weak consumer stock performance
- Crude oil ($WTIC, -0.01%) is flat near the $122 per barrel level, while the 10-year treasury yield ($TNX) is slightly higher at 3.04%
- This combination is likely allowing equity buyers to keep pace with sellers
- Gold ($GOLD, -0.66%) is threatening to roll over and close beneath $1840 per ounce for the first time in 2-3 weeks - more on gold below
- Tomorrow morning at 8:30am ET, we'll get the latest inflation news as the May CPI will be released
- Consumer discretionary (XLY, +0.46%) is the only sector in positive territory as automobiles ($DJUSAU, +2.83%) got a lift from a Tesla (TSLA, +3.79%) upgrade
- Meanwhile, materials (XLB, -1.09%) lead the rest of the sectors lower
- Recreational services ($DJUSRQ, -4.24%) are extending a very difficult week as many cruise lines lead the S&P 500 lower
Market Outlook
There is so much chop and whipsaw action in the stock market right now, it really helps to look at weekly charts, in addition to daily charts. Let me give you an example by looking at the transportation stocks ($TRAN). On the daily chart, there have been plenty of short-term bullish and bearish signals:
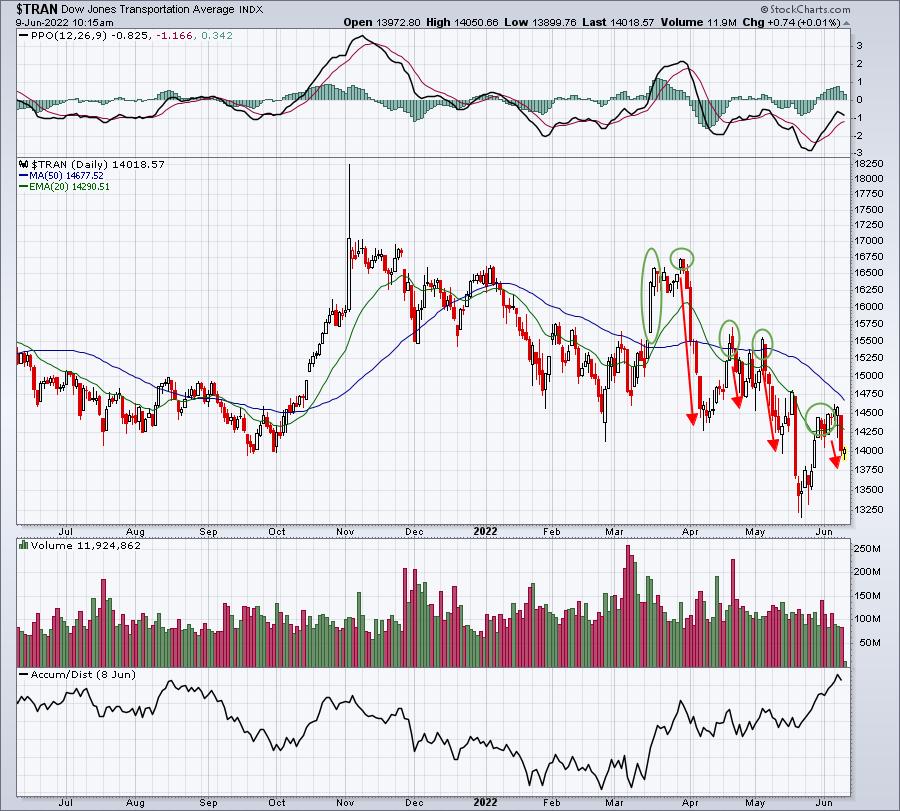
The green circles point out what appear to be significant breakouts. Unfortunately, they are all followed by further downside action (red directional lines) that confirms the 2022 downtrend remains intact. I want you to check out the AD line, however. Despite all the selling, it appears - at least based on this AD line indicator - that Wall Street is happily buying into all the weakness. Prices are moving lower, but there's enough afternoon interest to keep this AD line moving higher. That's impressive.
Now let's move to the weekly chart to drown out the noise:
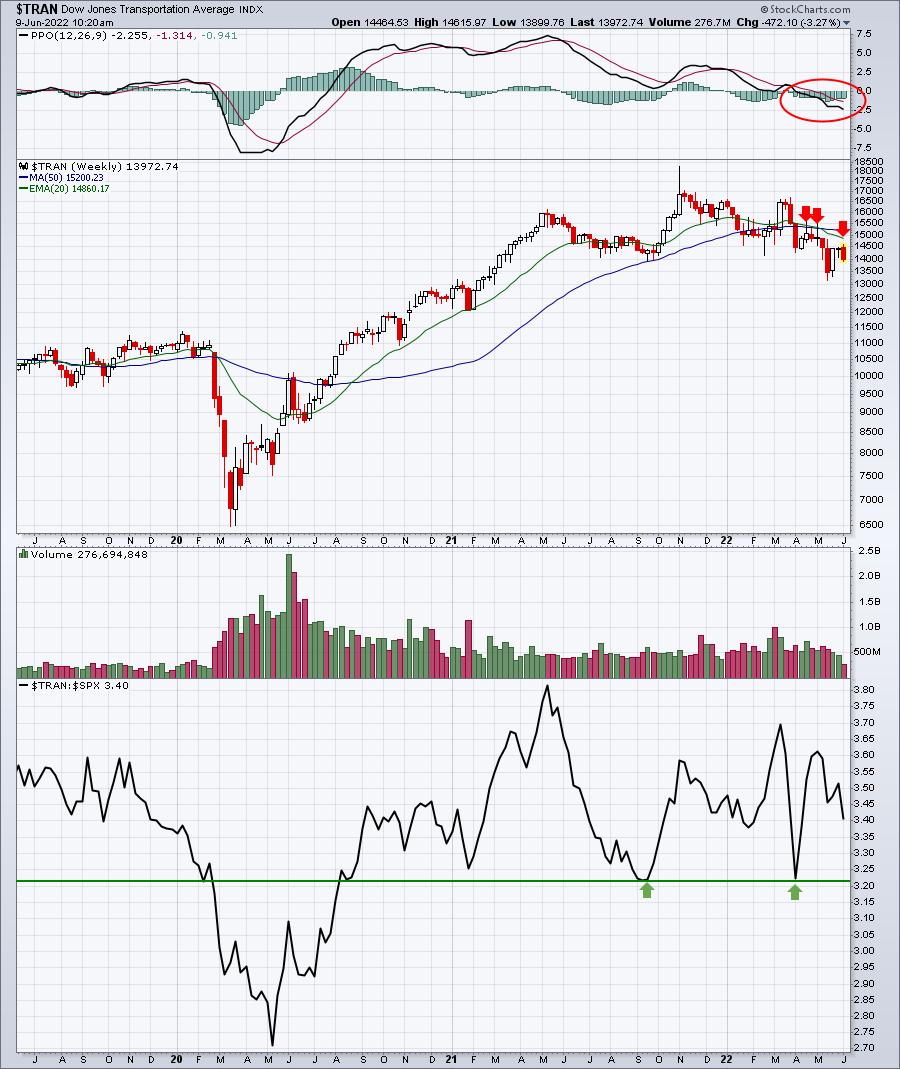
The trend is clearly lower. Outside of that quick move to the upside in March, the TRAN continues to languish and trade beneath its declining 20-week EMA. In order to confirm other bullish signals like that strong AD line and relative strength that is holding prior lows, we need to see price action reclaim that 20-week EMA. We're not there yet.
Sector/Industry Focus
The dollar (UUP, +0.36%) is having a solid day and breaking back above its 20-day EMA, a bullish development there. That's putting additional pressure on gold ($GOLD), which looks to be rolling over again:
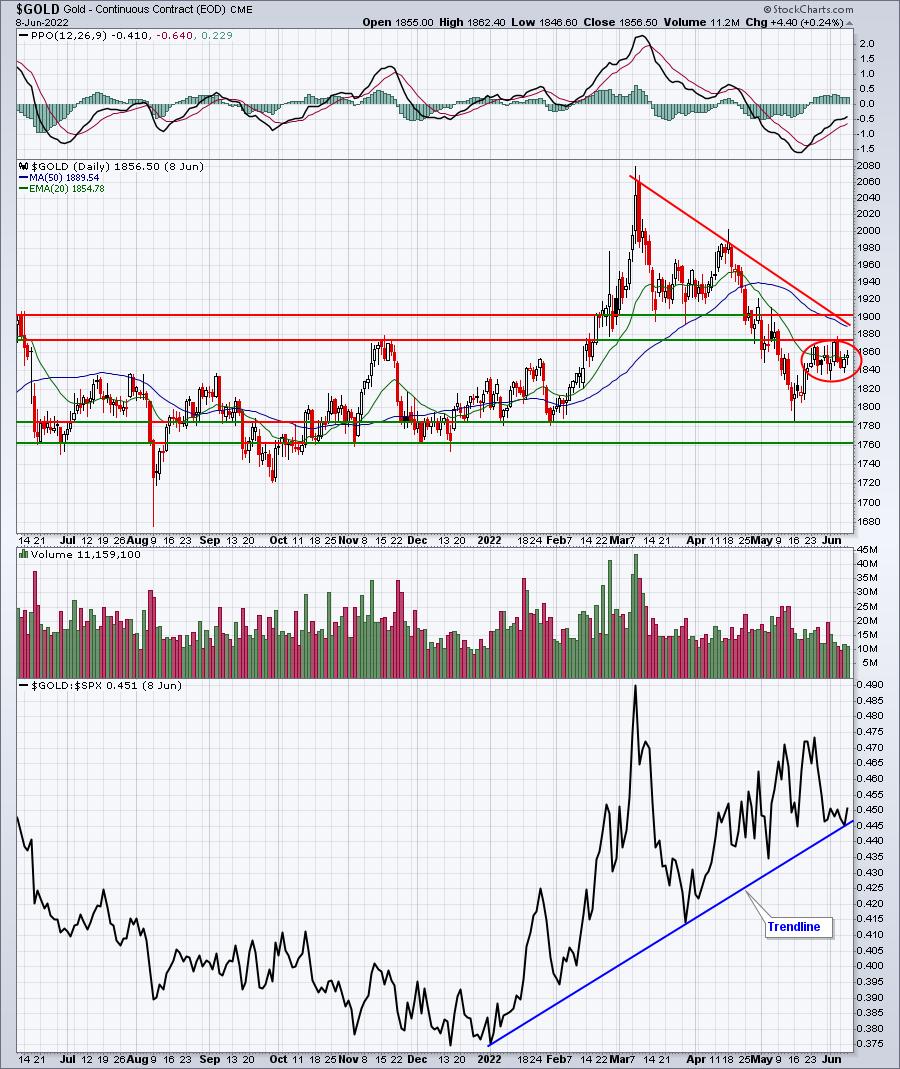
A couple of things to note here. First, while gold is trending lower on an absolute basis, it continues to outperform the S&P 500 on a relative basis - and that's typical during volatile markets.
While I spend most of my time talking about other sustainability ratios like XLY:XLP and IWF:IWD, I also like to keep an eye on how copper prices ($COPPER) are performing relative to gold ($GOLD). Copper performs well when global demand is strong or strengthening. Gold, meanwhile, tends to perform best when investors are nervous. By following the $COPPER:$GOLD ratio, we can get a sense of how commodity traders feel about the market environment. Here's how this ratio looks right now and for the past 10 years on a weekly basis:
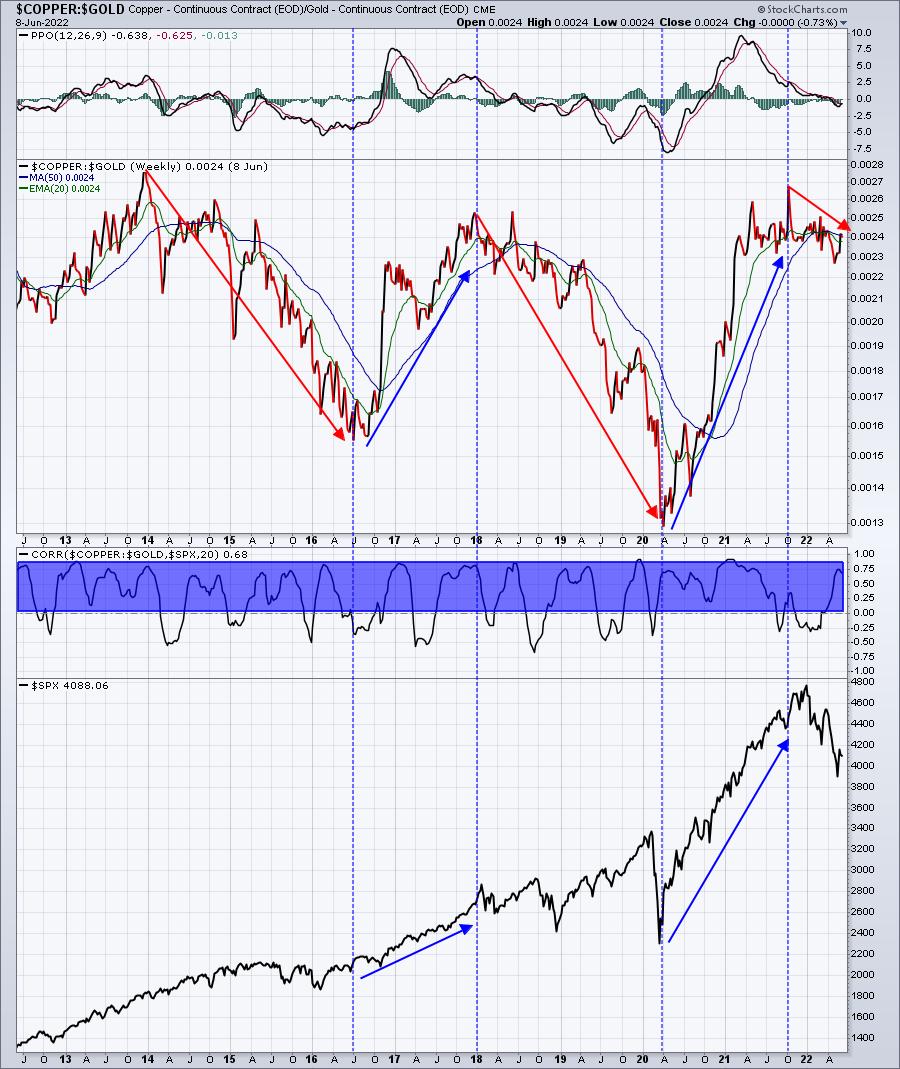
First, check out the blue highlighted area on the correlation coefficient. This shows us that the $COPPER:$GOLD ratio is positively correlated with the S&P 500. While it's not perfect and not nearly as positively correlated with the S&P 500 as the XLY:XLP ratio, it still gives us a different angle at evaluating market conditions. Note that when the $COPPER:$GOLD ratio is climbing, the S&P 500 is generally soaring. But when this ratio is declining, the S&P 500 tends to be choppy or downright bearish. Currently, this ratio is in a downtrend, though it has improved in recent weeks. If it rolls over again, though, it would be another signal that the S&P 500's decline has not ended.
ChartLists/Strategies
Trade Update:
I ended up moving to cash at the close yesterday by selling both LXU and GLNG. I didn't want to hold overnight. I'm not in either trade today, but I did notice both traded lower early and have rallied, so a strategy today similar to yesterday would be yielding solid results thus far. GLNG is 3% above its intraday low and LXU is more than 5% higher than its intraday low. That's the idea with the Strong AD ChartList (SADCL) - use early intraday weakness to build a position and let the typical rally unfold. Just be sure to keep stops in place.
Earnings Reports
Here are the key earnings reports for the next two days, featuring stocks with market caps of more than $10 billion. I also include several companies with market caps below $10 billion. Finally, any portfolio stocks that will be reporting results are highlighted in BOLD. If you decide to hold a stock into earnings, please understand the significant short-term risk that you are taking. Please be sure to check for earnings dates for any companies you own or are considering owning.
Thursday, June 9:
NIO, DOCU, MTN, BILI, SIG, FCEL, SFIX
Friday, June 10:
None
Economic Reports
Initial jobless claims: 229,000 (actual) vs. 210,000 (estimate)
Happy trading!
Tom