
EB Daily Market Report - Tuesday, June 14, 2022
June Max Pain Event
Today is THE day. At 4:30pm ET, I'll be hosting our monthly max pain event, where we'll look to find directional clues over the next week or so based on the outstanding June calls and puts. I believe we are approaching a MAJOR market bottom - many of the stars are aligning. If we do begin to rally, you NEED to be at this event to understand WHY I'm seeing a potential bottom.
Here's a link to the room for today:
https://earningsbeats.zoom.us/j/82652829792
The room will open at 4:00pm ET and we'll get started promptly at 4:30pm ET. If you cannot attend the live session, no worries. We will record the event and make the recording available to you later this evening.
Executive Market Summary
- Futures were slightly higher overnight and our major indices gapped higher
- The 10-year treasury yield ($TNX) is jumping another 10 basis points to 3.47% after breaking to an 11-year high on Monday above 3.25%
- Sentiment has turned quite bearish with the equity only put call ratio ($CPCE) rising to test 2-year highs and the Volatility Index ($VIX) once again moving into the mid-30s this week
- May PPI came in as expected this morning, rising 0.8%; Core PPI was slightly above expectations, +0.7% vs. +0.6%
- Technology (XLK, +0.69%) and consumer discretionary (XLY, +0.40%) were among today's best sectors
- Meanwhile, defensive groups lagged; utilities (XLU, -2.88%) is by far the worst-performing sector
- It's interesting that the last week's losses have been led by the XLU (-12.07%), XLRE (-11.77%), and XLB (-11.62%) - where are the aggressive sectors? We could be bottoming....
- It's max pain week, so literally anything goes, but the backdrop favors a significant rally later this week and possibly into next week
- Commodities are mostly lower, especially natural gas ($NATGAS, -14.94%), which is tumbling
Market Outlook
Ok folks, things are beginning to get exciting. I'm on the verge of calling a MAJOR BOTTOM. At our MarketVision 2022 event on January 8th, I provided my prediction for the S&P 500 in 2022 and the chart I provided looked like this:
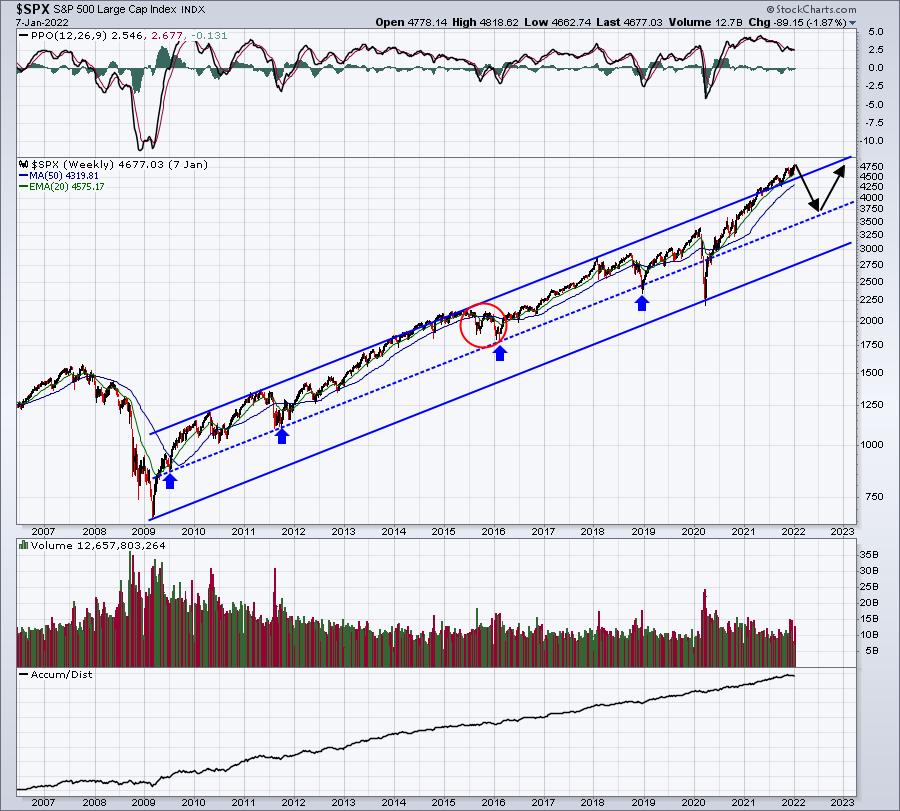
That is the EXACT chart I annotated more than 5 months ago, while we were fresh off of all-time highs less than one week earlier. Would you like to see what this chart looks like in real time now?
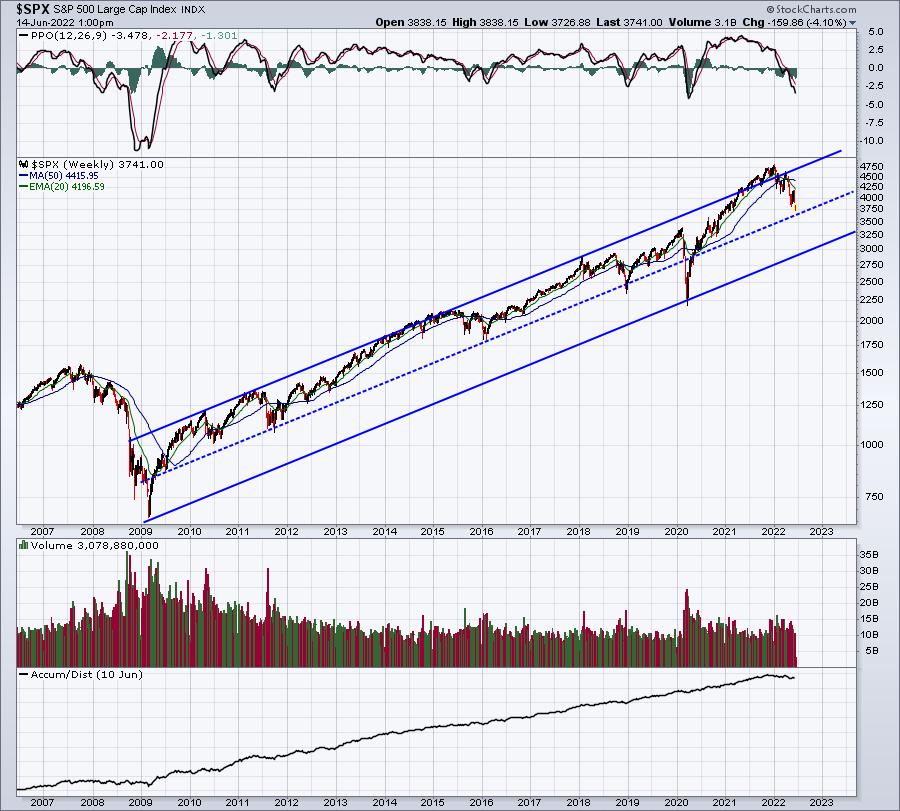
I believe we're just about there. Could we go lower? Sure, anything can happen. Honestly, the biggest risk might be the next day or two. There tends to be a lot of volatility around Fed meetings and if the S&P 500 drops further today or tomorrow, we could see panic selling kick in. If that happens, I believe it would mark the bottom. I'm convinced this is a cyclical bear market, not secular, and most of these last from 3-6 months. Occasionally, they last a bit longer. We've just begun our 6th month. Given the summertime history (somewhat bearish), this bearish market lasting until September cannot be ruled out. I suspect, however, that we are preparing for a very significant bounce in the market and, even if we do have more weakness later this summer, I'm beginning to think we won't take out the bottom being established now.
I am putting more money to work today and I'll add on any further weakness the next two days. That's my plan.
Sector/Industry Focus
Let's also talk sentiment. At the end of 2021, I wanted to see a sentiment "reset", seeing the 5-day moving average of the equity only put call ratio ($CPCE) rise to the .75-.80 level. We've hit .75 but I'd really prefer to see .80. That could happen over the next day or two if the S&P 500 remains weak. This is the most bearish we've been in a long, long time. Here's the chart that I highlighted at MarketVision 2022:
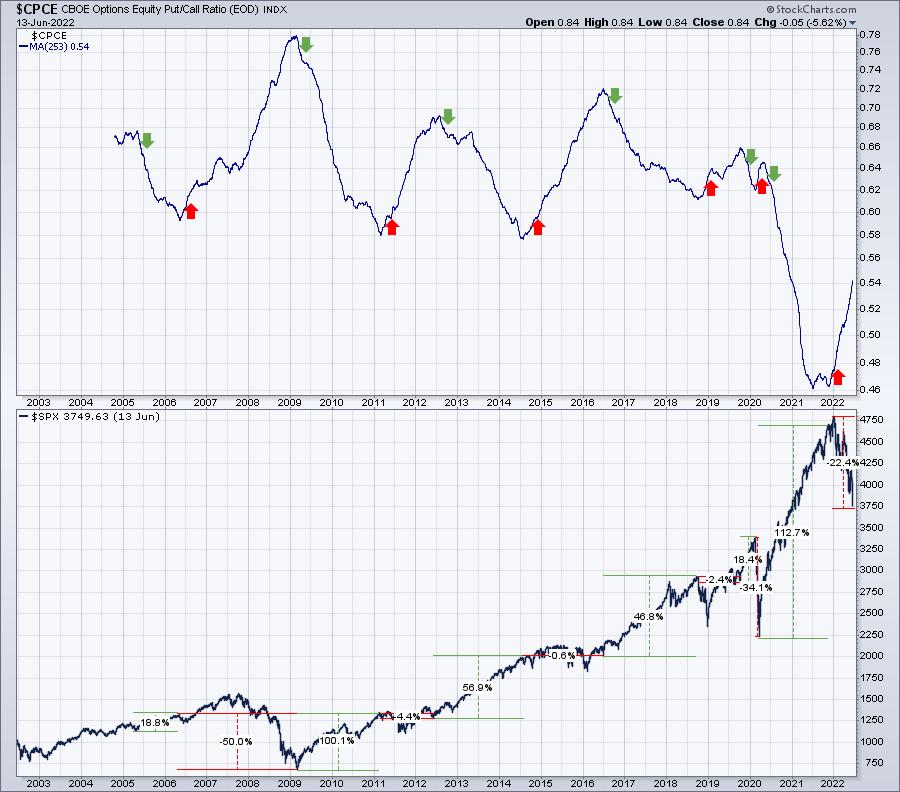
We've seen that bear market develop right before our eyes and the long-term 253-day moving average of the CPCE has risen from .46 to above .54. We could move a little higher and likely will even if the stock market begins to rebound from here. I expect we'll ultimately top out around .58 before rolling over during the next bullish phase of the market.
Here's what the 5-day moving average of the CPCE looks like now:
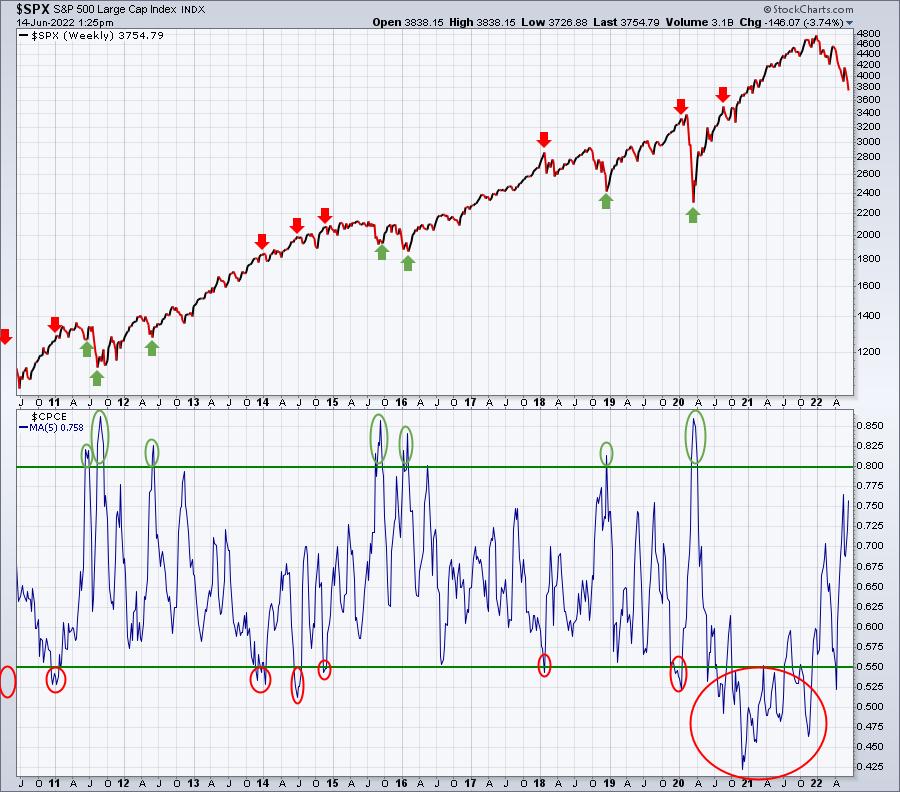
The green circles show 5-day moving average peaks in the CPCE that coincide perfectly with key bottoms. I believe .75 is high enough, though .80 would be better. If we see further weakness over the next couple days, it's very likely that this 5-day moving average will reach .80.
This is a bold call, but I believe the low THIS WEEK will mark the ultimate bottom. A big drop this afternoon, tomorrow (Fed meeting), or Thursday morning (Fed hangover), followed by a huge recovery into the close is what I'd look for to potentially confirm my bottom call.
While the S&P 500 moved to a new low today, I think it's noteworthy that the XLY:XLP, QQQ:SPY, and IWF:IWD ratios were all turning higher. Wall Street could just be beginning to rotate back into growth.
One downside in the near-term is that if I'm right about a bottom and a rally, I'd expect our portfolios to underperform since they are not littered with the growth stocks that could be the prime beneficiaries in a big short-term rally.
ChartLists/Strategies
For me right now, it's all about max pain. The market has turned incredibly bearish and we're seeing levels on the Volatility Index ($VIX) and equity-only put call ratio ($CPCE) that can help us mark a bottom. Throw in the incredible number of in-the-money puts and there's definitely a recipe in place for a quick turnaround and higher prices at ANY time.
I'll be discussing plenty of stocks after the bell today in our June Max Pain webinar, but here are a just a few that look tantalizing to me:
- QQQ - max pain is 322.75 with net in-the-money (ITM) put premium above $5 billion!!!
- ZM - max pain 152.65; $257 million net ITM put premium
- PYPL - max pain 110.89; $523 million net ITM put premium
- NFLX - max pain 257.33; $781 million net ITM put premium
- META - max pain 215.45; $1.08 billion net ITM put premium
- AMZN - max pain 124.47; $2.37 billion net ITM put premium
- AAPL - max pain 139.48; $419 million net ITM put premium
If the stock market rallies between now and the end of the week (or even into early next week), these are stocks that could benefit tremendously.
Earnings Reports
Here are the key earnings reports for the next two days, featuring stocks with market caps of more than $10 billion. I also include several companies with market caps below $10 billion. Finally, any portfolio stocks that will be reporting results are highlighted in BOLD. If you decide to hold a stock into earnings, please understand the significant short-term risk that you are taking. Please be sure to check for earnings dates for any companies you own or are considering owning.
Tuesday, June 14:
None
Wednesday, June 15:
None
Economic Reports
May PPI: +0.8% (actual) vs. +0.8% (estimate)
May Core PPI: +0.7% (actual) vs. +0.6% (estimate)
Happy trading!
Tom