
EB Daily Market Report - Quick Update - Monday, June 27, 2022
I'm traveling back home today, but have stopped to give you a quick update.
First, we're moving into a fairly strong seasonal period as late June into the first couple weeks of July tend to be very productive for the bulls. This upcoming period (June 28th through July 17th) has annualized returns as follows:
- S&P 500: +26.55%
- NASDAQ: +35.91%
That's roughly triple the average annual returns, so it's clearly a bullish period. This is also typical for all pre-earnings periods.
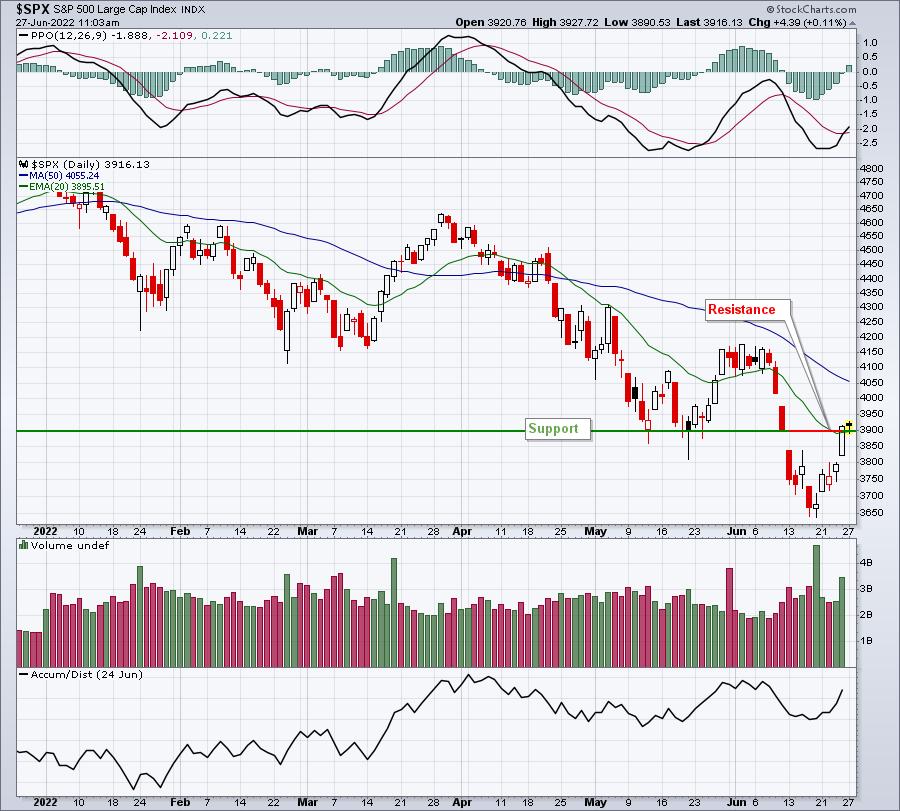
Technically, we're in much better shape that we've been in awhile. The S&P 500 powered through its 20-day EMA last week for the first time in a few weeks and we also were able to negotiate 3900, which held as price support throughout May. Moving right back through that 3900 resistance should be viewed as a technical positive. Also, this morning we saw the S&P 500 test its 20-day EMA and bounce off of it. It's intraday and we don't know where we'll close, but bouncing intraday is better than not bouncing. So this too should be seen as a positive. Here's the chart:
Also, we need to watch divergences on the hourly chart as they'll many times provide us a short-term warning as to a pullback - for those who are more short-term trading oriented. Here's how momentum looks on the S&P 500 hourly chart right now:
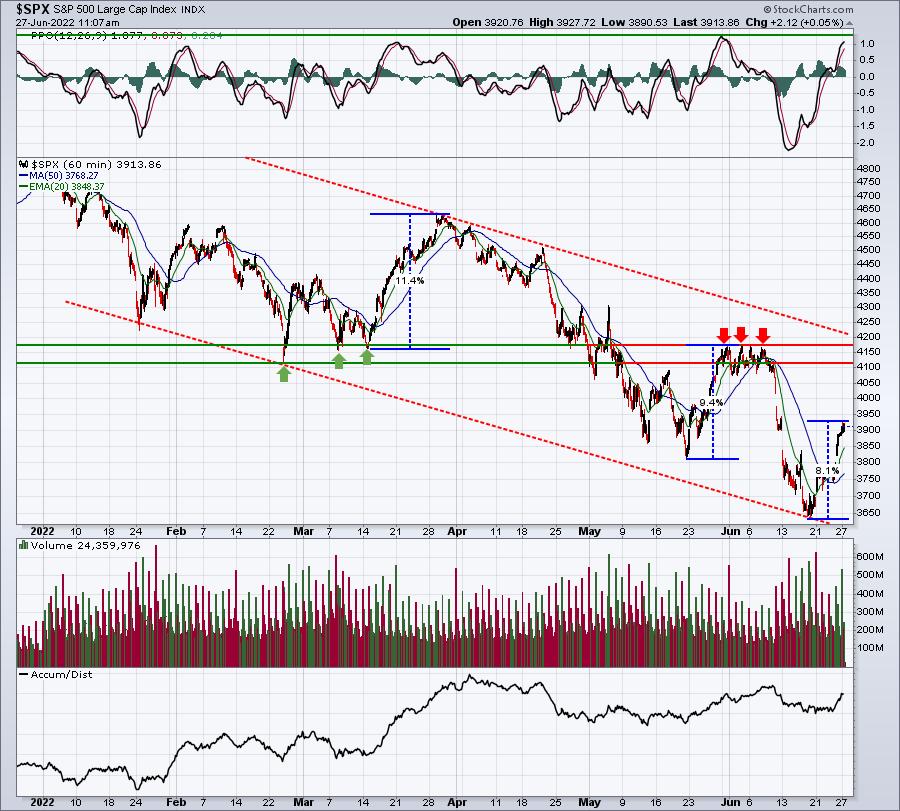
The hourly PPO is almost as strong as at any point during the current cyclical bear market. The rally itself has now extended roughly 8% vs. the last two rallies that gained 11.4% and 9.4%. I believe the 4175-4180 price resistance level will be tested over the next few weeks to establish a potential neckline. We moved straight down from that level, so moving straight back up to there isn't a preposterous idea. That would also take us back to or near the top of the current down channel. I'm looking for the ultimate break above 4200 to signal confirmation that the June bottom is THE bottom. There's a lot of congestion in the 4100-4200 zone. In the meantime, I'd consider the 3636-4200 as the summer range. Yes, we could move lower again to perhaps print a double bottom. I don't think we should rule that out. Therefore, the closer we get to 4200, the more I'd be looking to book trading profits.
Keep in mind that the TRUE "go away" period in the stock market historically is July 17th (close) through September 26th (close). It's not like we collapse during the summer, but we do have a negative annualized return for that period since 1950, so it's one check mark in the bears' column.
That's it for now. I'll be back tomorrow with my normal DMR format.
Happy trading!
Tom