
EB Daily Market Report - Tuesday, June 28, 2022
ChartLists Updated
I updated several ChartLists and they're now available for viewing/download from our website. ChartLists updated include:
- Strong Earnings ChartList (SECL)
- Strong Future Earnings ChartList (SFECL)
- Model Portfolio ChartList
- Aggressive Portfolio ChartList
- Income Portfolio ChartList
- Strong AD Portfolio ChartList
- Earnings Reaction Portfolio ChartList
- Model ETF Portfolio ChartList
I'm hoping to update the Raised Guidance ChartList (RGCL), Strong AD ChartList (SADCL), and Bullish Trifecta ChartList (BTCL) tomorrow. I'll keep you posted.
Executive Market Summary
- Futures were higher overnight and our major indices did get off to a solid start
- Selling quickly engulfed Wall Street, however, and the bears finally regained control after a solid 1-2 week stretch
- Crude oil ($WTIC, +2.02%) is back up to $112 per barrel; energy (XLE, +2.17%) is the only sector higher today
- Meanwhile, selling is hitting our aggressive groups the hardest - consumer discretionary (XLY, -3.73%), technology (XLK, -2.82%), and communication services (XLC, -2.48%)
- The 10-year treasury yield ($TNX) is up 1 basis point to 3.21%
- The April Case-Shiller home price index rose 1.8%, despite the TNX climbing more than 60 basis points during the month; still, it's a lagging report that most traders ignore
- Footwear ($DJUSFT, -6.41%) and automobiles ($DJUSAU, -4.53%) were very weak; Nike (NKE, -6.88%) is reversing hard off its earlier attempt to clear its 20-day EMA
- Etsy, Inc. (ETSY, -8.00%) has been incredibly volatile of late and it's leading the S&P 500 leaderboard to the downside
Market Outlook
Earlier I mentioned the weakening sustainability ratios. I'm not changing my opinion of a bottom being in place, because of one day's trading action, but clearly Wall Street has banked short-term profits on aggressive growth stocks. Check out the S&P 500 with these sustainability ratios in the panels below:
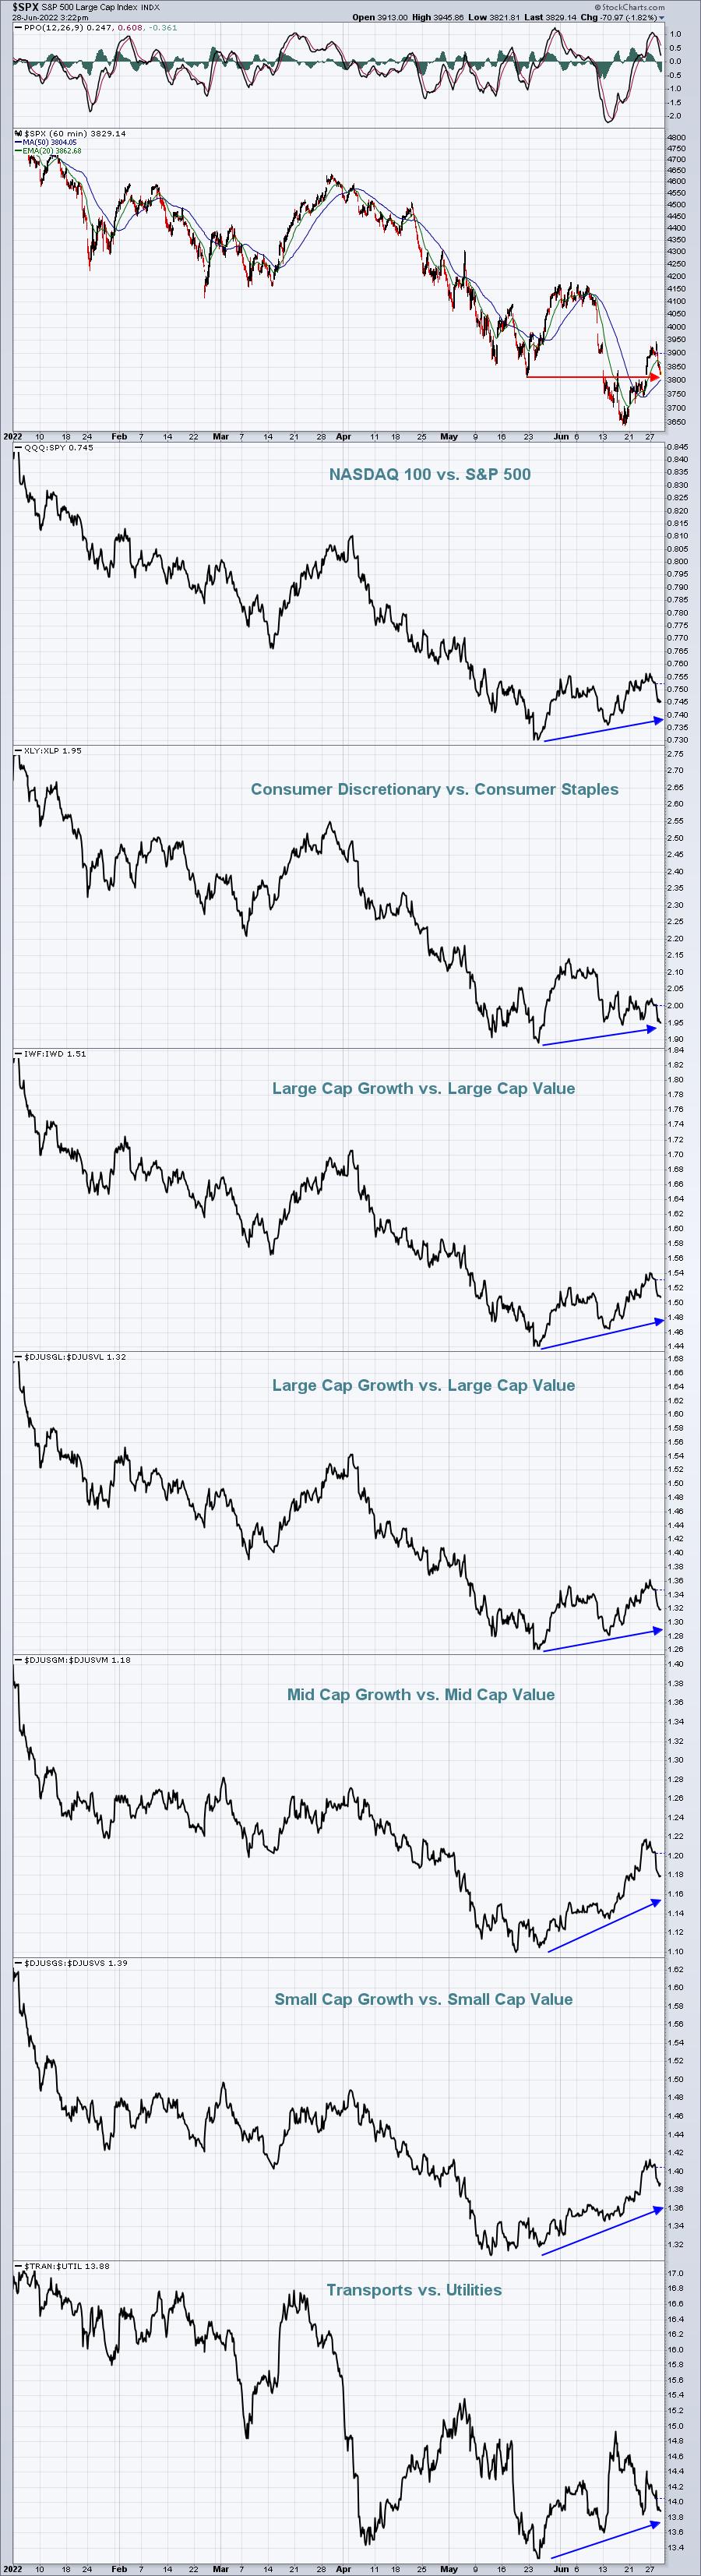
While these ratios are rolling over short-term, I want you to look at where the S&P 500 was on May 23rd and where it is now - mostly unchanged. But look at every ratio that I provide above. From that same date of May 23rd, every one of these ratios is higher, some significantly higher. So while we're running into some trouble today, which should be expected by the way, I believe this weakness will be short-lived. As a result, I'm actually buying this afternoon. I've bought both Zoom (ZM) and the leveraged QLD (ETF that tracks NASDAQ 100 at a 2x clip). I'll keep a fairly tight stop in the event I'm wrong, but I think we'll bounce back quickly.
Sector/Industry Focus
One group that I'd really like to see get going is the semiconductor group ($DJUSSC). They really haven't participated much in the recent rally, but if the stock market is to truly move higher later this year, it'll need help from one of its secular bull market leaders:
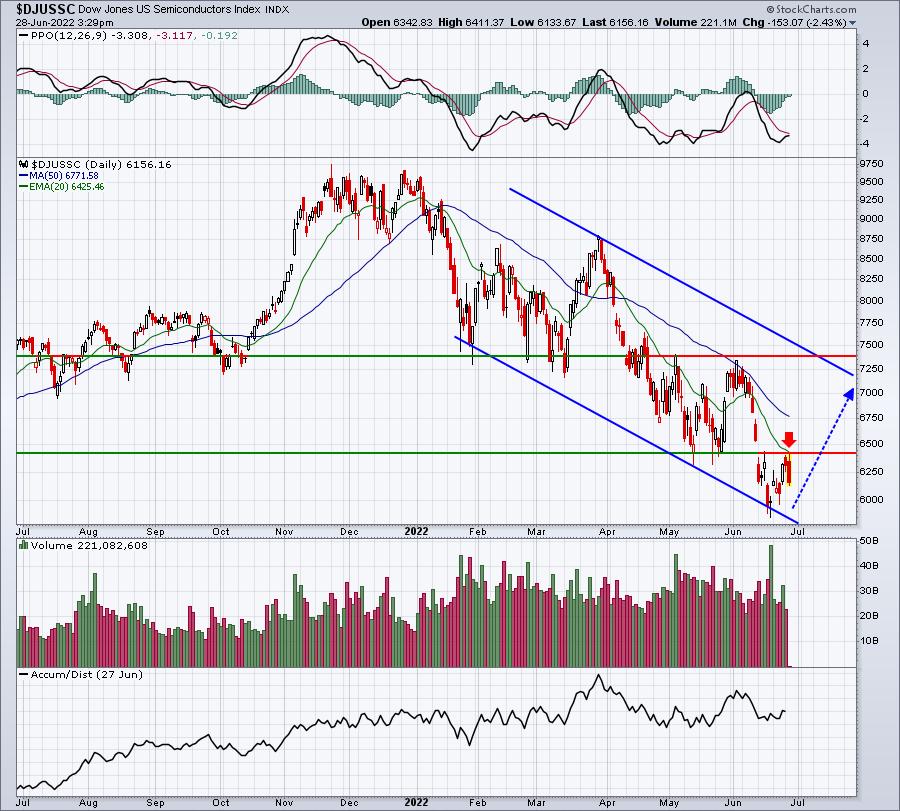
Include this on my "wish list". The AD line remains strong, which is encouraging. But we need absolute strength, and that's been missing for quite awhile now. Watch for a close over 6450. That would be a VERY bullish signal for equities.
ChartLists/Strategies
The selling accelerated in late-morning and afternoon trading and that's provided opportunities on the long side, if you're willing to take on some risk. I mentioned earlier that I'm a big fan of Zoom (ZM), which I recently sold because of its recent rally. I still love the stock, but I don't take profits for granted in this market. It was trading well above its now-rising 20-day EMA and so I mentioned it as a possible trade candidate as it approached its 20-day EMA. That was earlier this morning. Well.....it didn't take long as ZM fell 6 bucks - just since 11am ET this morning. It moved within a dollar of its 20-day EMA and I began buying. I'll hold it as long as it closes over its 20-day EMA. If it fails, I'll take a small loss and wait for another opportunity. Here's the chart now:
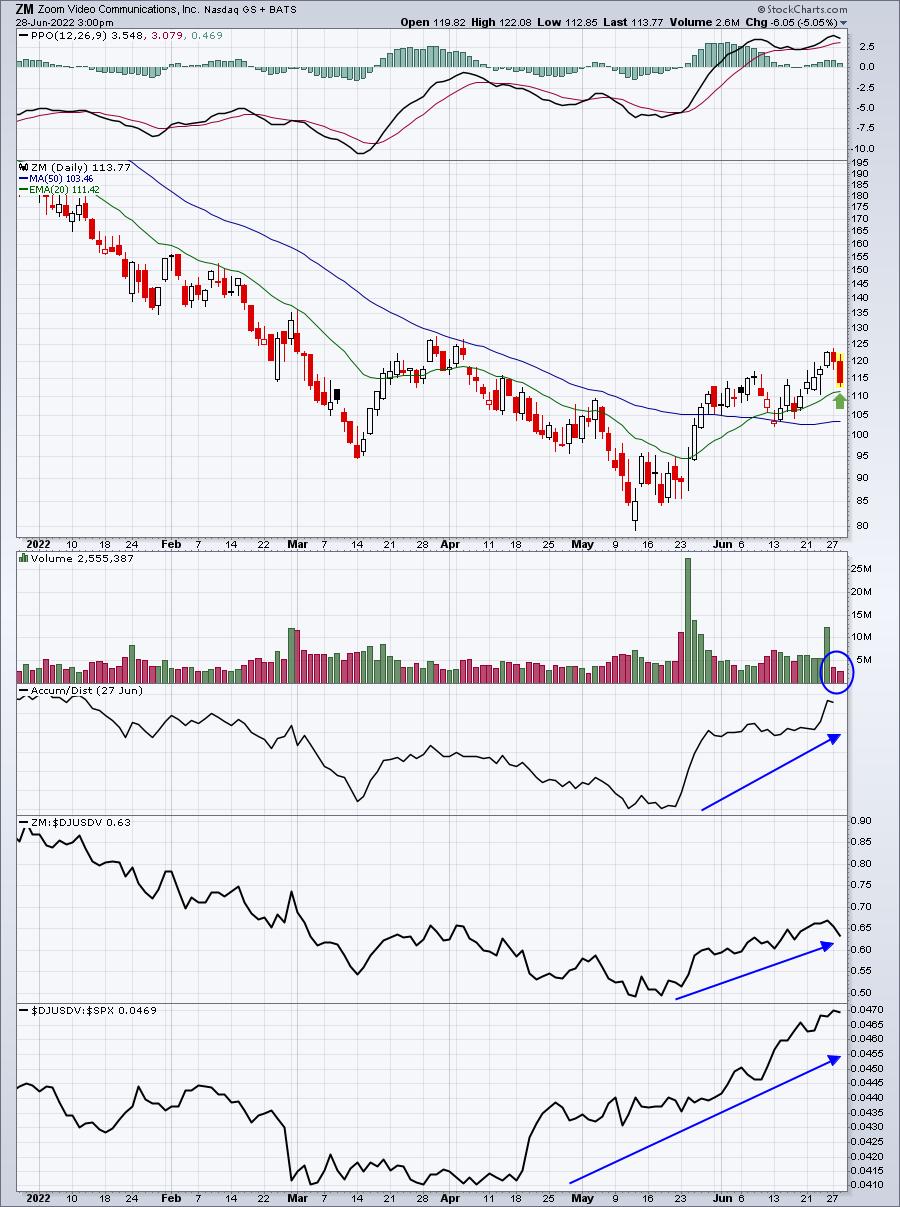
I'll most likely focus on stocks that have seen their daily PPOs move back above their zero lines and are trading above their 20-day EMA, which is also above its 50-day SMA. That's the chart configuration I prefer. Tests of 20-day EMAs are preferred as I can be disciplined to keep my stops fairly tight.
Earnings Reports
Here are the key earnings reports for the next two days, featuring stocks with market caps of more than $10 billion. I also include several companies with market caps below $10 billion. Finally, any portfolio stocks that will be reporting results are highlighted in BOLD. If you decide to hold a stock into earnings, please understand the significant short-term risk that you are taking. Please be sure to check for earnings dates for any companies you own or are considering owning.
Tuesday, June 28:
SNX, PRGS, AVAV
Wednesday, June 29:
PAYX, GIS, MKC, MSM, PDCO, DCT, NG, SGH
Economic Reports
April Case-Shiller home price index: +1.8% (actual) vs. +1.8% (estimate)
Happy trading!
Tom