
EB Daily Market Report - Wednesday, June 29, 2022
ChartLists Update
I am planning to update the Raised Guidance ChartList (RGCL), Strong AD ChartList (SADCL), and Bullish Trifecta ChartList (BTCL) later this afternoon. So check our website later this evening and hopefully you'll be able to view/download these 3 ChartLists.
Executive Market Summary
- Futures were mixed overnight and we opened slightly lower, with a bit of relative weakness on the NASDAQ - similar to Tuesday's action
- The Volatility Index ($VIX) hit over 29 today, so it remains quite elevated and well above historical norms
- That volatility has sent the NASDAQ all over the place this morning, with sudden surges and selloffs in the first two hours of trading
- The 10-year treasury yield ($TNX) is down 11 basis points to 3.10% as traders move back into bonds
- Cryptocurrencies continue to struggle with bitcoin ($BTCUSD) barely hanging onto 20000
- Crude oil ($WTIC, -0.07%) was up earlier this morning before reversing; natural gas ($NATGAS, -0.68%) shows continuing weakness after its recent pummeling from $9.50 to $6.00
- Apple (AAPL, +1.72%) and Microsoft (MSFT, +1.50%) are helping to lift all of our major indices
- Meanwhile, the cruise lines are taking a beating as Carnival (CCL, -13.07%), Norwegian (NCLH, -8.97%), and Royal Caribbean (RCL, -8.78%) are the 3 worst S&P 500 performers
Market Outlook
Let's talk about the history of S&P 500 performance since 1950. July tends to be a fairly strong month as the S&P 500 has produced annualized returns of +13.80% over the past 7 decades. That ranks it as the 3rd best calendar month, behind only November (+19.91%) and December (+16.62%). But much of that strength comes leading up to the start of earnings season. Here's the July performance breakdown on the S&P 500:
- July 1-17: +25.57% (59.04% of days end higher)
- July 18-28: -8.52% (49.28% of days end higher)
- July 29-31: +36.94% (60.13% of days end higher)
We're also in the midst of a bullish June period. The 28th through the 30th has produced annualized returns of +31.64% and 55.26% of days within this period end higher.
Looking ahead to the rest of the summer, here are the annualized returns for both August and September:
- August: +0.87% (August has gained ground 40 of 72 years)
- September: -6.36% (September is only month to go down more often than up, 39 down, 32 up)
Sector/Industry Focus
Energy (XLE) showed excellent relative strength yesterday, but I'm seeing big problems in energy ahead. First, it seems as though that $130 level on crude oil ($WTIC) was the top. More importantly, however, is the head & shoulders top that's currently printing:
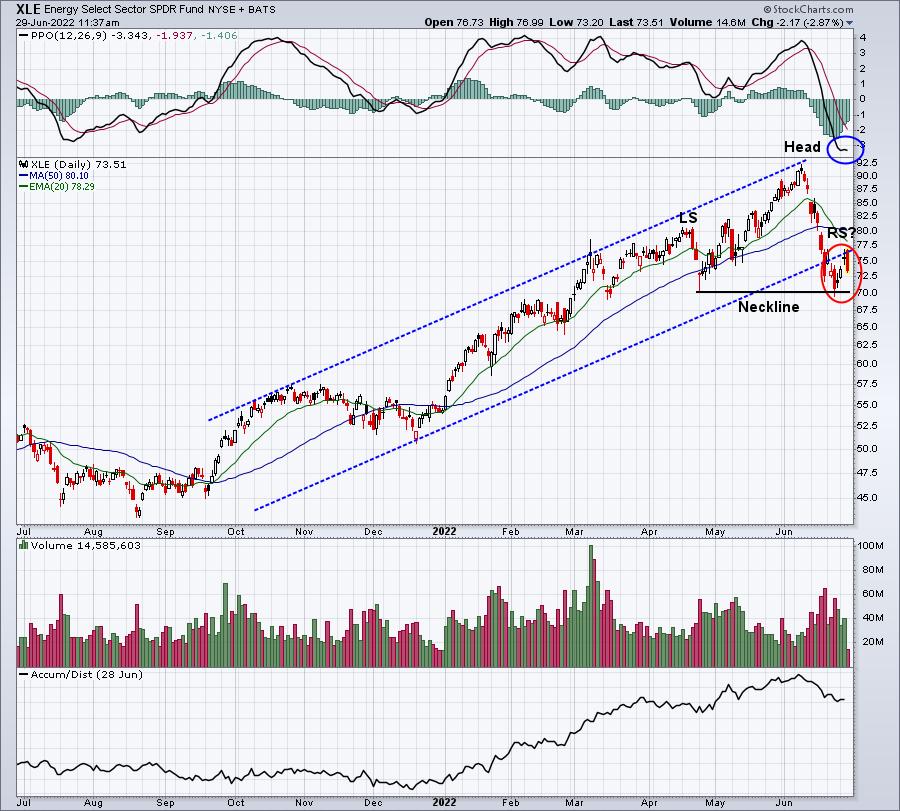
The shallow bounce the past few days hasn't even budged that bearish PPO. Also, I'd have expected any short-term selling to hold onto what should have been channel support. It didn't. Finally, the June low to set the right side of the neckline actually moved a bit lower than the April low. That results in a slightly downsloping neckline, which in my opinion is more bearish. I'd be very, very careful with energy, especially if the XLE closes back beneath 70.
ChartLists/Strategies
I haven't really discussed our scanning strategies much in 2022, because they're bull market scans and we've been in a cyclical bear market. It's time to at least be considering those scans again, especially if I'm correct about a bottom in place. I believe the easiest money - coming off the low with a 5-day equity only put call ratio ($CPCE) above .80 - has been made. But the selling yesterday and this morning aids reward-to-risk setups on the long side. I ran a scan of stocks testing their 20-day EMA (open above, intraday below, current price back above) against the Strong Earnings ChartList (SECL) and here were the 8 that were returned:
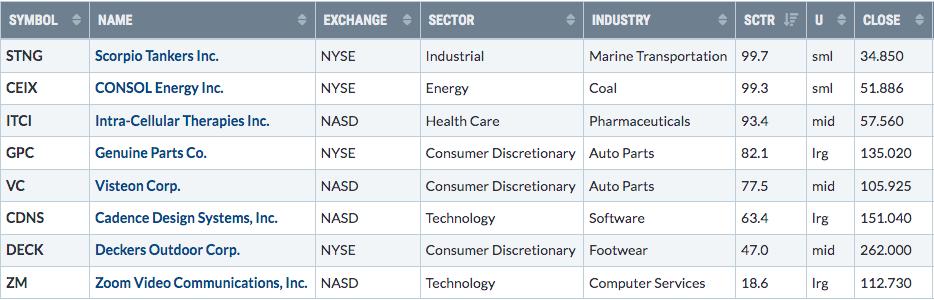
I've discussed ZM at length, so I won't go there today. But I own ZM and it did test its 20-day EMA this morning. I really like CDNS as well, but don't own it at this time. Check out this chart:
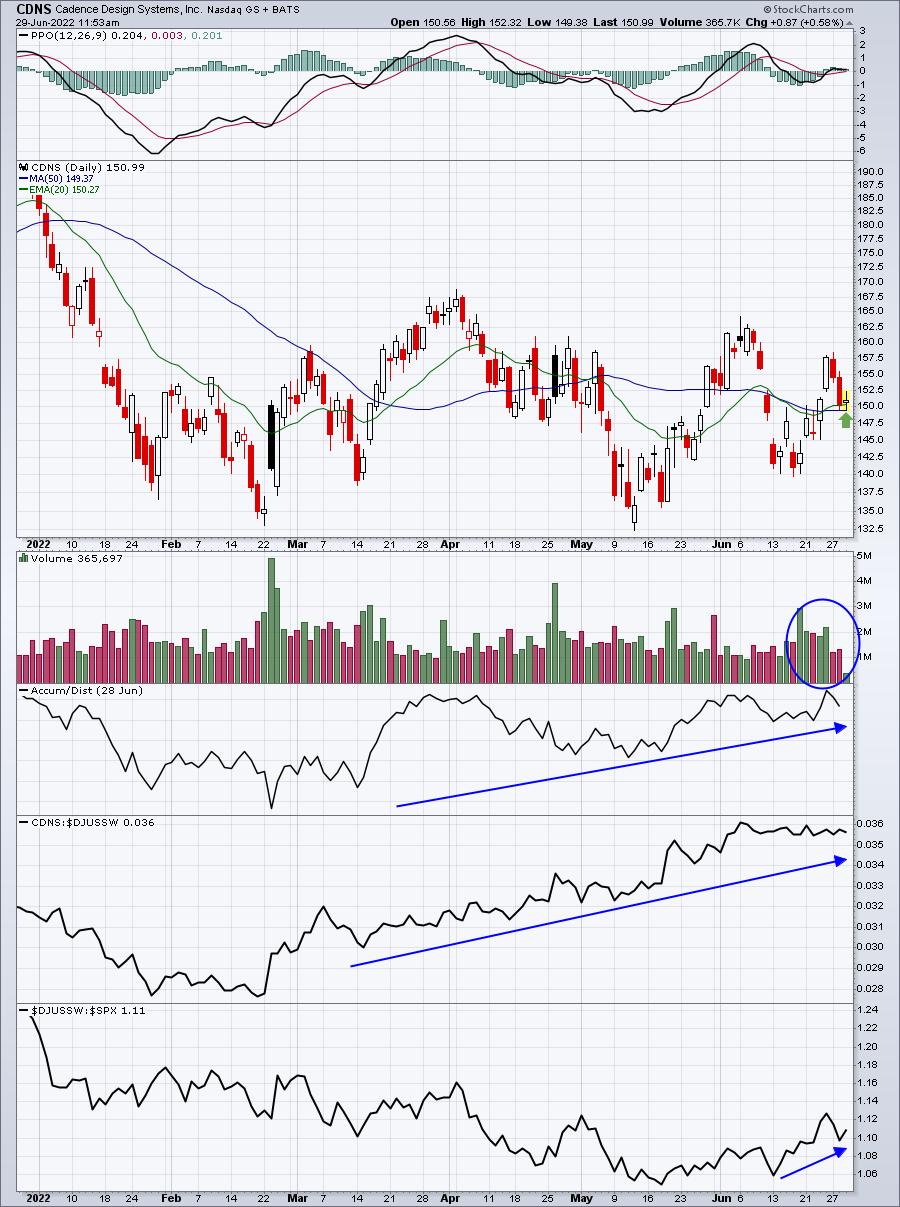
CDNS is a leader in software ($DJUSSW) and the group is just starting to show relative strength. I love the recent volume trends (note that the pullback last two days was on much lighter volume). While I certainly wouldn't give up on CDNS if it closed beneath its 20-day EMA, you could use that as a tight closing stop if you're worried about the stock market rolling over again.
Earnings Reports
Here are the key earnings reports for the next two days, featuring stocks with market caps of more than $10 billion. I also include several companies with market caps below $10 billion. Finally, any portfolio stocks that will be reporting results are highlighted in BOLD. If you decide to hold a stock into earnings, please understand the significant short-term risk that you are taking. Please be sure to check for earnings dates for any companies you own or are considering owning.
Wednesday, June 29:
PAYX, GIS, MKC, MSM, PDCO, DCT, NG, SGH
Thursday, June 30:
MU, STZ, WBA, AYI, SMPL, LNN
Economic Reports
Q1 GDP (Final): -1.6% (actual) vs. -1.4% (estimate)
Happy trading!
Tom