
EB Daily Market Report - Friday, July 1, 2022
Market Closed on Monday, July 4th
The bond and stock markets will be closed on Monday, July 4th in observance of Independence Day. As a result, there will be no Trading Places Live show, no EB Digest, and no Daily Market Report (DMR). It'll be business as usual on Tuesday, July 5th.
I hope everyone enjoys a safe long weekend!
Executive Market Summary
- Futures were weak overnight and our major indices gapped down at the opening bell
- The Volatility Index ($VIX, -5.12%) has been quite volatile, but overall has declined significantly since Thursday morning - a bullish development as fear seems to be diminishing
- The 10-year treasury yield ($TNX) has dropped another 8 basis points to 2.89% after hitting an intraday low of 2.79%
- Falling yields reeks of inflation becoming a non-factor in the second half of the year
- It's a strange sector leaderboard today with consumer discretionary (XLY, +1.03%) sharing the top half of the leaderboard with defensive sectors
- Utilities (XLU, +1.82%) are performing exceptionally well today, while technology (XLK, -0.53%) is currently the only sector in negative territory
- A very weak semiconductor group ($DJUSSW, -4.02%) continues to plague technology
- Micron Technology (MU, -3.82%) reported its latest quarterly results, which exceeded Wall Street estimates; nonetheless, there is selling everywhere in the industry
- MU did guide revenue and EPS estimates lower for next quarter and that's likely what's spooked traders
- Home construction ($DJUSHB, +4.59%) is having a very solid day with the rapidly-falling yields a key contributor
Market Outlook
While the S&P 500 continues descending from its recent June rally, I remain focused on the signals that I believe will help with future direction of U.S. equities. As we've sold off in prior months to set new lows, I think it's important to note that the Volatility Index ($VIX) has been printing lower highs. The VIX is a financial benchmark designed to be an up-to-the-minute market estimate of expected volatility of the S&P 500 Index. In short, the VIX is intended to provide an instantaneous measure of how much the market thinks the S&P 500 will fluctuate in the next 30 days. Volatility is associated with selling, so as the VIX rises, options are priced for BIG moves - potentially in both directions. A topping VIX is very synonymous with market bottoms.
What's very interesting to me is that the VIX hit a 3-day low today, despite more selling the past few days. In other words, it appears that the VIX has already priced in what it believes is the worst selling. First, check out this daily chart of the VIX in 2022:
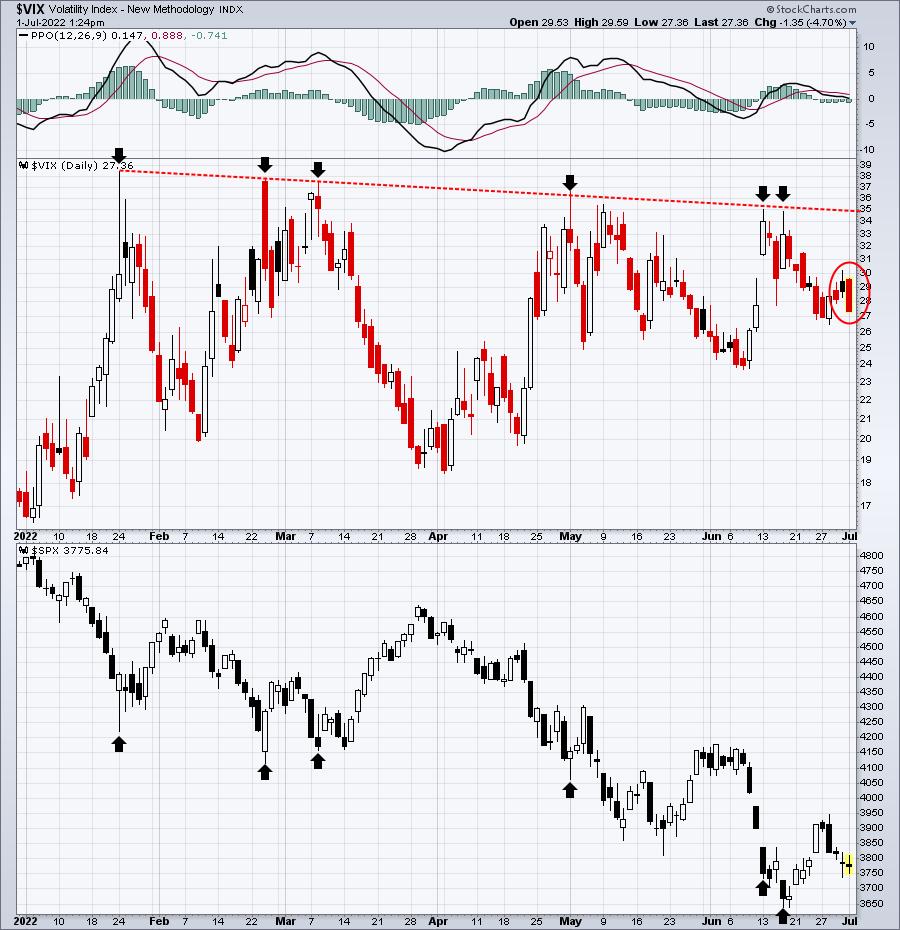
The VIX continues to print lower highs, despite more selling in the S&P 500. But check out the VIX over the last 27 hours or so as we experience more market weakness:
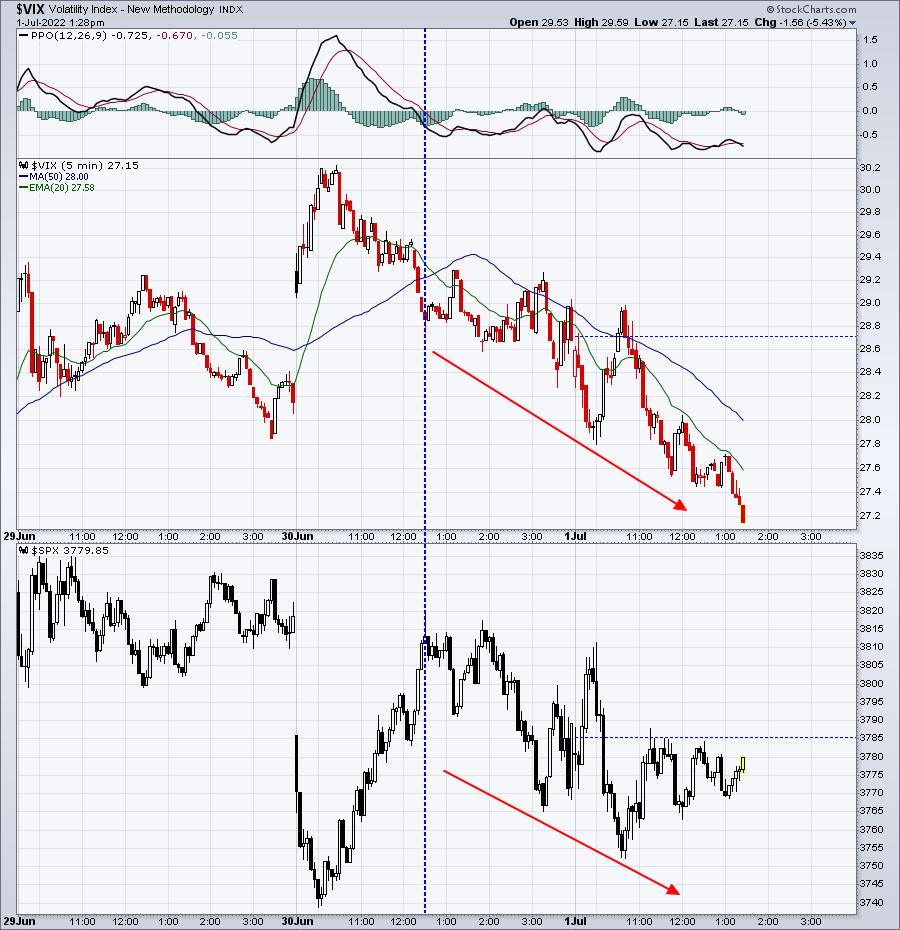
This is REALLY odd behavior in the VIX. Any time fear is coming out of the market, I grow more bullish. It's telling me that the stock market has fully priced in all the bad stuff that we keep hearing about. Keep in mind that the VIX changes constantly and is always pricing in the next 30 days' expected volatility. So I might write something much different about the VIX next week. But right now, that falling VIX is a bullish market development, in my opinion.
Sector/Industry Focus
Have we seen the final low in broadcasting & entertainment stocks ($DJUSBC)? The daily chart shows a very nice positive divergence that would argue for a major bottom:
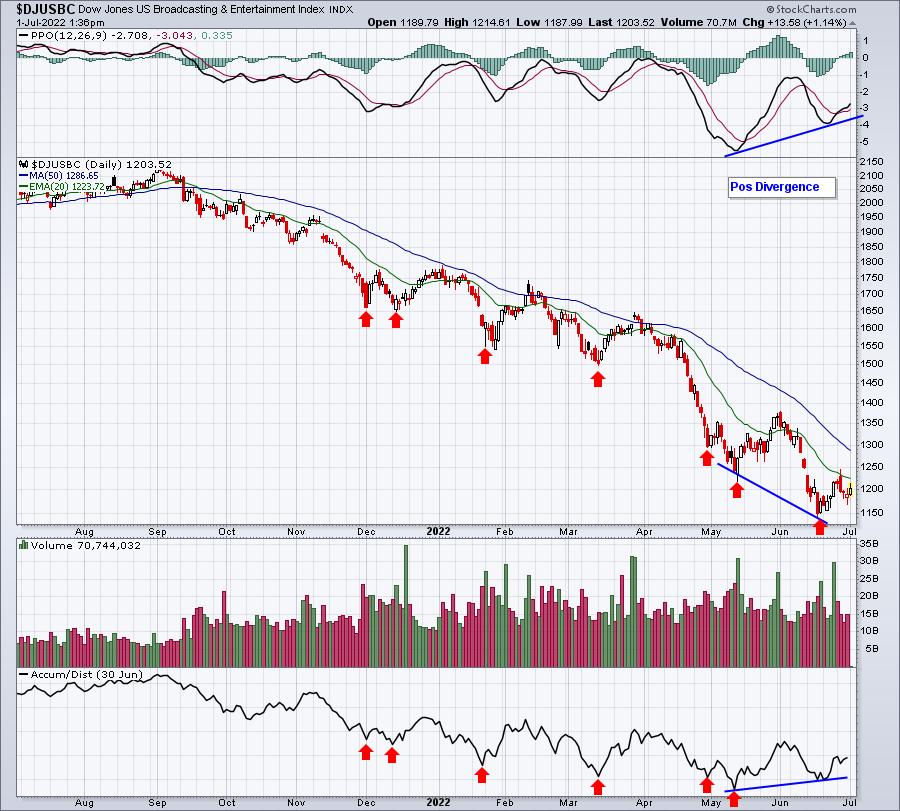
The red arrows show that every price low since December was accompanied by a lower AD line.....until the June low. It appears that Wall Street is now beginning to accumulate the group, so stocks like Walt Disney (DIS), whose price action and AD line look quite similar to the broader index, could represent a very solid entry point for those looking to accumulate on price weakness.
ChartLists/Strategies
We recently updated nearly all of our ChartLists, so I reviewed all 49 stocks on the Bullish Trifecta ChartList (BTCL). Remember, in order to be included on this ChartList, stocks must be on ALL 3 of the following ChartLists:
- Strong Earnings ChartList (SECL) - strong fundamentals
- Strong AD ChartList (SADCL) - signs of strong accumulation
- Raised Guidance ChartList (RGCL) - management confidence
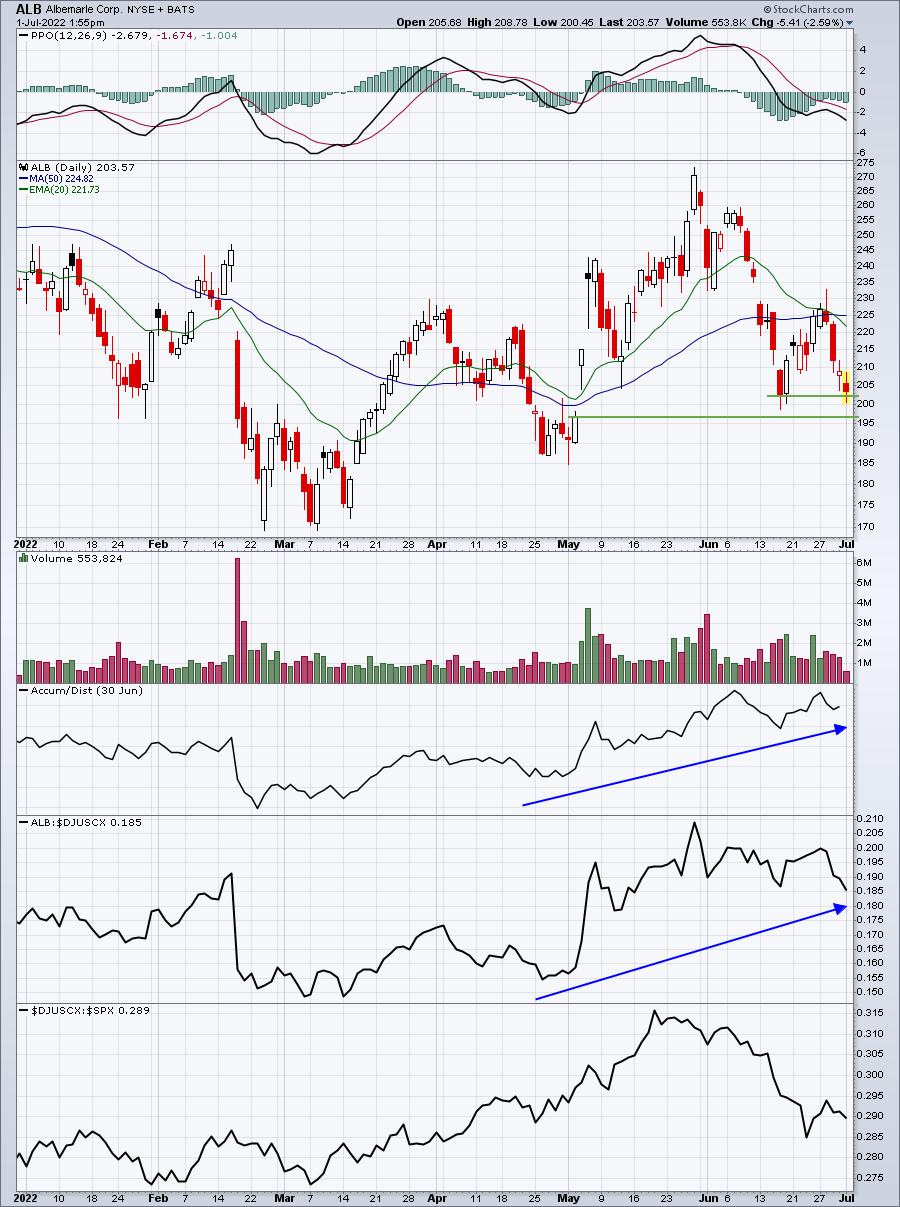
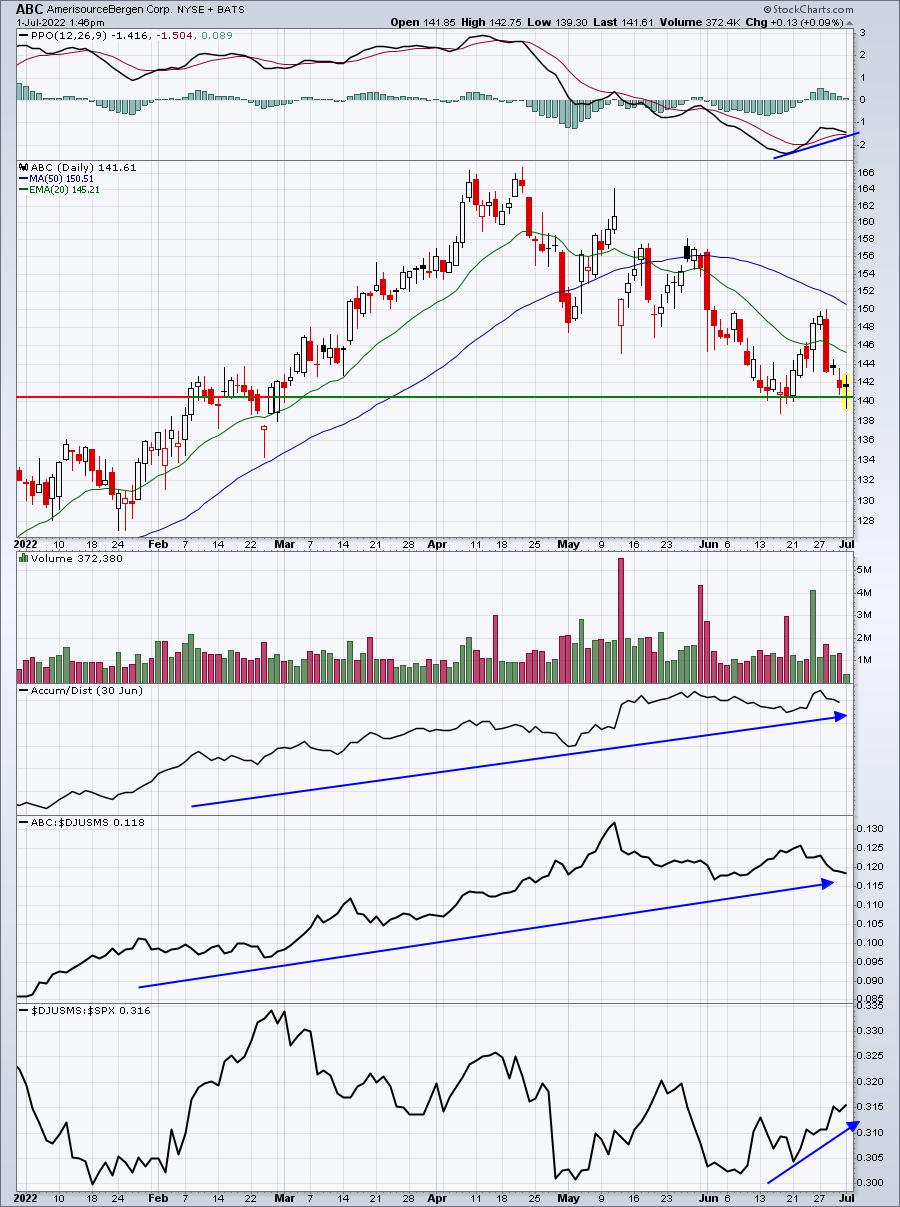
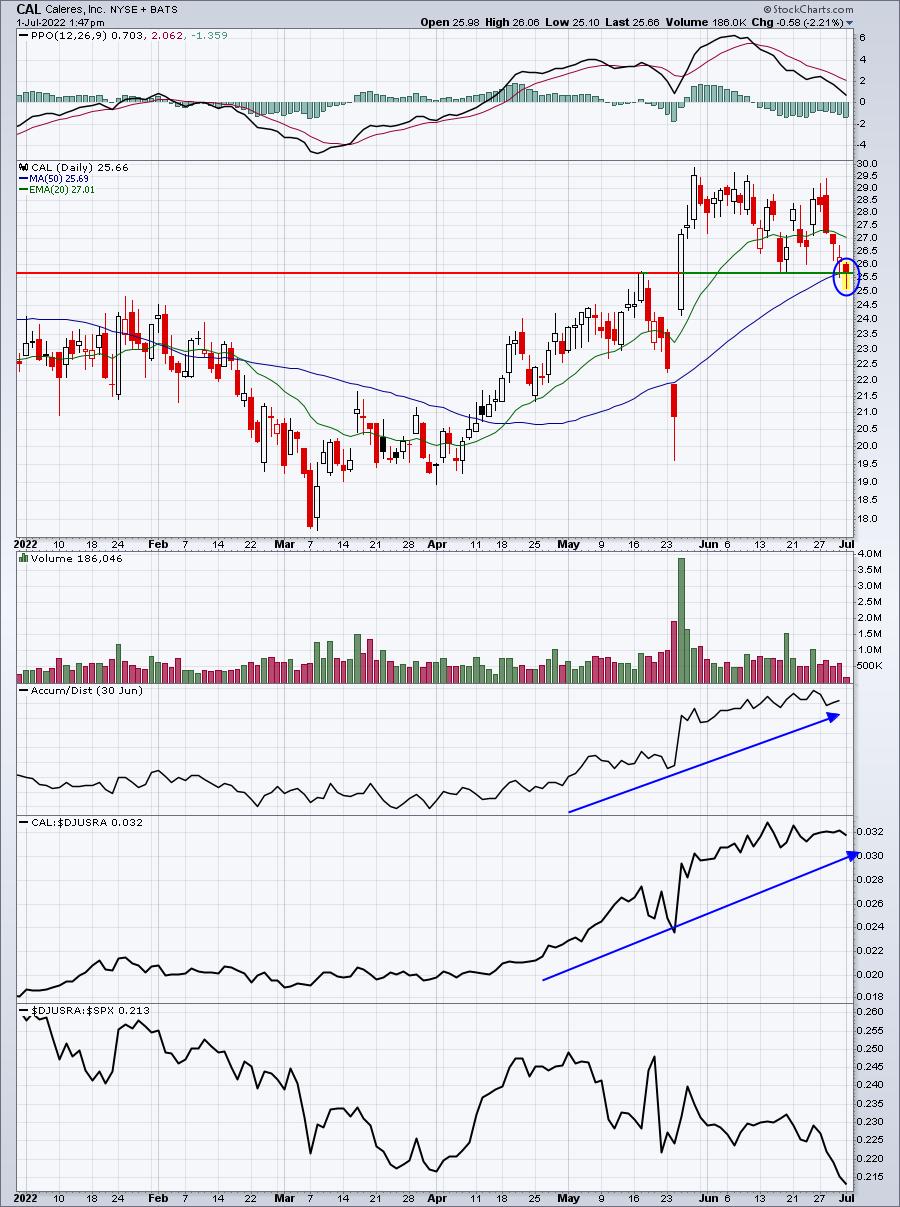
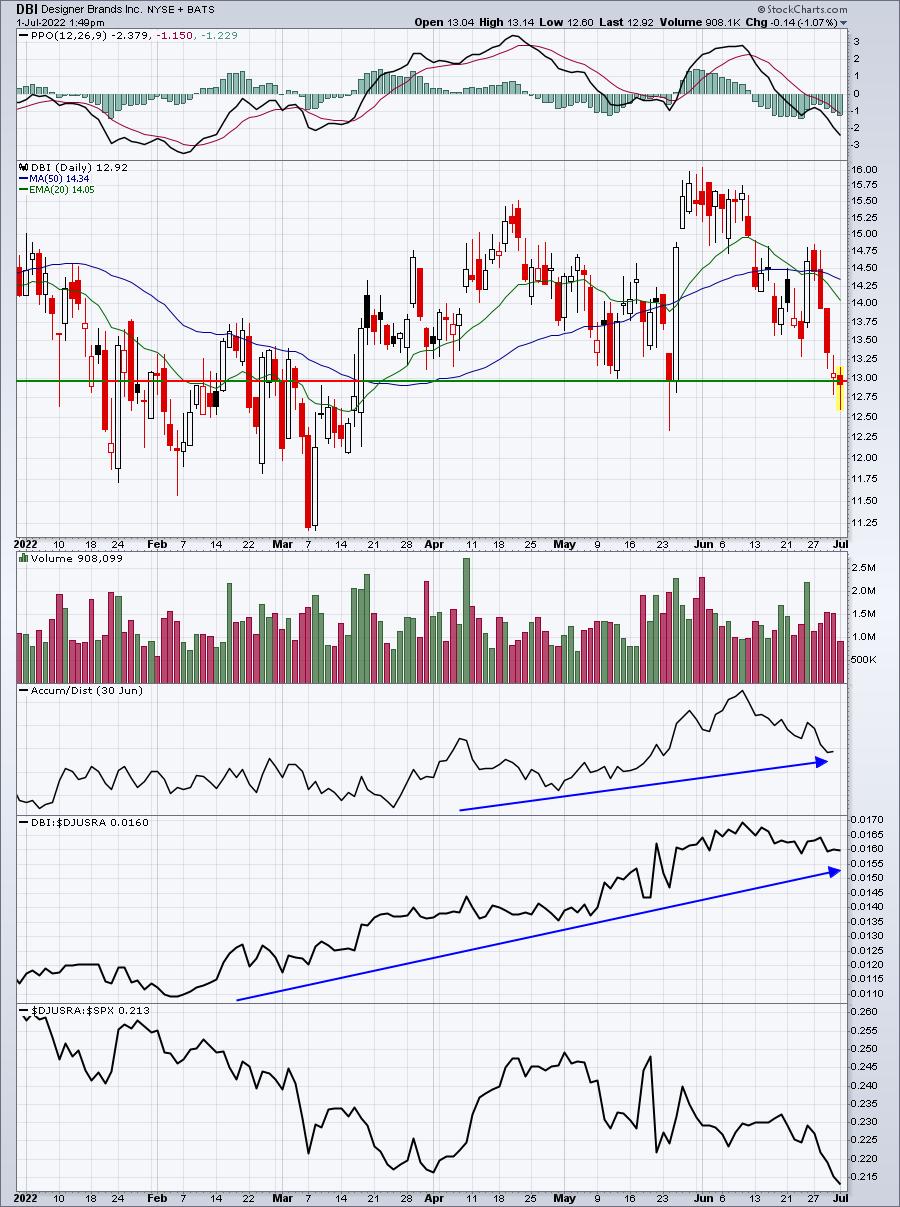
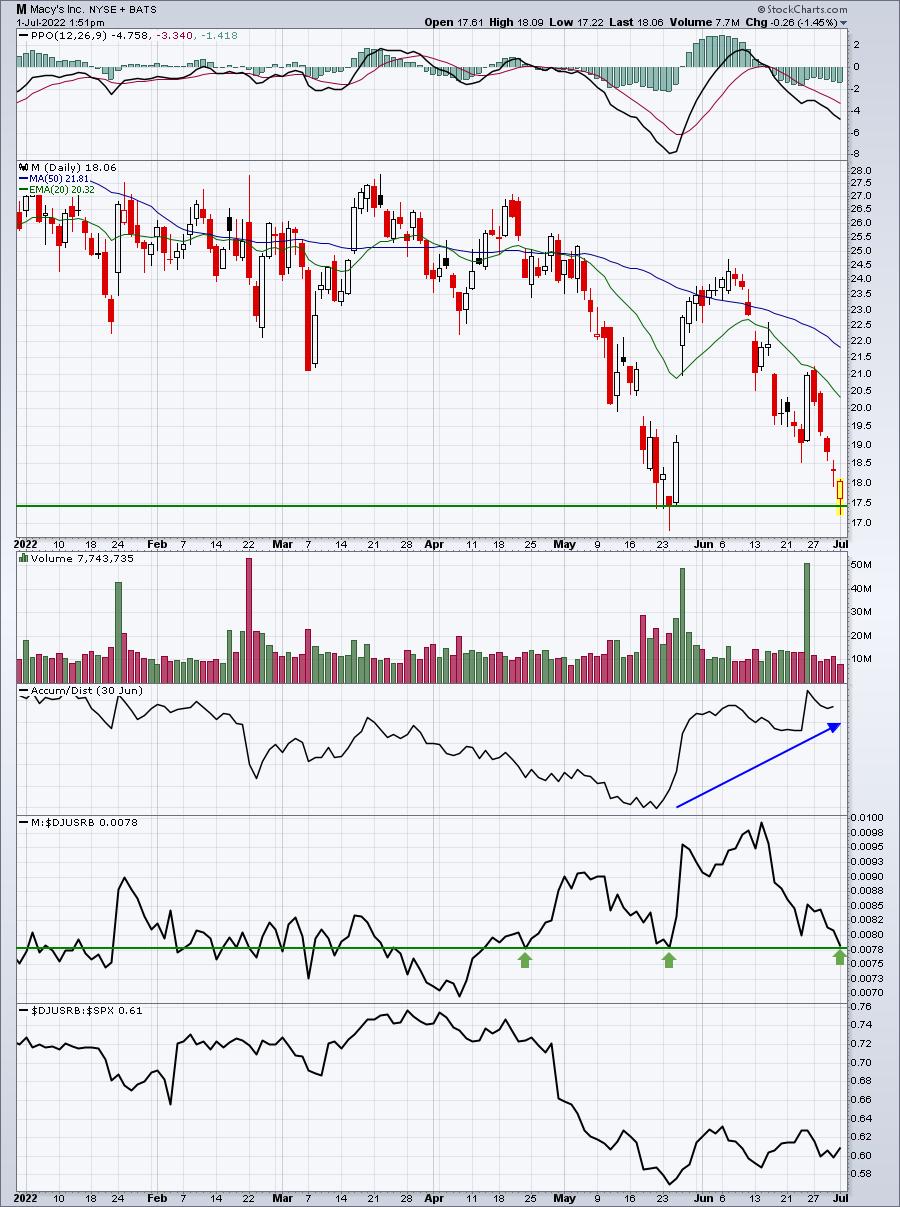
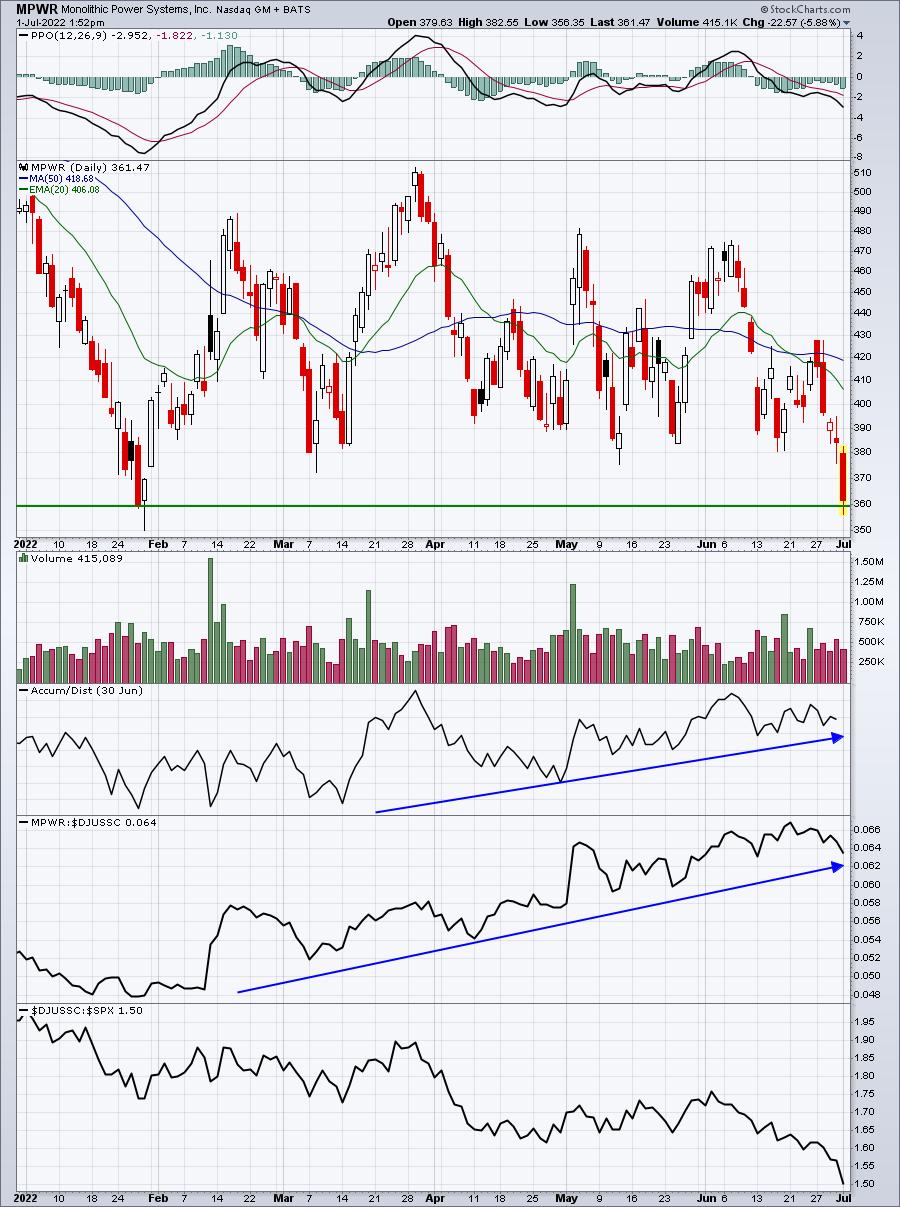
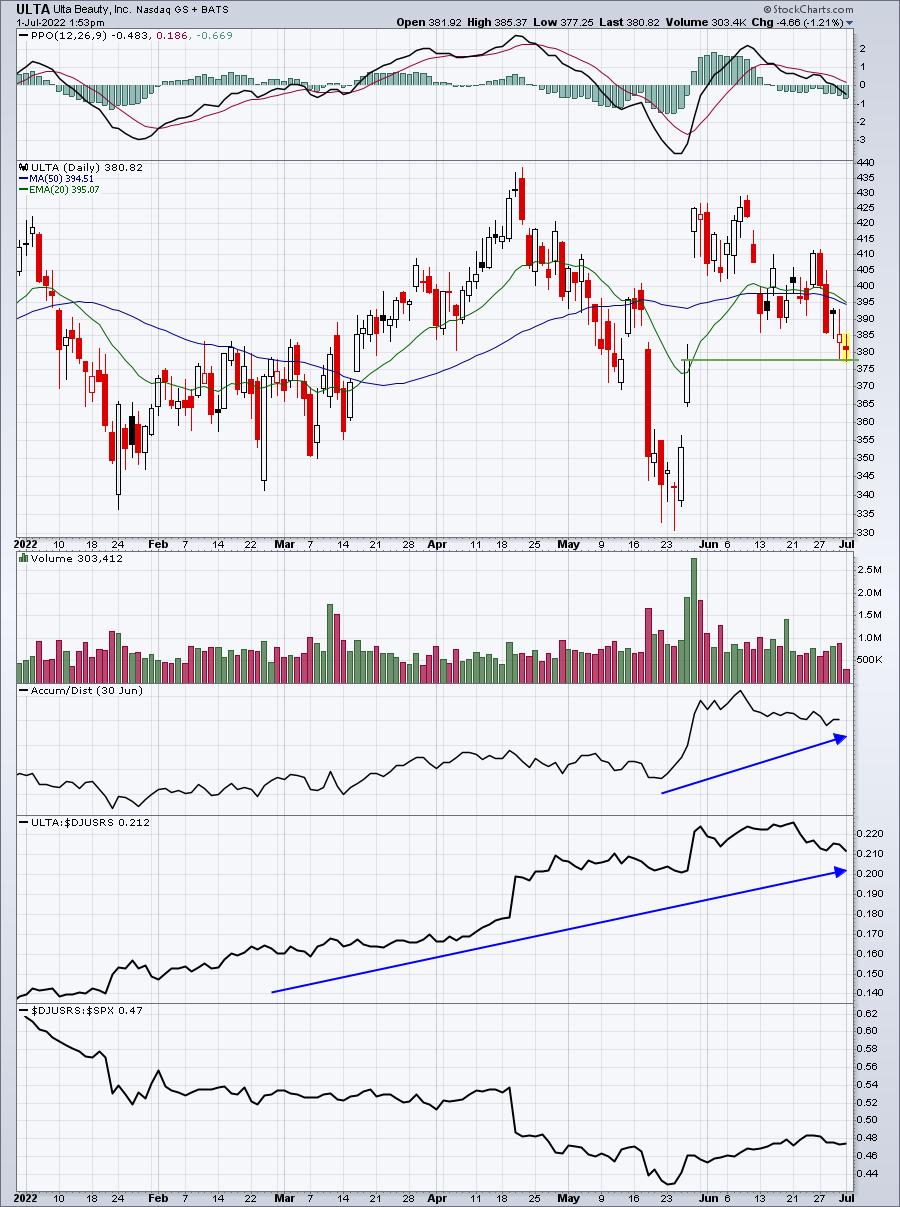
After checking out all 49 charts, here are 7 that are at or nearing key price support and should perform well if the market bounces:
ALB:
ABC:
CAL:
DBI:
M:
MPWR:
ULTA:
Earnings Reports
Here are the key earnings reports for the next two days, featuring stocks with market caps of more than $10 billion. I also include several companies with market caps below $10 billion. Finally, any portfolio stocks that will be reporting results are highlighted in BOLD. If you decide to hold a stock into earnings, please understand the significant short-term risk that you are taking. Please be sure to check for earnings dates for any companies you own or are considering owning.
Friday, July 1:
None
Tuesday, July 5:
None
Economic Reports
June ISM manufacturing index: 53.0 (actual) vs. 55.0 (estimate)
May construction spending: -0.1% (actual) vs. +0.5% (estimate)
Happy trading!
Tom