
EB Daily Market Report - Wednesday, July 6, 2022
July Seasonality Report
I'm currently working on it and should have it out to everyone later today, but definitely no later than tomorrow.
Executive Market Summary
- Futures were relatively flat overnight and into this morning, but our major indices opened slightly positive
- Rotation throughout the day has once again favored the NASDAQ, a signal of further rotation into growth stocks
- Gold ($GOLD, -1.47%) continues falling after breaking below key $1800 support
- Crude oil ($WTIC, -1.22%) is looking to close below $100 per barrel for the 2nd consecutive day
- Natural gas ($NATGAS, -0.18%) is now approximately 45% off of its early-June intraday high
- The 10-year treasury yield ($TNX) is up 11 basis points to 2.92%; I'm watching to see if yield resistance holds in the 2.99%-3.05% area - two key moving averages
- Technology (XLK, +1.20%) is today's best-performing sector, while energy (XLE, -2.05%) tumbles further
- Northrop Grumman (NOC, +3.66%) is bouncing back after a rough Tuesday to lead the S&P 500 higher
- Moderna (MRNA, +2.91%) is also among today's leaders and appears to be regaining its bullish form
Market Outlook
The Fed minutes, as expected, reflected the Fed's strategy of becoming more aggressive if inflation data warrants it. They always talk tough and let the market know they'll do what's necessary. But, in the end, what they do is likely to be much, much different from what they said they were going to do when they began hiking rates. 12 rate hikes? Still hiking in 2023? I just don't see it. I said at the time that they'd never follow through with that type of tightening and nothing has changed my mind. The 1-month treasury yield ($UST1M) appears to be approaching what I believe will be a top:
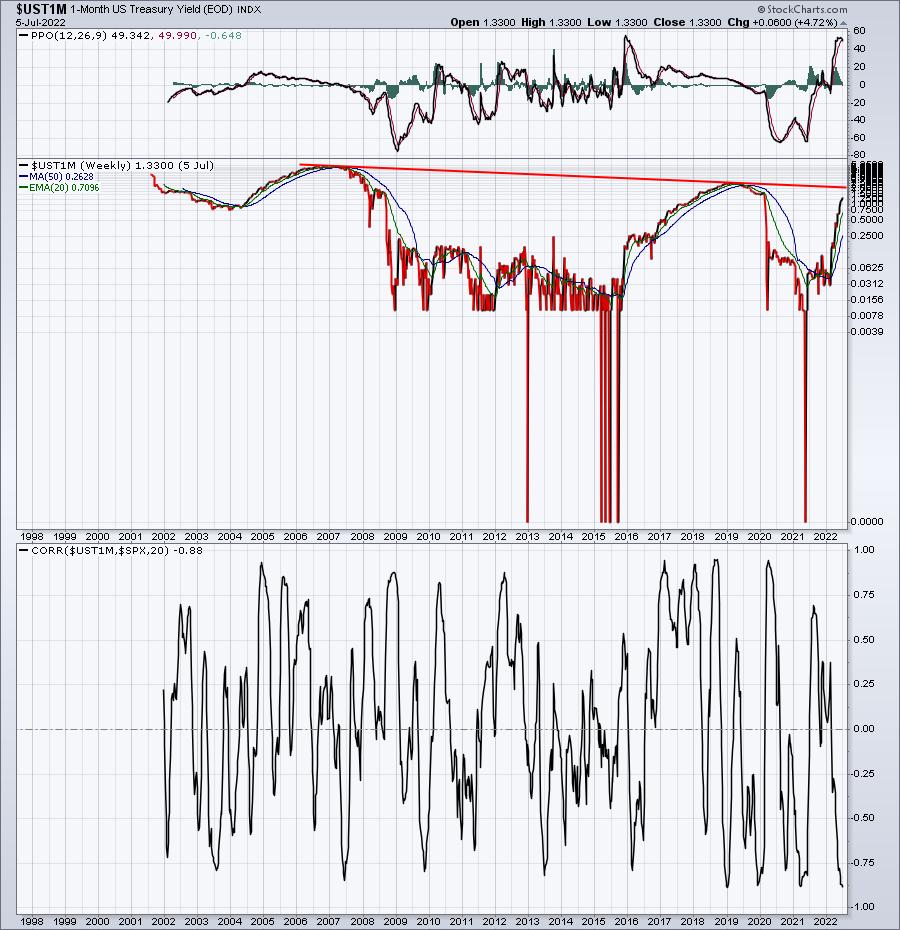
That doesn't mean a whole lot for the direction of the stock market as you can see from the correlation in the bottom panel. The direction of the UST1M doesn't seem to have much reliable correlation either way over a 20-week period.
Sector/Industry Focus
While the UST1M doesn't provide the overall market any type of directional clues, how it relates to the 10-year treasury yield ($UST10Y) does influence the direction of bank stocks quite considerably. Check out this chart of the yield spread ($UST10Y minus $UST1M):
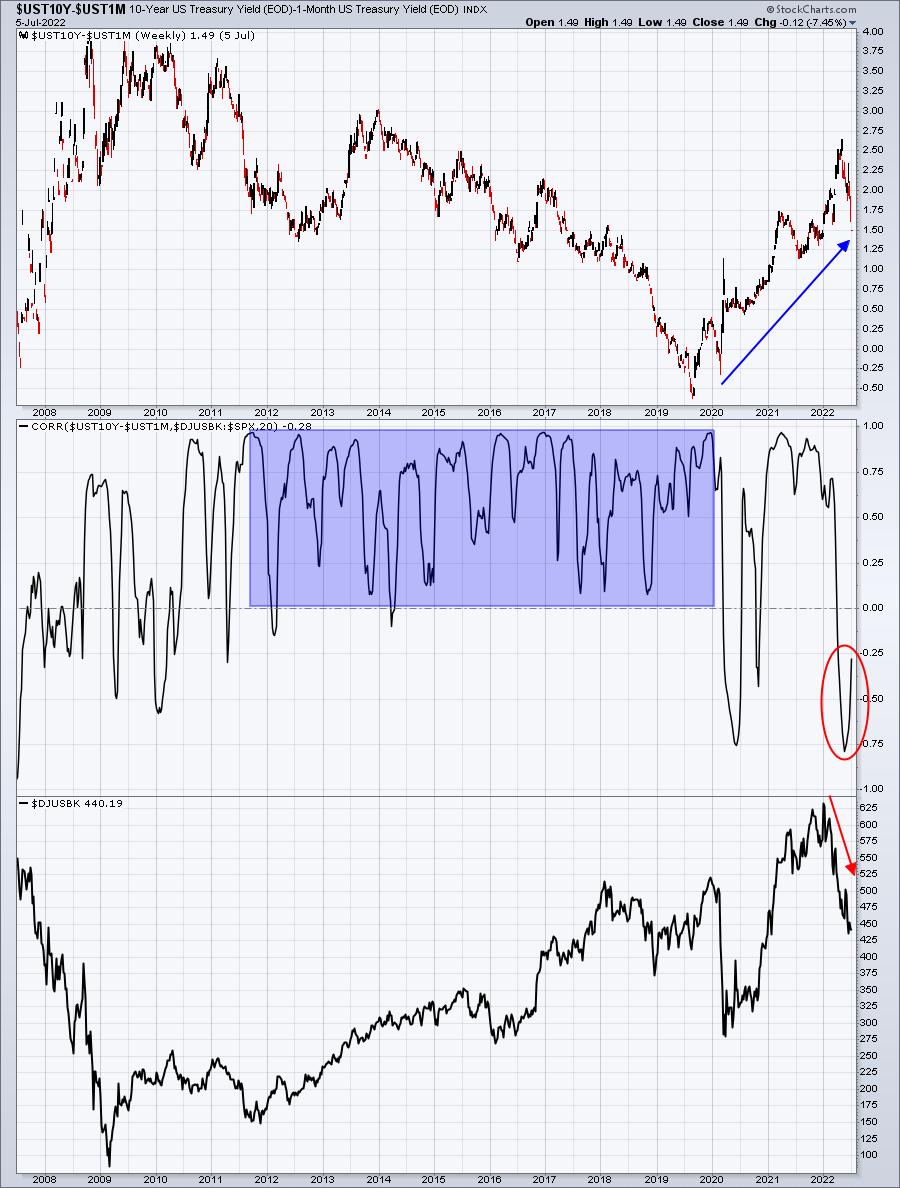
The blue-shaded area shows that there tends to be excellent positive correlation between the direction of the yield spread and the RELATIVE direction of banks (vs. the S&P 500). That relationship hasn't really held true since the pandemic began, but MANY relationships have been skewed because of the pandemic. I think history tells us that this yield spread can help us with relative performance of banks and that relationship the past couple years has been HIGHER. Don't be shocked to see the banks have a very strong 2nd half of the year.
ChartLists/Strategies
Let me give you one more growth stock that seems to be turning the corner right now. I provided 5 stocks that I believed had bottomed on StockCharts.com TV's "Your Daily 5" maybe a month or so ago. One stock was Bumble (BMBL). It's been showing very bullish signals and today appears to be breaking out:
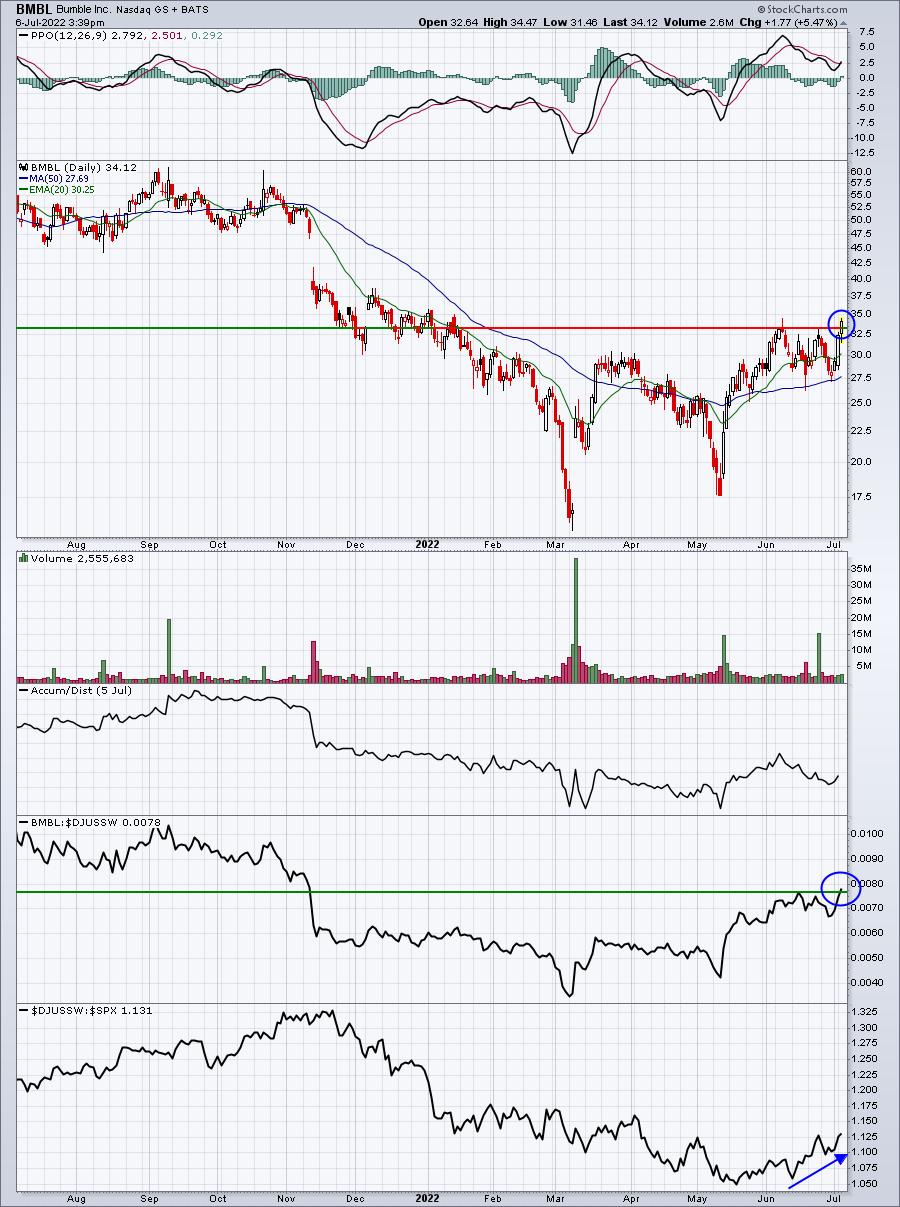
BMBL is breaking out on an absolute and relative basis AND its peer group - software ($DJUSSW) is showing relative strength. Catching a leader in a suddenly improving group can yield excellent results. I like BMBL, but do not own it right now. I may buy it on its next pullback, however.
Earnings Reports
Here are the key earnings reports for the next two days, featuring stocks with market caps of more than $10 billion. I also include several companies with market caps below $10 billion. Finally, any portfolio stocks that will be reporting results are highlighted in BOLD. If you decide to hold a stock into earnings, please understand the significant short-term risk that you are taking. Please be sure to check for earnings dates for any companies you own or are considering owning.
Wednesday, July 6:
SLP
Thursday, July 7:
LEVI, HELE, WDFC
Economic Reports
June ISM services: 55.3 (actual) vs. 54.8 (estimate)
FOMC minutes released at 2pm ET
Happy trading!
Tom