
EB Daily Market Report - Friday, July 8, 2022
Executive Market Summary
- Futures were weak overnight and a stronger-than-expected jobs report added early selling pressure to our major indices after opening gaps lower
- Resiliency has been a theme today, however, as our major indices are currently higher
- Crude oil ($WTIC, +2.20%) is up to $105 per barrel, still well below the highs we saw back in March, but also it's distancing itself from key support at $93 per barrel
- The June nonfarm payrolls topped expectations at 372,000 (vs. 270,000 estimate), sending the 10-year treasury yield ($TNX) up 10 basis points to 3.10%
- Cryptocurrencies are finishing off a very solid week where bitcoin ($BTCUSD) jumped nearly 13% and earlier pierced the 22000 level for the first time in 3-4 weeks
- Health care (XLV, +0.68%) and energy (XLE, +0.46%) are the two leading sectors in a bifurcated market where 5 sectors are lower
- Materials (XLB, -0.43%) is the worst-performing sector
Market Outlook
My preference for this morning's jobs report would have been a positive number, but one that was lower than expected. That would have gone along with the soft landing narrative and also would have put inflation even further back in the rear view mirror. Instead, the jobs came in above expectations. From there, it's all about reading the tea leaves. As we should expect, the higher number sent traders OUT of bonds, which in turn results in higher yields. The 10-year treasury yield ($TNX) is up 9 basis points to 3.10%, easily surpassing both its 20-day EMA and 50-day SMA. Yet, despite all this, our sustainability ratios continue to rise along with the S&P 500:
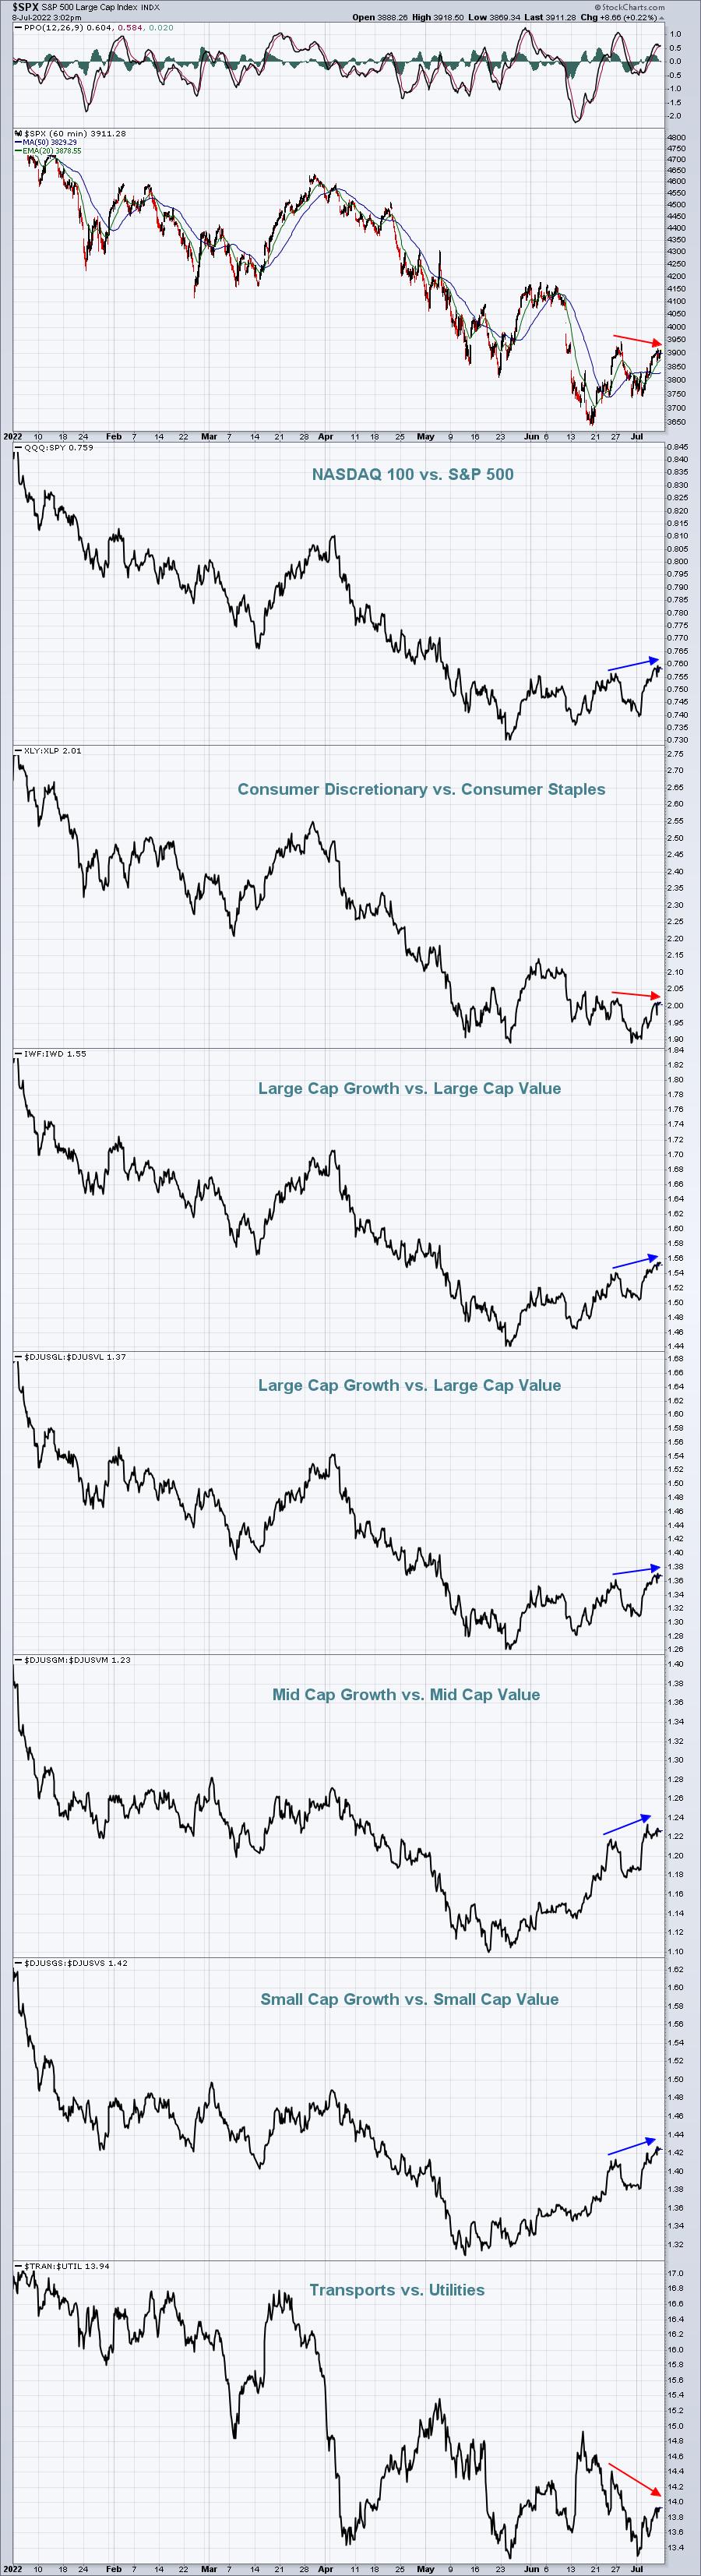
If we just compare the last two weeks, the S&P 500 is lower, but most of our sustainability ratios are higher. Money continues to rotate into growth. The XLY:XLP is lower over the past two weeks, but it has continued to hold onto its key relative support level from May.
Sector/Industry Focus
I've discussed the Volatility Index ($VIX) on several occasions recently and it's continuing to drift lower and lower. Remember, a lower VIX tells us that Wall Street is expecting LOWER volatility ahead and lower volatility is rather synonymous with higher equity prices. Check out this relationship recently:
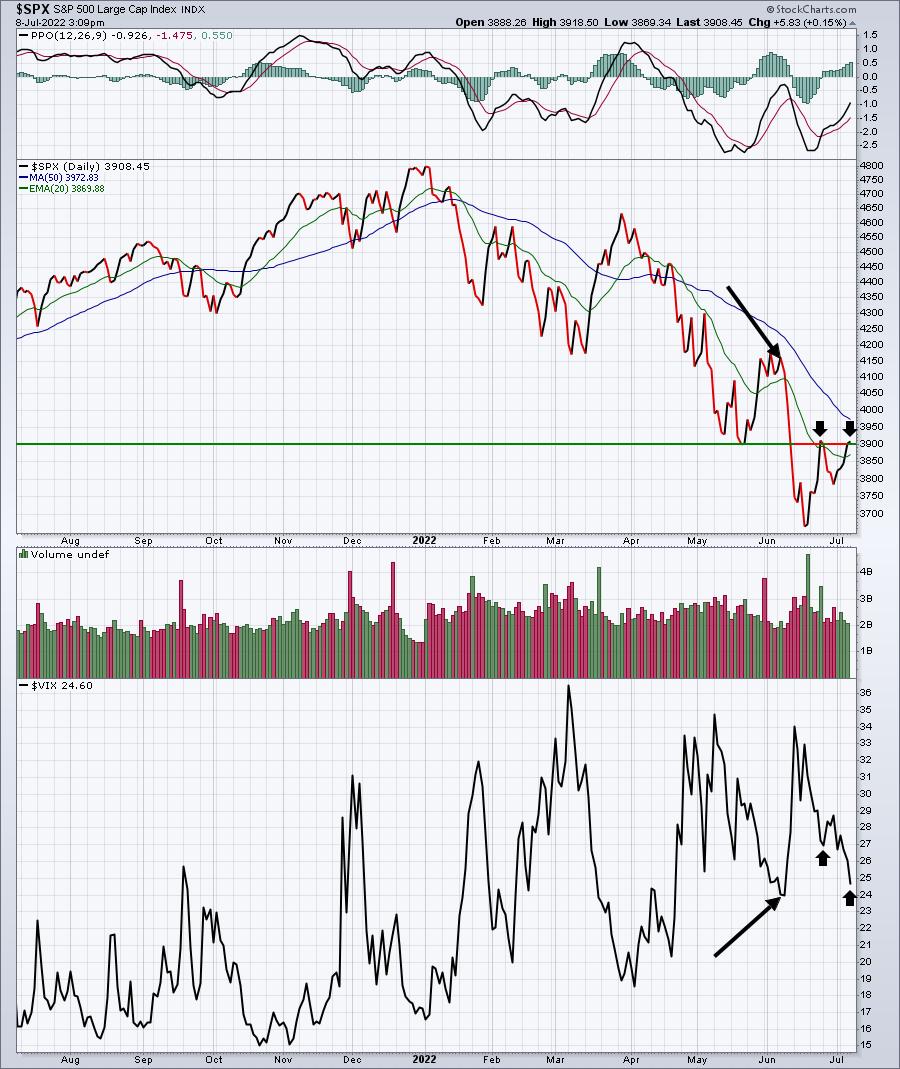
The black arrows compare the S&P 500 to the last time it was at this level - just a couple weeks ago. Now look at the VIX, well below where it was before. Fear is dissipating. This is becoming a much more bullish market environment, but those who simply want to remain convinced that we're still in a bear market won't be able to see it. Listen, there is NO GUARANTEE that the stock market has bottomed, but we're getting plenty of signals that that is exactly the case.
ChartLists/Strategies
Let's talk strategy.
From the S&P 500 low of 3636.87 on Friday, June 17th through today's high of 3918.50, the S&P 500 has risen 7.74%. Given the positive divergences, short-term sentiment signals, including the 5-day moving average of the equity only put call ratio ($CPCE) hitting a high of .825, the bullish historical period (3 weeks leading up to the start of earnings season), and the bullish sustainability ratios, this has been somewhat as I would have expected. Moving higher from here is likely to take much more effort and it will be much more important to the long-term picture and the resumption of the secular bull market that began in April 2013. I've been much more aggressive personally over the last 3-4 weeks after announcing that I believed the market bottom was in. Sometimes we see "V-shaped" bottoms and move straight back through key resistance levels and important moving averages. Other times, it takes much more time and effort, including dizzying back-and-forth action that will test your bull market faith.
I don't know which of these we're setting up for. But my strategy remains bullish, though I'm much less aggressive right now. I had been trading the QLD, a leveraged ETF that tracks the NASDAQ 100 index ($NDX) at a 2 to 1 clip. Recently, after the semiconductors were obliterated, I even purchased SOXL, another leveraged ETF, this one tracking semiconductors at a 3 to 1 clip. I have sold ALL of my leveraged ETFs and plan to trade a bit more defensively to see if we clear certain price and moving average obstacles.
On the NASDAQ, there are 3 levels to watch, as follows:
- 50-day SMA, currently at 11659.52 (surpassed it intraday, but beneath it now)
- gap resistance from June 9th at 11,754.23
- the June 2nd close at 12,316.90
We've moved more than 1000 points off the NDX bottom, now we need to do a bit more watching rather than trading - just my opinion. I do believe we go higher, but from a trading perspective, it wouldn't be crazy to see the current advance stall here for a bit.
Earnings Reports
Here are the key earnings reports for the next two days, featuring stocks with market caps of more than $10 billion. I also include several companies with market caps below $10 billion. Finally, any portfolio stocks that will be reporting results are highlighted in BOLD. If you decide to hold a stock into earnings, please understand the significant short-term risk that you are taking. Please be sure to check for earnings dates for any companies you own or are considering owning.
Friday, July 8:
None
Monday, July 11:
ETWO, GBX, AZZ
Economic Reports
June nonfarm payrolls: 372,000 (actual) vs. 270,000 (estimate)
June private payrolls: 381,000 (actual) vs. 228,000 (estimate)
June unemployment rate: 3.6% (actual) vs. 3.6% (estimate)
June average hourly earnings: +0.3% (actual) vs. +0.3% (estimate)
Happy trading!
Tom