
EB Daily Market Report - Friday, July 15, 2022
Executive Market Summary
- Futures were higher overnight and, after a brief pullback with the retail sales report, accelerated higher into the opening bell
- June retail sales came in slightly higher than expectations
- 10 of 11 sectors are higher, led by financials (XLF, +2.91%); banks ($DJUSBK, +4.29%) are having a very strong session after a miserable day on Thursday
- Health care providers ($DJUSHP, +3.67%) are also strong today, led higher by Unitedhealth Group (UNH, +5.01%), which easily beat its consensus estimates and raised its forecast
- The crypto rally continues today as etherium ($ETHUSD, +3.14%) trying to clear 1250, which would represent a 1-month high
- Gold ($GOLD) is down fractionally and threatening to close below $1700 an ounce; that would be its lowest close since Q1 2021
- Crude oil ($WTIC, +2.70%) is approaching $100 per barrel, with key price support also nearby at $93
- Citigroup (C, +10.60%) and Wells Fargo (WFC, +6.84%) are the top two performers in the S&P 500 after released their latest quarterly results
Market Outlook
Earnings season is picking up its pace and more key large central banks reported quarterly results this morning with Bank of America (BAC) joining the earnings parade on Monday morning. Among those that reported today, Wells Fargo (WFC, +6.92%) missed its quarterly EPS estimate (as did JP Morgan yesterday), but the WFC reaction today was much different than JPM. It's having a big day, but hitting key short-term price resistance, as reflected on this 1-month hourly chart:
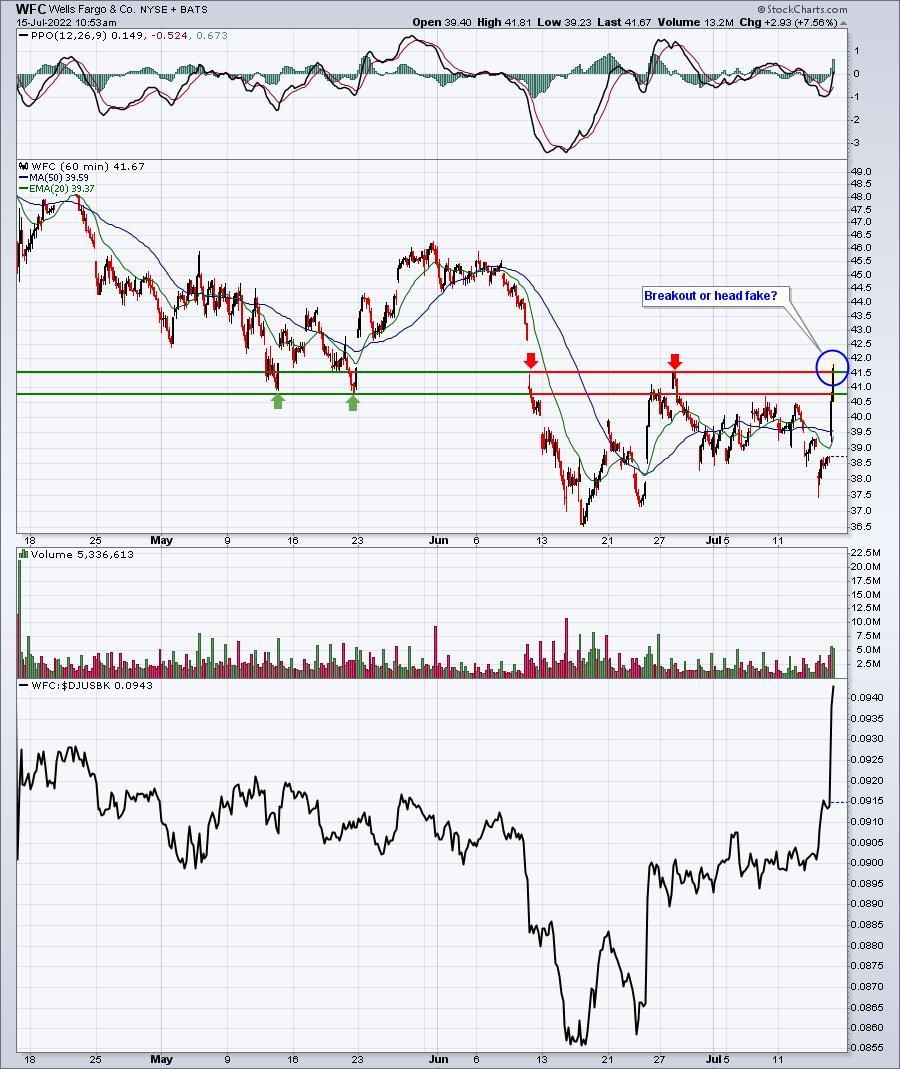
The bottom panel shows WFC now seriously outperforming its banking peers, but will the absolute strength today forge a breakout? If so, I believe that bodes well for WFC's relative performance as we move throughout the summer months.
I maintain my bullish stance on the overall market, BUT I will offer up one short-term warning. The July 17th to July 23rd period, which encompasses the entirety of next week is the second worst week of the year historically on the S&P 500. This dates back to 1950. It doesn't mean that we always go lower and I'm certainly not trying to paint an overly bearish picture, but it's historical fact. Because I remain bullish, I will likely be long next week, but I will not use leverage at all in the week ahead. That's the primary precaution that I'll be taking.
The aforementioned period has produced annualized returns on the S&P 500 of -19.22% since 1950. That's significant enough for me to at least recognize it. The NASDAQ has performed even more poorly over this period, with an annualized return of -37.00% since 1971. Again, it doesn't mean we'll go lower next week, but it does suggest the risk is higher.
Sector/Industry Focus
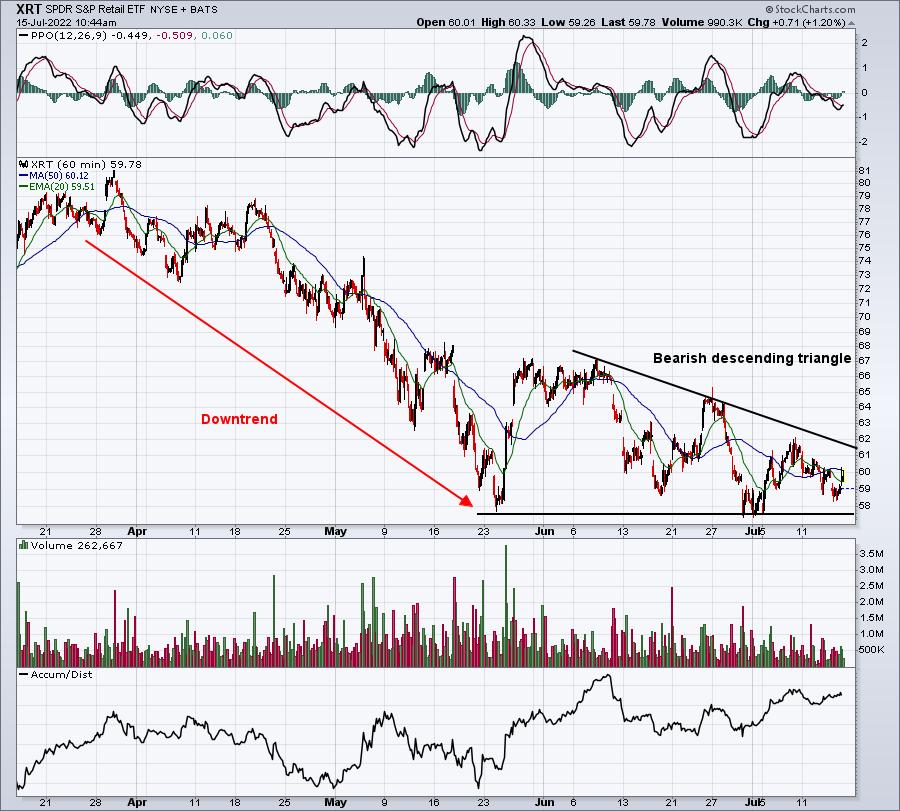
Retail sales came in a bit stronger than expected this morning (numbers below under Economic Reports section) and we're seeing a positive reaction currently. Technically, however, the XRT (widely-diversified retail ETF) has a lot of work to do. If I pull up a 3-month hourly chart on the XRT, I see a downtrend with a bearish continuation pattern (descending triangle). A break of support near 57.50-58.00 would be bearish confirmation:
ChartLists/Strategies
One of the most interesting earnings reports of this quarter will be released on Monday after the closing bell. International Business Machines (IBM), or "Big Blue", reports its latest results and the reason I find it so interesting is that it's been an outperformer in 2022 AND it's fairly close to a MAJOR long-term price resistance level. Will Big Blue finally make the leap and breakout from a lengthy period of consolidation, where it's trailed the major indices by a wide, wide margin? Or is this recent run up in price and relative strength just the latest tease and head fake? Here's the chart:
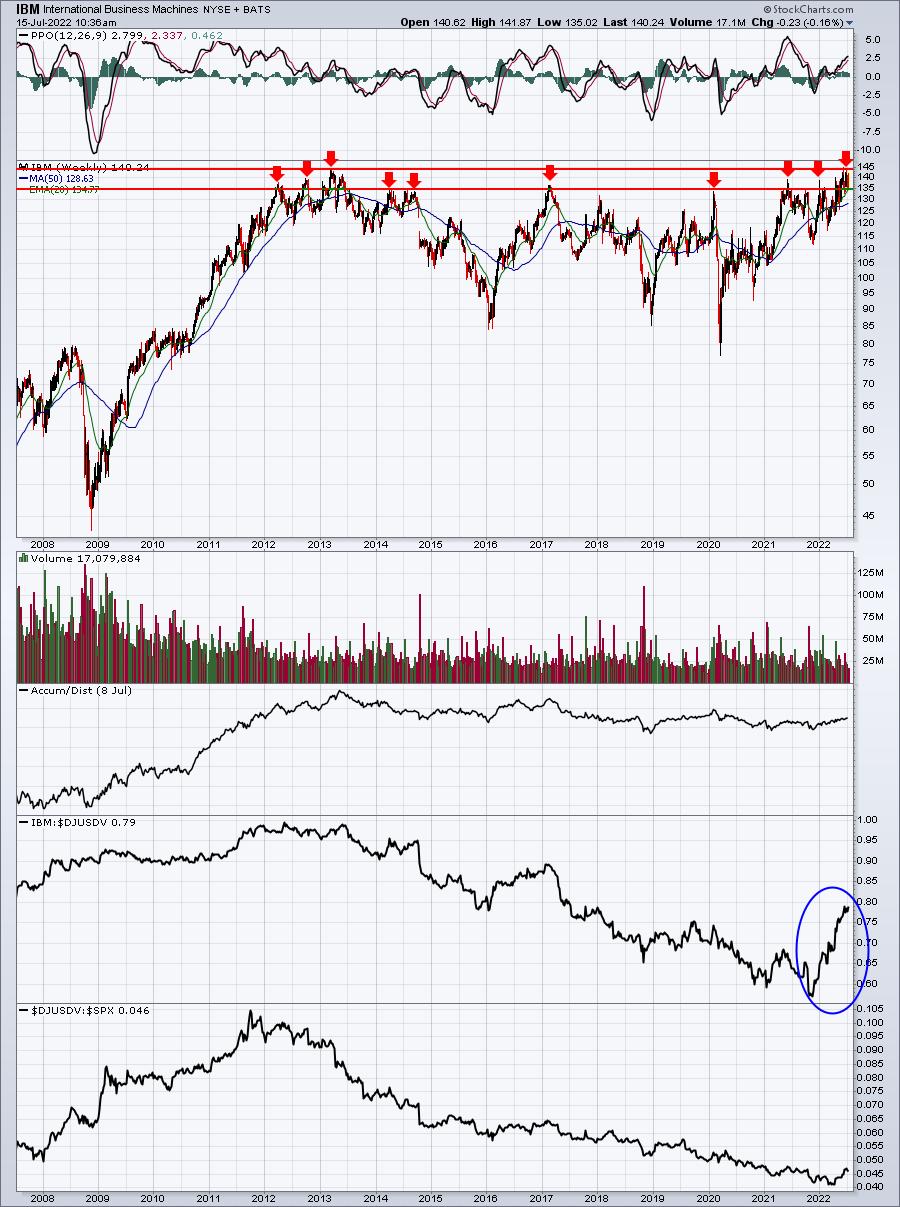
I count 10 failures (red arrows) in the 135-145 price range. The one very bullish piece of news, however, is the sudden surge in relative strength. Is this telling us something about a possible blowout report? We'll find out on Monday.
Earnings Reports
Here are the key earnings reports for the next two days, featuring stocks with market caps of more than $10 billion. I also include several companies with market caps below $10 billion. Finally, any portfolio stocks that will be reporting results are highlighted in BOLD. If you decide to hold a stock into earnings, please understand the significant short-term risk that you are taking. Please be sure to check for earnings dates for any companies you own or are considering owning.
Friday, July 15:
UNH, WFC, BLK, C, USB, PGR, PNC, BK, STT
Monday, July 18:
BAC, IBM, SCHW, GS, PLD, SYF, ELS
Economic Reports
June retail sales: +1.0% (actual) vs. +0.9% (estimate)
June retail sales less autos: +1.0% (actual) vs. +0.6% (estimate)
July empire manufacturing index: 11.1 (actual) vs. -1.3 (estimate)
June industrial production: -0.2% (actual) vs. +0.1% (estimate)
June capacity utilization: 80.0% (actual) vs. 80.4% (estimate)
Happy trading!
Tom