
EB Daily Market Report - Monday, July 18, 2022
Sneak Preview - Q2 Earnings
At 4:30pm ET today, I'll be hosting our Q2 Earnings - Sneak Preview event. I'll be looking ahead to upcoming earnings reports, trying to uncover the most likely blowout earnings reports, while simultaneously searching for companies that I'd avoid heading into earnings reports. Hopefully, you'll be able to join me. If not, we'll record the event so that you can check out the recording at your leisure and when time permits.
Executive Market Summary
- Futures were solidly higher to open the week, but there's been mostly selling throughout today's session
- All of our major indices have turned red and it's noteworthy that this week is the 2nd worst week of the year historically
- The July market housing index fell WAY SHORT of expectations - more on that below
- Energy (XLE, +2.35%) has held onto gains today, but everything else has been deteriorating
- Health care (XLV, -1.97%) is today's weakest sector, followed by utilities (XLU, -0.86%) and real estate (XLRE, -0.83%)
- Biotechnology ($DJUSBT, -2.66%) is being hit particularly hard as the group tests its 50-day SMA
- Apple, Inc. (AAPL, -1.98%) failed at short-term price resistance at 151 earlier and has turned lower, taking the computer hardware group ($DJUSCR, -1.91%) with it
- Crude oil ($WTIC, +4.74%) is back above $102 per barrel, lifting the energy sector
- Cryptos are off earlier highs, but still are holding solid gains; bitcoin ($BTCUSD) is up 635, or just over 3%
- Freeport-McMoran (FCX, +6.41%) and Carnival Corp (CCL, +6.15%), two of our max pain stocks from last week, are leading the S&P 500
Market Outlook
We're seeing a pretty big reversal this afternoon off of an uptrend and key sustainability ratios appear to be rolling over as well. That tells me to be a bit more defensive, especially considering this is the 2nd worst week of the year historically for the S&P 500 (since 1950). First, check out the test of price resistance on the NASDAQ:
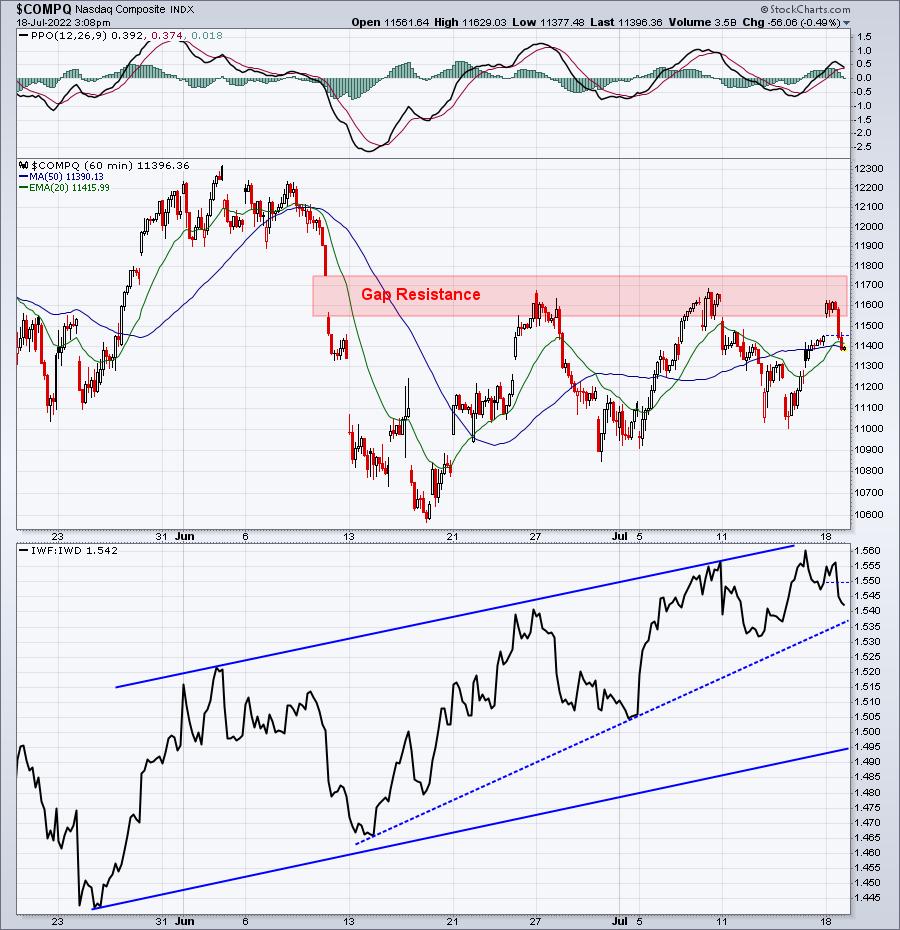
The bottom panel highlights growth vs. value (IWF:IWD) and it's clearly trending higher the past 2 months - that's a bullish development. But some profit taking wouldn't be a horrible thing and we should at least consider that possibility this week.
Sector/Industry Focus
This morning, the July housing market index dropped like a rock from 66 to 55. I've been watching this report for a long time and that is a MAJOR move. The consensus range was very tight from 64 to 66. No one was looking for that type of deterioration and it's one more indication that the recession is here. While the news was clearly bad, my belief is that the stock market has already priced this in. How else can you explain the home construction index ($DJUSHB) reacting today the way it did?
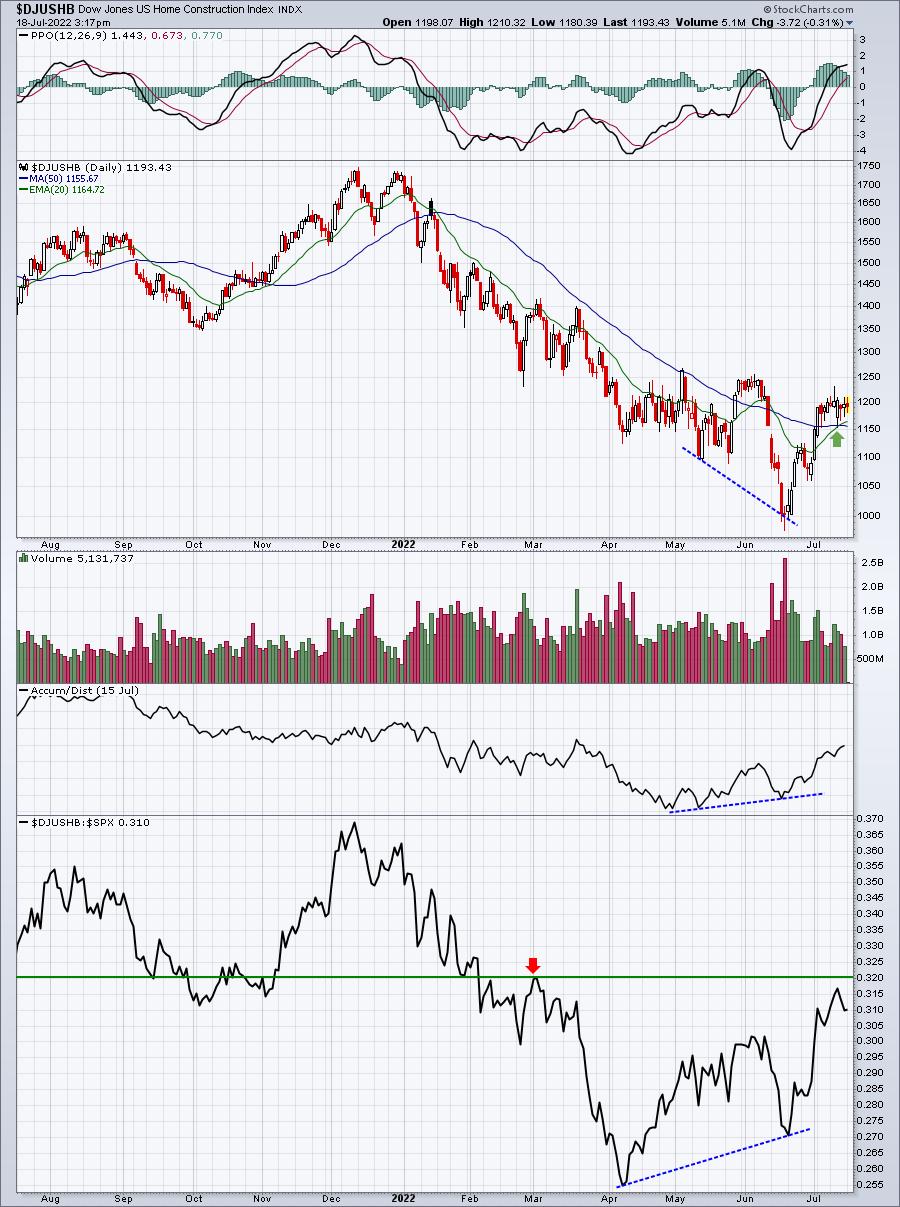
The DJUSHB looks like it bottomed to me in mid-June. That price low saw the AD line moving higher, as well as relative strength improving. Last week, relative strength nearly reached the early-March relative high. So while news continues to deteriorate, the DJUSHB had moved close to a 5-month relative high. Wall Street is now pricing in what it expects 6-9 months from now and it appears to be liking what it's seeing.
ChartLists/Strategies
Personally, I've exited ALL of my leveraged ETFs. As I've stated on a few occasions, I prefer trading ETFs coming out of bottoms, rather that individual stocks. I will still own individual stocks, but moves off the bottom can be swift and leveraged ETFs can provide great short-term returns. Those with lower risk tolerance can ignore leveraged ETFs and just stick with ETFs that track key sectors or indices at a 1x clip.
The chart of the NASDAQ above shows us that this index hit very key short-term price and gap resistance. I think it's prudent to respect this price resistance - until we can clear it.
It's also important to distinguish between trading strategies and investing strategies. I am fully invested in my retirement accounts using the QQQ. That's it. I believe we bottomed in mid-June and I'm remaining long in the QQQ until I feel differently about the overall market environment. I'm not trading there. In my taxable trading account, however, I am much more frequently swing trading than I have at any point in 2022. I am avoiding short positions and trading on the long side when I feel the reward-to-risk is solid. Today's reversal has moved me back to cash for now. I know this is a poor week historically, and a big afternoon reversal could lead to more short-term challenges. I'd rather sit it out right now. That's just my preference.
Earnings Reports
Here are the key earnings reports for the next two days, featuring stocks with market caps of more than $10 billion. I also include several companies with market caps below $10 billion. Finally, any portfolio stocks that will be reporting results are highlighted in BOLD. If you decide to hold a stock into earnings, please understand the significant short-term risk that you are taking. Please be sure to check for earnings dates for any companies you own or are considering owning.
Monday, July 18:
BAC, IBM, SCHW, GS, PLD, SYF, ELS
Tuesday, July 19:
JNJ, NVS, LMT, NFLX, TFC, HAL, IBKR, JBHT, CFG, OMC, FHN, SBNY, HAS, ALLY, PNFP, MAN
Economic Reports
July housing market index: 55 (actual) vs. 66 (estimate)
Happy trading!
Tom