
EB Daily Market Report - Friday, July 22, 2022
Executive Market Summary
- Futures were relatively flat and mixed as we approached today's opening bell
- The Dow Jones and S&P 500 have shown leadership throughout the day, though all of our major indices are lower
- Despite the first significant selling in awhile, the Volatility Index ($VIX, -0.04%) hasn't really budged and is flat
- Crude oil ($WTIC, -1.87%) has fallen another 2 bucks as it nears very key price support near $93 per barrel
- Despite the weak crude prices, energy (XLE, -0.61%) is down just fractionally
- Leadership is from defensive sectors as utilities (XLU, +0.84%), real estate (XLRE, +0.41%), and consumer staples (XLP, +0.34%) - the latter is featured below
- Communication services (XLC, -3.52%) is having a very rough session after Snap, Inc. (SNAP, -38.89%) took down the broader internet space ($DJUSNS, -5.49%) with an ugly earnings report
- Semiconductors ($DJUSSC, -2.92%) have seen their winning streak end at 7 straight closing highs - barring a magical final 30-minute recovery
Market Outlook
The first 6 months of the year we awaited the resetting of sentiment, which we eventually saw when the 5-day moving average of the equity only put call ratio ($CPCE) finally touched .80. That was evidence of extreme fear and that coincided perfectly with the S&P 500 bottom. I always say that sentiment helps us to mark bottoms as it usually takes panic in a bear market to encourage the final sellers. But this 5-day moving average can also help us spot short-term tops. The red-dotted vertical lines on the chart below highlight short-term bottoms in the 5-day SMA of the CPCE:
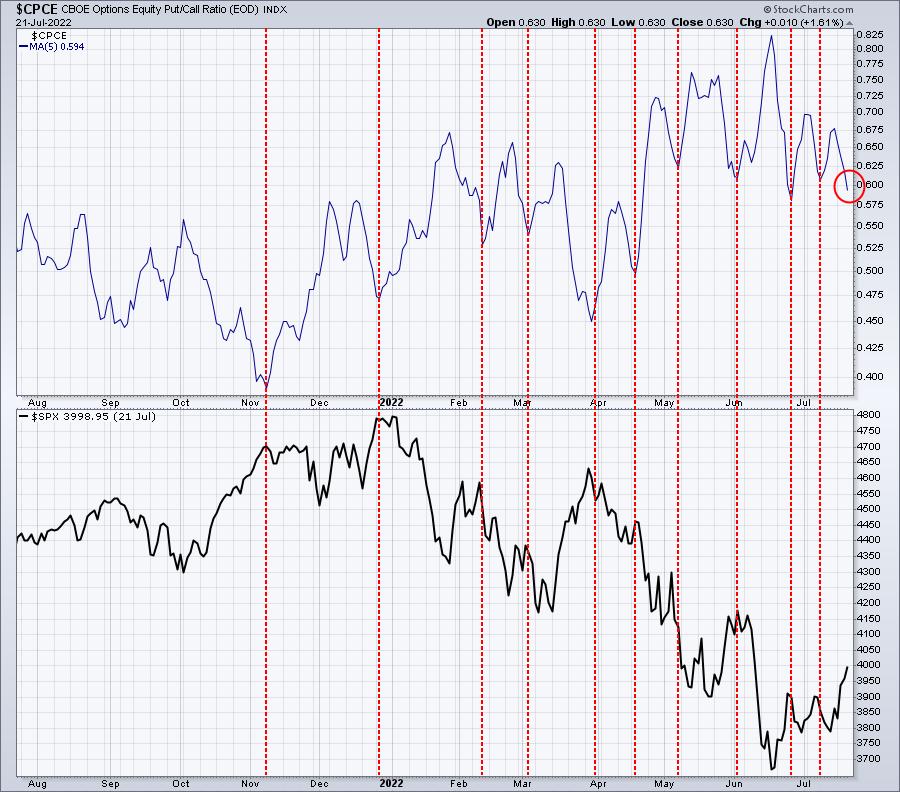
I would argue that at every significant turning point (up) in the 5-day SMA of the CPCE, the S&P 500 saw lower prices over the next week. Currently, we haven't shown that the 5-day SMA of the CPCE has bottomed as it continues to fall. But when it does turn back up, that'll most likely coincide with the next short-term pullback in the S&P 500. Maybe today's close will signal that top is already in place. We won't know until the CPCE updates after today's close.
Sector/Industry Focus
While we've seen the S&P 500 and NASDAQ power forward the past month or so, setting new short-term highs in the process, that has not been the case for consumer staples stocks (XLP). This defensive sector made a bold move higher in late June, but has failed repeatedly to extend that earlier strength:
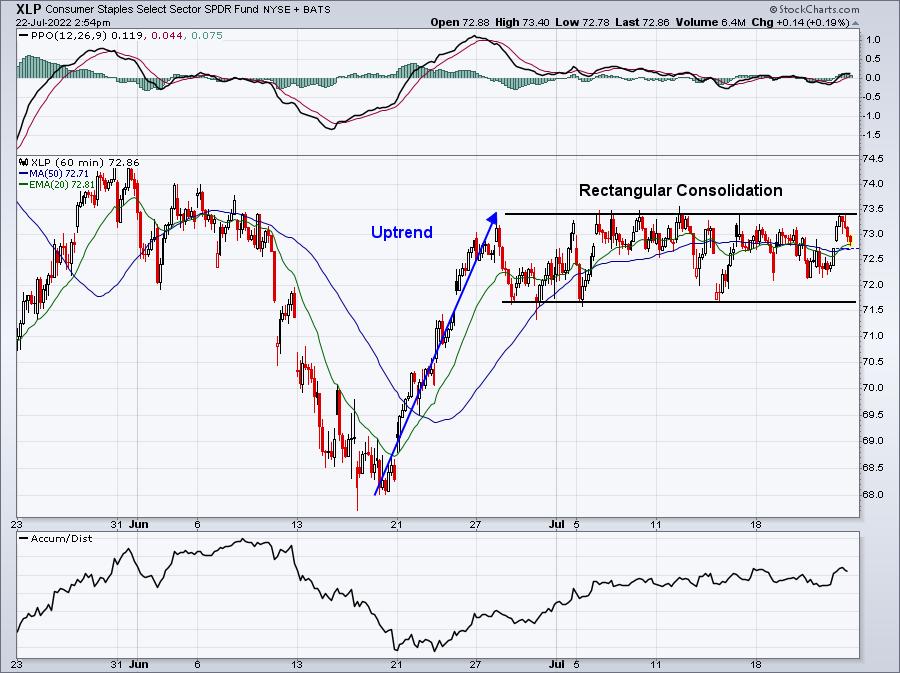
The back and forth action of late is contained within a rectangular consolidation pattern. This type of pattern is bullish when it follows an uptrend as it's considered a bullish continuation pattern. A close above 73.50 would confirm the pattern and likely signal higher prices ahead.
ChartLists/Strategies
MedPace Holdings (MEDP) could be a stock to watch into earnings. They report on Monday after the closing bell. Here's how the chart currently looks:
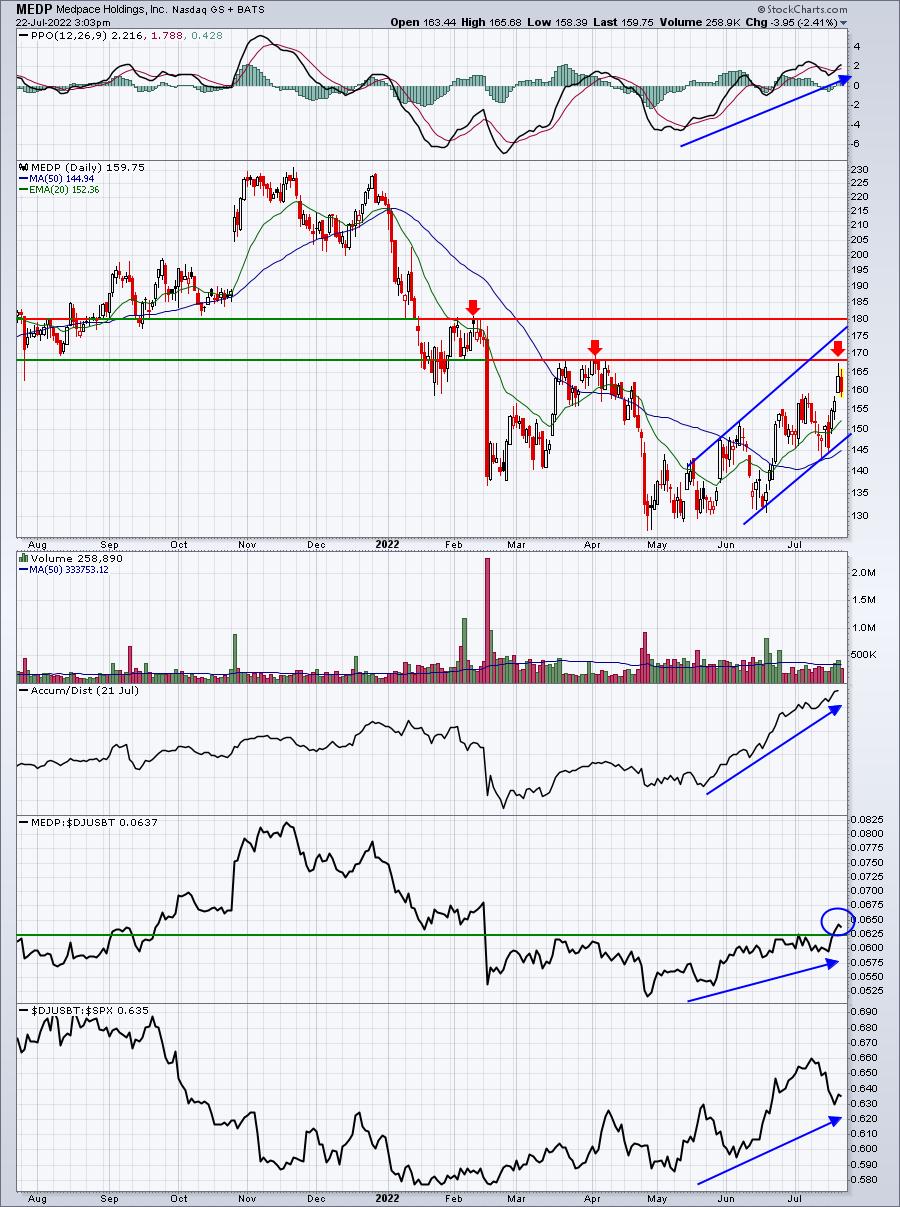
MEDP raised its guidance in April when it last reported quarterly results. Since that time, it's been trending higher, its relative strength has improved, and Wall Street appears to be accumulating based on the solid AD line. I won't be at all surprised if we see a very good report from MEDP.
Earnings Reports
Here are the key earnings reports for the next two days, featuring stocks with market caps of more than $10 billion. I also include several companies with market caps below $10 billion. Finally, any portfolio stocks that will be reporting results are highlighted in BOLD. If you decide to hold a stock into earnings, please understand the significant short-term risk that you are taking. Please be sure to check for earnings dates for any companies you own or are considering owning.
Friday, July 22:
VZ, NEE, AXP, HCA, SLB, ROP, TWTR, RF, CLF, ALV, GNTX
Monday, July 25:
NXPI, CDNS, NEM, ARE, PHG, SUI, BRO, PKG, RPM, WHR, FFIV, RRC, MEDP, CR, HXL, SSD, PCH, SQSP, HTLF
Economic Reports
None
Happy trading!
Tom