
EB Daily Market Report - Wednesday, July 27, 2022
ChartLists
I have updated three key ChartLists as follows:
- Strong Earnings ChartList (SECL)
- Strong Future Earnings ChartList (SFECL)
- Short Squeeze ChartList (SSCL)
They are all available for viewing/download on our website. I'll try to update a few others by tomorrow.
Executive Market Summary
- Futures were very strong overnight after a plethora of big tech companies reported quarterly results
- Our major indices have had a HUGE run, led by the more aggressive NASDAQ
- Sector leadership is positioned EXACTLY as we want it - technology (XLK, +4.35%), communication services (XLC, +4.28%), and consumer discretionary (XLY, +3.78%)
- All 11 sectors are higher, but the defensive utilities (XLU, +0.11%) lagged badly
- The Fed concluded its 2-day meeting and hike the fed funds rate by the expected 75 basis points
- Fed Chair Powell did suggest the Fed could slow the pace of hikes and that added even more fuel to the bullish market fire
- The 10-year treasury yield ($TNX) is down 5 basis points to 2.73% as money rotates further into bonds, squashing the long-term inflationary notion
- Enphase Energy (ENPH, +17.27%) is leading the S&P 500 after crushing revenue and EPS estimates
- Microsoft (MSFT, +6.94%) is leading the Dow Jones higher, despite missing both its revenue and EPS estimate
Market Outlook
I was looking for a big reversal off the 20-day EMA test and that's exactly what we've seen. What a day!!!
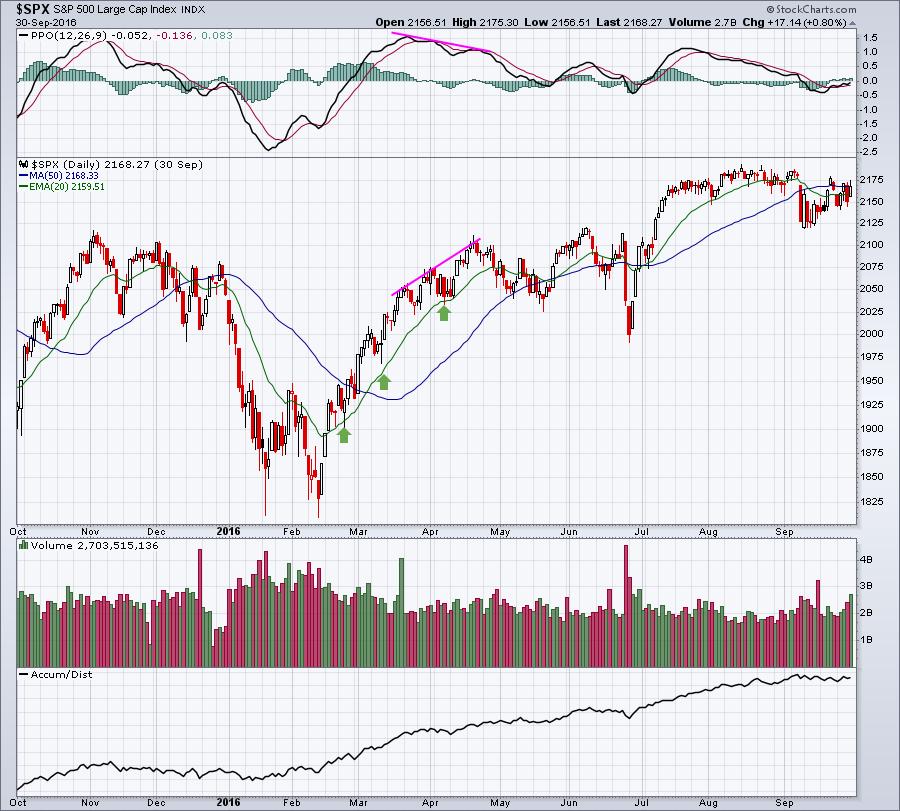
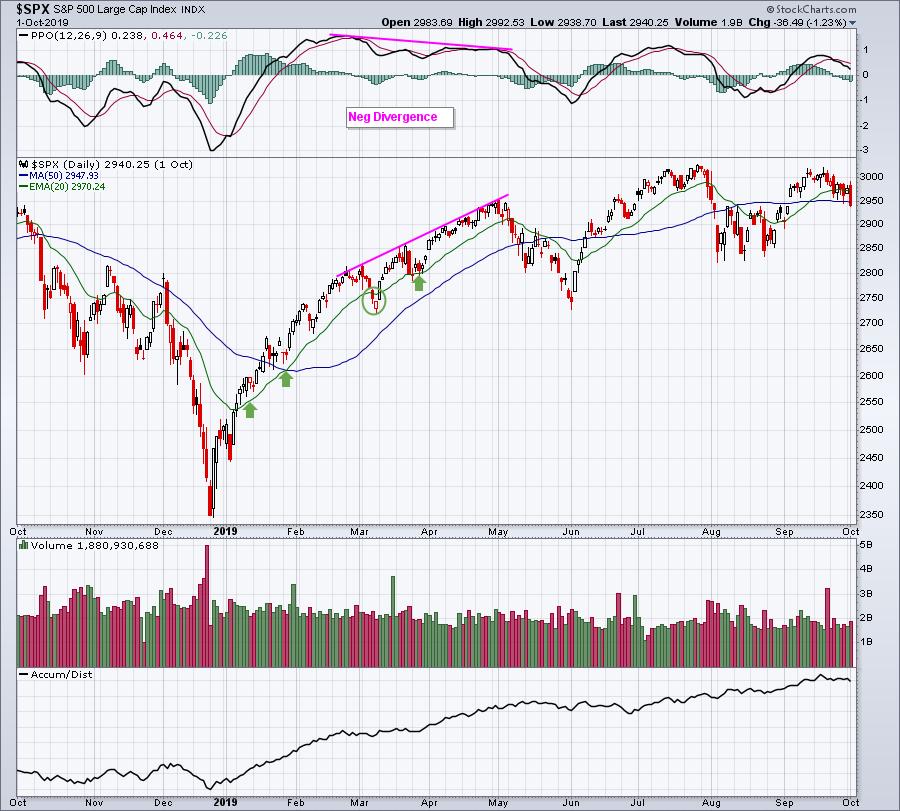
I am going to illustrate how the stock market traded once bottoms formed in 2009, 2016, 2018, and 2022, so that you'll have knowledge of what we should expect IF the June bottom was THE bottom, which I believe it was:
2009:
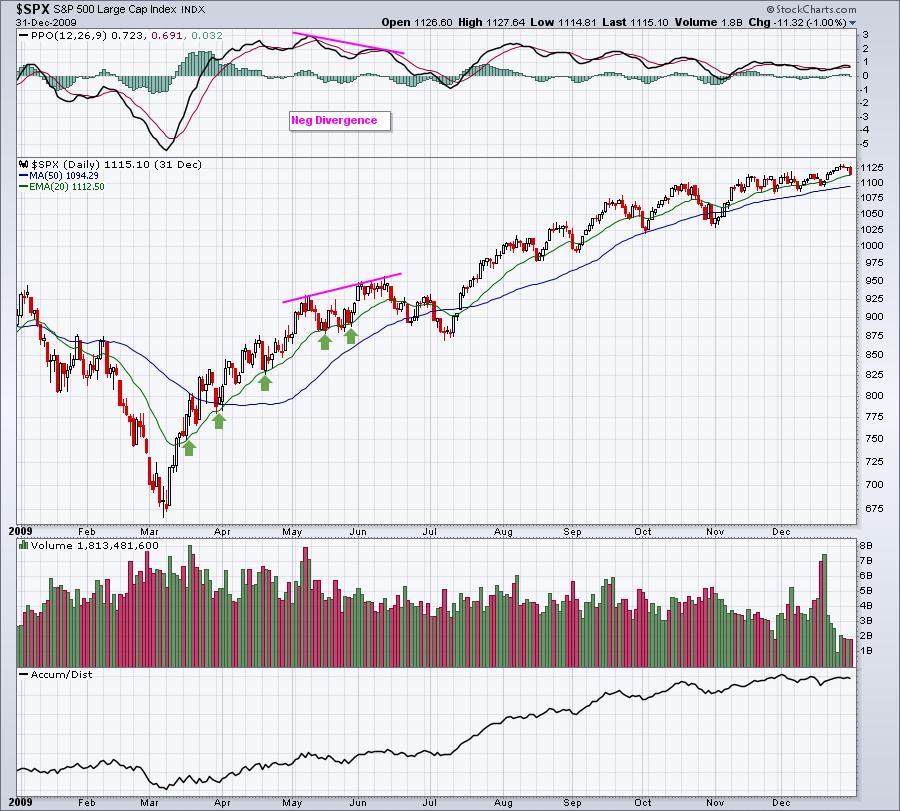
Once the bottom formed and the uptrend began, we didn't see weakness until a few months later AFTER a negative divergence formed. Until then, every 20-day EMA test was successful.
2016:
2018:
2020:
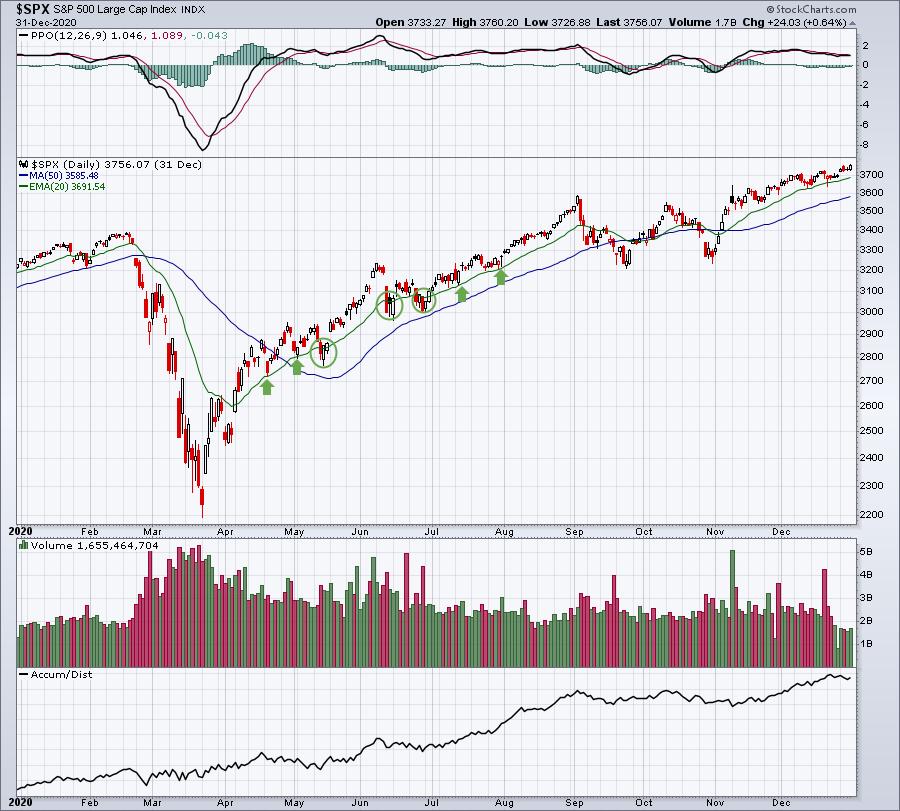
The takeaway on these charts is that when a bottom forms, the market waits for NO ONE. I've previously provided a chart showing that of all the bear markets since 1950 (14 of them), the WORST 1-year return from the bear market bottom was 29% and the best one was 80%. You don't want to miss the rally off the bottom. That is the absolute best opportunity to make some serious financial gain.
Sector/Industry Focus
Internet stocks ($DJUSNS) are surging today, led by Alphabet's outsized gains. When was the last time you've seen MSFT and GOOGL miss both revenue and EPS estimates and lead a 4% rally in the NASDAQ? Never? Yeah, probably never. These two stocks have both been crushed and all the bad news is priced in. In particular, check out the rally in internet stocks:
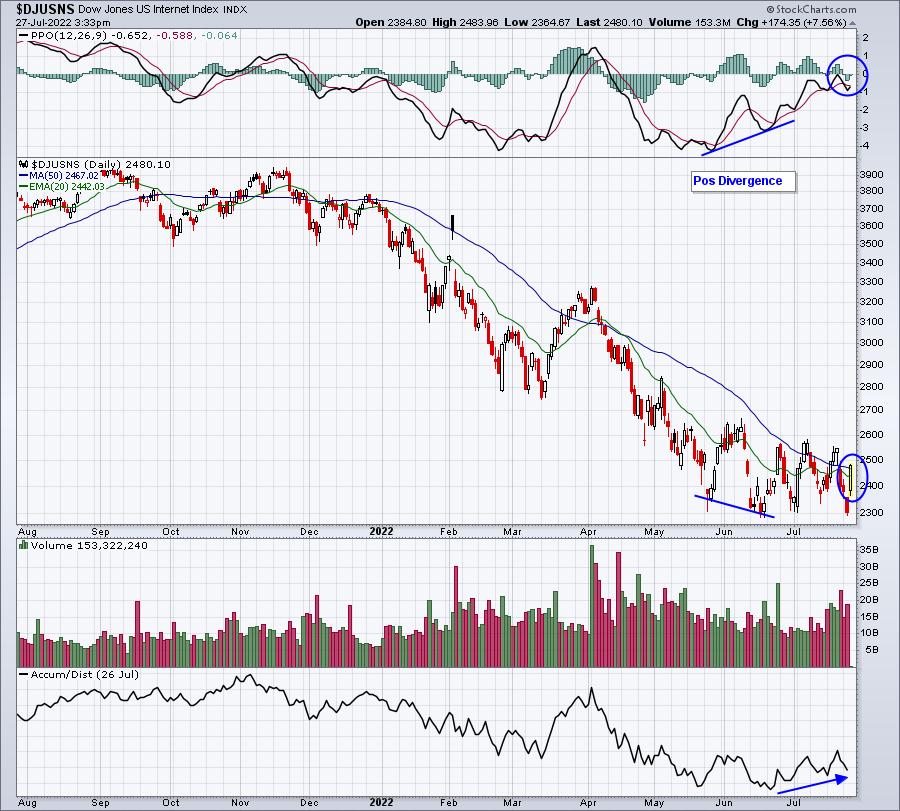
The positive divergence was already in place. But the feel of this rally is different, as opposed to the last couple. The AD line is turning higher and I fully expect we're going to see the PPO make a bullish centerline crossover.
When bad news comes out in the form of earnings and we get this type of massively bullish reaction, it's time to put away the bear market card.
ChartLists/Strategies
I like to pick my spots to use leverage. I tend to do it only when I can keep my stop fairly tight. As I discussed yesterday, the QLD (tracks NASDAQ 100 Index at a 2 to 1 clip). I illustrated what bottoms generally look like and how uptrends can be unrelenting once a bottom is in. History tells us that rising 20-day EMAs can be a very effective entry point, and that's why I suggested the use of the leveraged QLD as we approached the 20-day EMA of the NASDAQ 100 ($NDX). For those unwilling to take the risks associated with leveraged ETFs, the QQQ was a solid way to take advantage of the recent pullback.
In the updated Strong Earnings ChartList (SECL), here's a stock that looks like it's breaking out:
SCI:
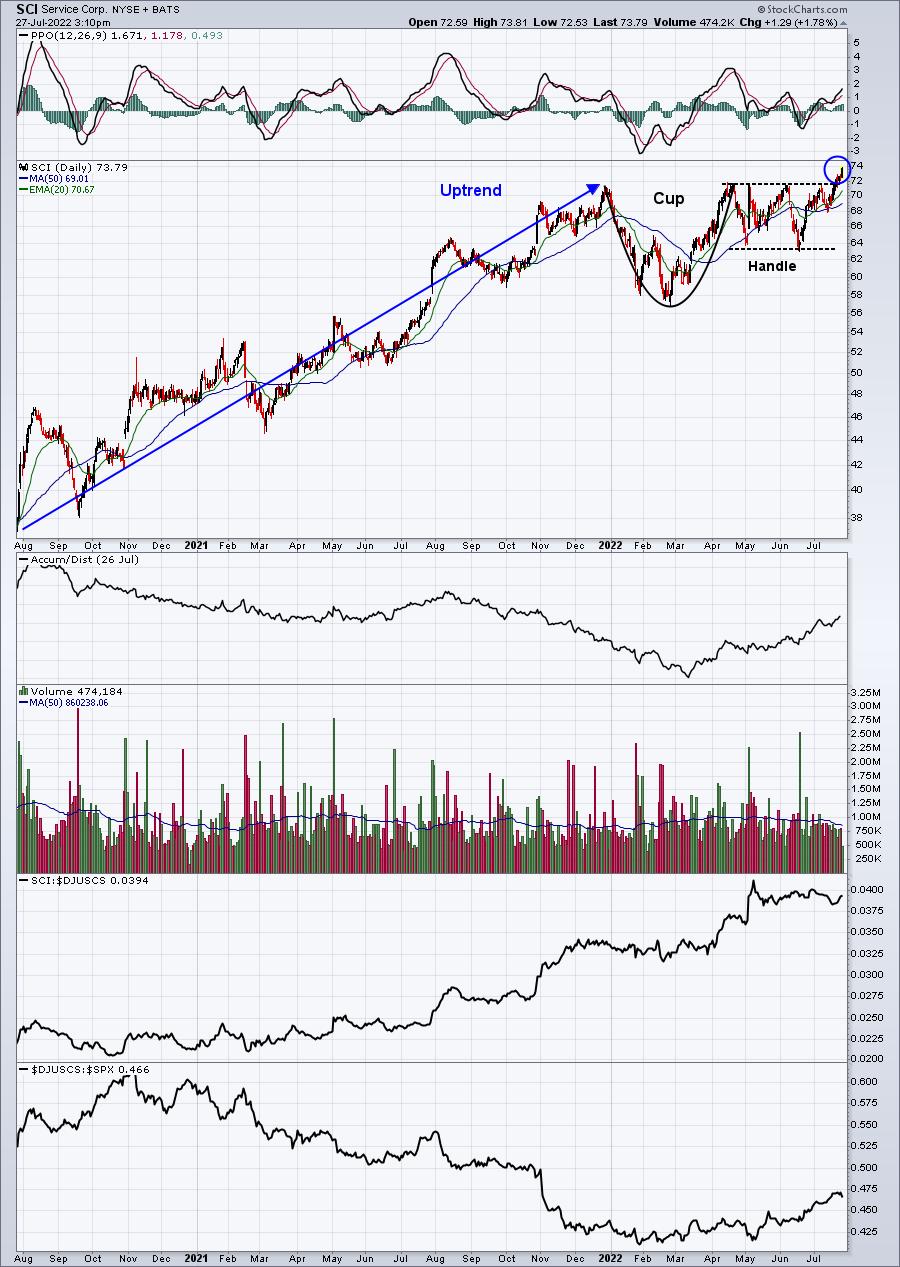
The depth of the cup is roughly 15 bucks. If we add that to the breakout level near 72, that gives us an 87 target - in time.
Earnings Reports
Here are the key earnings reports for the next two days, featuring stocks with market caps of more than $10 billion. I also include several companies with market caps below $10 billion. Finally, any portfolio stocks that will be reporting results are highlighted in BOLD. If you decide to hold a stock into earnings, please understand the significant short-term risk that you are taking. Please be sure to check for earnings dates for any companies you own or are considering owning.
Wednesday, July 27:
META, QCOM, TMUS, BMY, BA, ADP, NOW, CME, SHW, LRCX, WM, HUM, GD, EQIX, NSC, BSX, F, AEP, SHOP, KHC, ORLY, APH, TEL, CTSH, LYG, HLT, VICI, ODFL, HES, OTIS, AVB, AWK, ROK, RCI, DRE, INVH, SPOT, ALGN, GPC, GRMN, GIB, MAA, RJF, URI, TDY, AEM, ICLR, ROL, CINF, MOH, HOLX, UMC, ACGL, SSNC, EQT, TYL, CS, AVY, BG, CSL, TECK, PTC, CHRW, ETSY, AR, QGEN, LW, RE, GGG, CCJ, FBHS, PAG, OC, TEVA, TDOC, MUSA, MKSI, OPCH, INFA, SLAB, DRVN, COLM, QS, IART, TPX, NCR, AMED, KGC, PEGA, R, TMHC, MMSI, FORM, MMYT, MXL, MC, UPWK, GPI, SIMO, SHOO, COUR, BOOT, PI, CCS, CAKE, LC, EXTR
Thursday, July 28:
AAPL, AMZN, MA, HSY, PFE, MRK, TMO, CMCSA, INTC, LIN, SNY, HON, AMT, MO, SO, NOC, CP, VALE, EW, TRP, KLAC, KDP, VLO, LHX, ABEV, XEL, DLR, AJG, CVE, BAX, BCS, CARR, DXCM, STM, SGEN, TROW, PCG, SIRI, DTE, LUV, EIX, CLR, WST, LH, FTS, WTW, MT, HIG, FMX, FTV, MLM, ARGX, VRSN, BSBR, ARES, CMS, YUMC, AVTR, VFC, SWK, ALNY, IP, BIO, LKQ, CPT, TXT, KIM, MAS, CG, GLPI, BEN, CE, TFX, EMN, ROKU, RS, LBTYA, MMP, ZEN, AOS, RCL, MHK, CFR, LII, FSLR, DECK, OLN, HTZ, FIVN, FCN, BPOP, TXRH, HLI, CC, X, HOG, HP, AUY, VIRT, MTSI, VC, BTU, WING, STNG, ARCH, TLRY, VSTO, UCTT, INFN, IMAX
Economic Reports
June durable goods: +1.9% (actual) vs. -0.5% (estimate)
June durable goods ex-transports: +0.3% (actual) vs. +0.2% (estimate)
June pending home sales: -8.6% (actual) vs. -1.0% (prior)
FOMC announcement at 2:00pm ET
Happy trading!
Tom